Epidemiological Analysis of the Coronavirus Disease Outbreak with Random Effects
←
→
Page content transcription
If your browser does not render page correctly, please read the page content below
Computers, Materials & Continua                                                               Tech Science Press
DOI:10.32604/cmc.2021.014006
Article

                    Epidemiological Analysis of the Coronavirus Disease
                              Outbreak with Random Effects
             Muhammad Farman1 , Aqeel Ahmad1 , Ali Akgül2, * , Muhammad Umer Saleem3 ,
                         Muhammad Naeem4 and Dumitru Baleanu5,6,7

                      1
                         Department of Mathematics and Statistics, University of Lahore, Pakistan
            2
              Department of Mathematics, Faculty of Art and Science, Siirt University, Siirt, 56100, Turkey
                        3
                          Department of Mathematics, University of Education, Lahore, Pakistan
          4
            Department of Economics and Business Administration, University of Education, Lahore, Pakistan
                       5
                         Department of Mathematics, Cankaya University, Balgat, 06530, Turkey
                           6
                             Institute of Space Sciences, Magurele-Bucharest, R76900, Romania
                 7
                   Department of Medical Research, China Medical University, Taichung,40402, Taiwan
                           *
                             Corresponding Author: Ali Akgül. Email: aliakgul00727@gmail.com
                                     Received: 30 August 2020; Accepted: 07 January 2021

                 Abstract: Today, coronavirus appears as a serious challenge to the whole
                 world. Epidemiological data of coronavirus is collected through media and
                 web sources for the purpose of analysis. New data on COVID-19 are available
                 daily, yet information about the biological aspects of SARS-CoV-2 and epi-
                 demiological characteristics of COVID-19 remains limited, and uncertainty
                 remains around nearly all its parameters’ values. This research provides the
                 scientific and public health communities better resources, knowledge, and
                 tools to improve their ability to control the infectious diseases. Using the
                 publicly available data on the ongoing pandemic, the present study investigates
                 the incubation period and other time intervals that govern the epidemiological
                 dynamics of the COVID-19 infections. Formulation of the testing hypotheses
                 for different countries with a 95% level of confidence, and descriptive statistics
                 have been calculated to analyze in which region will COVID-19 fall according
                 to the tested hypothesized mean of different countries. The results will be help-
                 ful in decision making as well as in further mathematical analysis and control
                 strategy. Statistical tools are used to investigate this pandemic, which will be
                 useful for further research. The testing of the hypothesis is done for the differ-
                 ences in various effects including standard errors. Changes in states’ variables
                 are observed over time. The rapid outbreak of coronavirus can be stopped
                 by reducing its transmission. Susceptible should maintain safe distance and
                 follow precautionary measures regarding COVID-19 transmission.

                 Keywords: Covid-19; infectious disease; statistical analysis; p-value;
                 epidemiology hypothesis

                      This work is licensed under a Creative Commons Attribution 4.0 International License,
                      which permits unrestricted use, distribution, and reproduction in any medium, provided
                      the original work is properly cited.
3216                                                                        CMC, 2021, vol.67, no.3

1 Introduction
     Severe Acute Respiratory Syndrome (SARS) is also caused by a coronavirus and plays an
important role for its investigation [1]. According to the group of investigators, SARS and coro-
navirus have many similar features [2]. RNA enveloped virus known as coronavirus is spreading
particularly among humans, mammals and birds. Many respiratory, enteric, hepatic and neuro-
logical diseases are caused by coronavirus [3,4]. Human disease is caused by six different types
of coronavirus [5]. The symptom of the common cold in immune-compromised individuals is
caused by 229E, OC43, NL63 and HKU1 coronaviruses whereas other 2 coronavirus types are
zoonotic in origin. These two are Severe Acute Respiratory Syndrome Coronavirus (SARS-CoV)
and Middle East Respiratory Syndrome Coronavirus (MERS-CoV). SARS-CoV and MERS-CoV
are fatal in their nature [6]. In 2002 and 2003, Guangdong (the province of China) faced major
outbreaks of acute respiratory syndrome which has a caustic agent of SARS-CoV. The Middle
East suffered from severe respiratory disease outbreaks which have a caustic agent of MERS-CoV
in 2012. Given the high occurrence and wide dispersal of coronaviruses, the large inherent variety
and frequent recombination of their genomes, which is increasing interface between human and
animal activities, novel coronaviruses are likely to emerge periodically in humans owing to frequent
cross-species infections and occasional spillover events [7,8].
    In 2019, China faced a major outbreak of Coronavirus disease 2019 (COVID-19) and this
outbreak had the potential to become a worldwide pandemic [9]. Interventions and real-time data
are needed for the control on this outbreak of coronavirus [10]. In previous studies, the transfer
of the virus from one person to another person, its severity and history of the pathogen in
the first week of the outbreak has been explained with the help of real-time analysis [11]. In
December 2019, a group of people in Wuhan admitted to the hospital that all were suffering from
pneumonia and the cause of pneumonia was idiopathic. Most of the people linked the cause of
pneumonia with the eating of wet markets and seafood. Investigation on etiology and epidemiol-
ogy of disease was conducted on the 31st December 2019 by Chinese Center for Disease Control
and Prevention (China CDC) with the help of Wuhan city health authorities [8]. Epidemical
changings were measured by time-delay distributions including date of admission to hospital and
death. According to the clinical study on the COVID-19, symptoms of coronavirus appear after
7 days of onset of illness [12]. The time from hospital admission to death is also critical to the
avoidance of underestimation when calculating case fatality risk [13]. COVID-19 epidemiological
data and incubation period were measured through public data on known cases [14]. More detail
can be found in [15–20].

2 Materials and Method
     WHO is working closely with clinicians caring for patients with COVID-19, in China and
across the globe. International experts on infectious disease can give better understanding, real-
time data, the clinical presentation, natural history and treatment interventions for COVID-19.
A majority of patients with COVID-19 are adults. Among 44672 patients in China with confirmed
infection, 2.1% were of or under the age of 20. The most commonly reported symptoms included
fever, dry cough, and shortness of breath, and most patients (80%) experienced mild illness.
Approximately 14% experienced severe diseases and 5% were critically ill. Early reports suggested
that illness severity is associated with age above sixty (>60 years old) and comorbidity [15]. The
latest outbreak of coronavirus 2019 was noted on March 12, 2020 [16] when coronavirus cases
were 126,369 with 4,633 deaths and a recovered population of 68,304. Active cases were 53428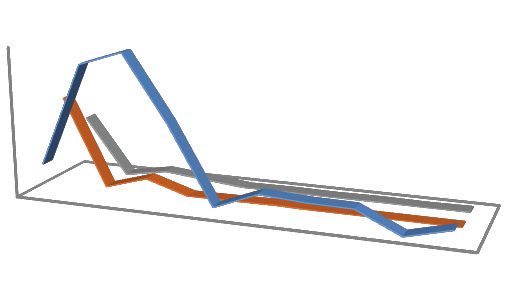
CMC, 2021, vol.67, no.3                                                                           3217

out of those 89% were in mild condition and 11% were critical. In closed cases recovered were
94 % and deaths were 6%. Data used for analysis is given in Tabs. 1 and 2.

                             Table 1: Worldwide data of COVID-19 combined
              Closed cases                           Active cases
              Total       Death      Recovered       Mild condition    Critical condition
              114502      4027       64273           32569             7094

                                  Table 2: Country-wise of COVID-19
         S.No Country                 Total cases Total death Total recovered Active cases
         1       China                80757      3136          60096           1725
         2       South Korea          7513       54            247             7212
         3       Italy                9172       463           724             7985
         4       Iran                 7161       237           2349            4530
         5       Japan                530        9             101             420
         6       France               1412       30            12              1370
         7       Germany              1224       2             16              1204
         8       Spain                1231       30            2               1169
         9       Singapore            160                      78              67
         10      USA                  729        27            9               687
         11      Hong Kong            100        2             36              62
         12      Diamond Princes      706        7             100             599
         13      Kuwait               56                                       56
         14      Bahrain              49                                       49
         15      Thailand             43         1             30              12
         16      Taiwan               41         1             12              28
         17      UK                   40                       8               32
         18      Australia            33         1             15              17
         19      Switzerland          30                       1               29
         20      Malaysia             29                       22              7
         21      Canada               27                       7               20
         22      Iraq                 26                                       26
         23      Norway               25                                       15
         24      UAE                  21                       6               16
         25      Austria              18                                       18
         26      Netherlands          18                                       18
         27      Vietnam              16                       16
         28      Sweden               15                                       15
         29      Lebanon              13                                       13
         30      Israel               12                       1               11
         31      mACAO                10                       6               4
                                                                                    (Continued)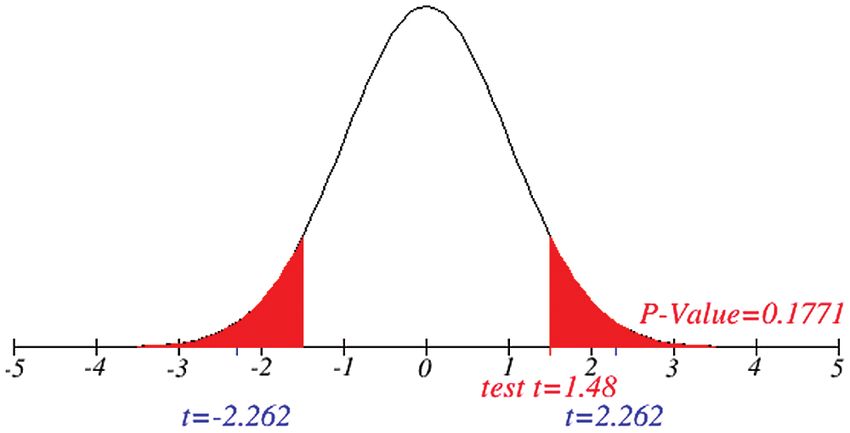
3218                                                                 CMC, 2021, vol.67, no.3

                                     Table 2: Continued
       S.No Country              Total cases Total death Total recovered Active cases
       32   Iceland              9                                       9
       33   San Marino           8           1                           7
       34   Belgium              8                        1              7
       35   Croatia              8                                       8
       36   Finland              7                        1              6
       37   Greece               7                                       7
       38   Qatar                7                                       7
       39   Ecuador              6                                       6
       40   India                6                        3              3
       41   Mexico               6                        1              5
       42   Oman                 6                        2              4
       43   Algeria              5                                       5
       44   Pakistan             5                                       5
       45   Czeshia              4                                       4
       46   Denmark              4                                       4
       47   Philippines          3           1            2              0
       48   Azerbaijan           3                                       3
       49   Georgia              3                                       3
       50   Romania              3                        1              2
       51   Russia               3                        2              1
       52   Brazil               2                                       2
       53   Egypt                2                        1              1
       54   Indonesia            2                                       2
       55   Portugal             2                                       2
       56   Afghanistan          1                                       1
       57   Andorra              1                                       1
       58   Armenia              1                                       1
       59   Belarus              1                                       1
       60   Cambodia             1                        1              0
       61   Dominican Republic   1                                       1
       62   Estonia              1                                       1
       63   Ireland              1                                       1
       64   Jordan               1                                       1
       65   Latvia               1                                       1
       66   Lithuania            1                                       1
       67   Luxembourg           1                                       1
       68   North Macedonia      1                                       1
       69   Monaco               1                                       1
       70   Morocco              1                                       1
       71   Nepal                1                        1              0
       72   New Zealand          1                                       1
                                                                             (Continued)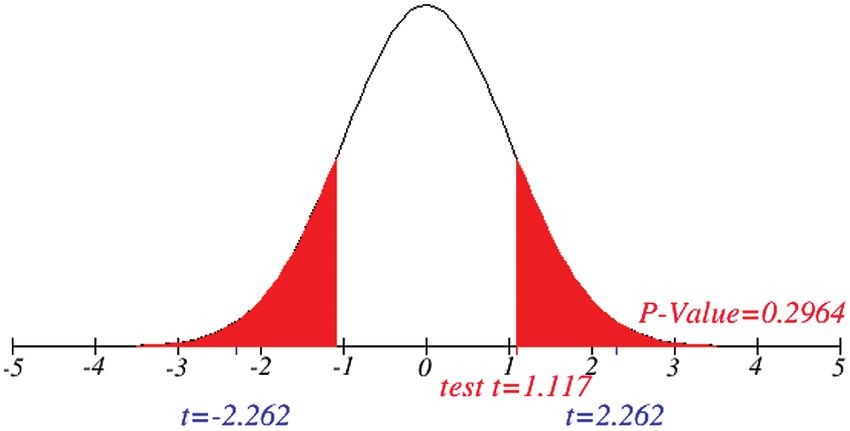
CMC, 2021, vol.67, no.3                                                                                  3219

                                           Table 2: Continued
       S.No     Country           Total cases     Total death           Total recovered   Active cases
       73       Nigeria           1                                                       1
       74       Saudi Arabia      1                                                       1
       75       Senegal           1                                                       1
       76       Sri Lanka         1                                     1                 0
       77       Tunisia           1                                                       1

3 Formulation for Data Analysis
3.1 Case-I
      Testing of hypothesis about mean of normal population when σ is unknown and n < 30. Let
x1 , x2 , . . . , xn be the observation in a small sample size n, taken from the normally distributed
population. Let x be the sample mean and s be the unbiased estimate of σ . So, the procedure of
testing hypothesis is given as:
    1. Formulate null and alternate hypothesis about µ, three possibilities occur:
        (a) Ho : µ = µo and H1 : µ 6= µo (two tailed)
        (b) Ho : µ ≤ µo and H1 : µ > µo (one sided)
        (c) Ho : µ ≥ µo and H1 : µ < µo (one sided)
    2. Decide upon the significance level α, as

                       s                    s
       P x − t α2 (v) √ < µ < x + t α2 (v) √ = 1 − α
                        n                    n
       where v = n − 1 degree of freedom.
    3. Computing the t-value from the sample data by using the test statistics as follows
            x − µo
       t=
              √s
                n

    4. Determine the critical region for which Ho corresponding to different alternative hypothesis
       is given in Tab. 3.

                               Table 3: Alternate hypothesis for case I
                       Alternate hypothesis            The critical region will be
                       H1 : µ 6= µo                    |t| ≥ t α2 (v)
                       H1 : µ > µo                     t ≥ tα, v
                       H1 : µ < µo                     t ≤ −tα, v

3.2 Case-II
    Suppose that we have two small random sample x11 , x12 , . . . , x1n1 and x21 , x22 , . . . , x2n2 from
two normally distributed population with a mean µ1 and µ2 and standard deviation σ1 and σ2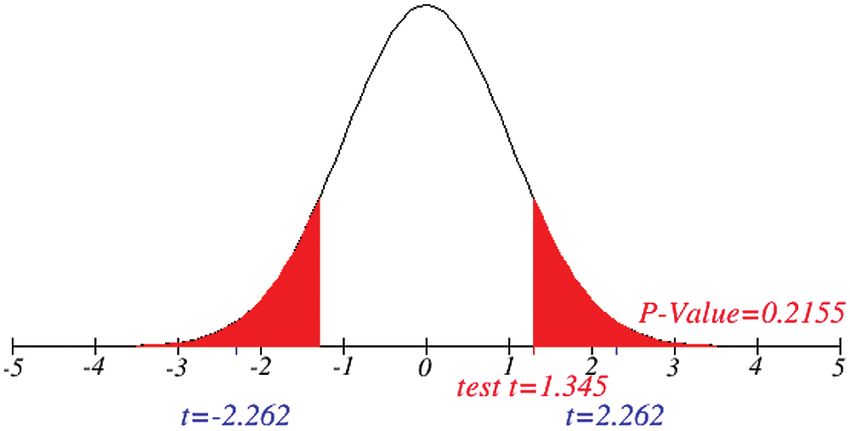
3220 CMC, 2021, vol.67, no.3
respectively. If σ1 6= σ2 , then we use their sample estimations s1 and s2 to compute the standard
error of the difference between means as:
s
s21 s22
σx1 −x2 = +
n1 n2
As there is no point in combining in σ12 and σ22 be obtained an estimate of the non-existing
common population. Consequently, using to test the hypothesis that difference between mean has
a specified value, so
1. Formulate null and alternate hypothesis about µ, three possibilities are presented as:
(a) Ho : µ1 − µ2 = ∆o and H1 : µ1 − µ2 6= ∆o (two tailed)
(b) Ho : µ1 − µ2 ≤ ∆o and H1 : µ1 − µ2 > ∆o (one sided)
(c) Ho : µ1 − µ2 ≥ ∆o and H1 : µ1 − µ2 < ∆o (one sided)
2. Decide upon the significance level α. Then, we obtain
s s
s21 s22 s21 s22
P x1 − x2 − t α2 (v) + < µ1 − µ2 < x1 − x2 + t α2 (v) + ,
n1 n2 n1 n2
where,
2
s21 s22
n1 + n2
v= 2 2
s2 s2
1 2
n1 n2
n1 −1 + n2 −1
3. Computing the t-value from the sample data by using the test statistics gives:
x1 − x2 − ∆o x1 − x2
t= r , if ∆o = 0, then t = r
s21 s2 s21 s2
n1 + n22 n1 + n22
4. Determine the critical region for which Ho corresponding to different alternative hypothesis
is given in Tab. 4.
Table 4: Alternate hypothesis for case II
Alternate hypothesis The critical region will be
H1 : µ1 − µ2 6= ∆o |t| ≥ t α2 (v)
H1 : µ1 − µ2 > ∆o t ≥ tα, v
H1 : µ1 − µ2 < ∆o t ≤ −tα, v
The following Tabs. 5a and 5b are used for the analysis of total country-wise data with a
different hypothesis and Tab. 6 is used to check the outbreak of the epidemic disease.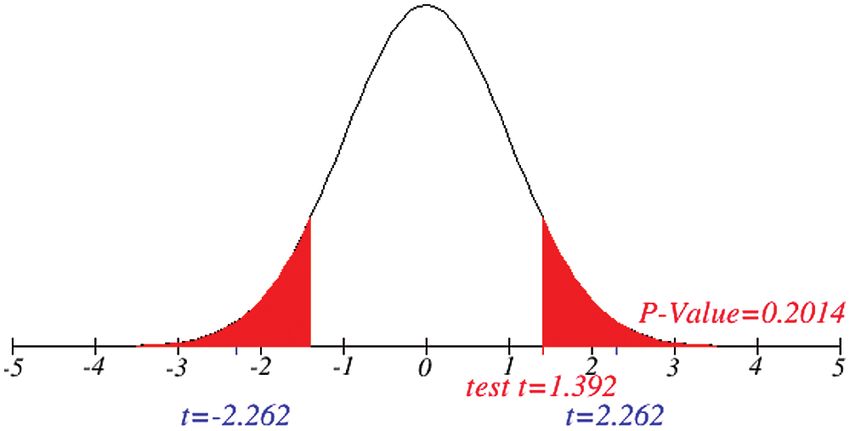
CMC, 2021, vol.67, no.3                                                                          3221

                              Table 5: Total data for statistical analysis
                                                 (a)
Country                   Population          Total Cases        Total Death     Total recovered
China                     1408626449          80757              3136            60096
South Korea               51269185            7513               54              247
Italy                     60461826            9172               463             724
Iran                      83639890            7161               237             2349
Japan                     126601378           530                9               101
France                    65273511            1412               30              12
Germany                   83969900            1224               2               16
Spain                     46754778            1231               30              2
Singapore                 5850342             160                                78
USA                       330370141           729                27              9
Sum                       2262817400          109889             3988            63634
Average                   226281740           10988.9            443.1111111     6363.4
Standard deviation        403010937.5         23477.28628        962.833601      17924.06309
hypothesized mean         0                   0                  0               0
Test statistics           1.776               1.48               1.455           1.123
DF                        9                   9                  9               9
significance level(p)     0.1095              0.173              0.1796          0.2906
95% CI for mean           −62014917.5410      −5805.7389         −245.6586       −6458.7023
                          to                  to 27783.5389      to 1131.8808    to 19185.5023
                          514578397.5410
                                                 (b)
Active Cases              Critical Condition Death Rate          Infected Rata   Recovered Rate
1725                      4794                0.038832547        5.73303E−05     0.744158401
7212                      36                  0.007187542        0.00014654      0.032876348
7985                      733                 0.050479721        0.000151699     0.078935892
4530                                          0.033095936        8.5617E−05      0.328026812
420                       33                  0.016981132        4.18637E−06     0.190566038
1370                      66                  0.021246459        2.16321E−05     0.008498584
1204                      9                   0.001633987        1.45767E−05     0.013071895
1169                      11                  0.024370431        2.63289E−05     0.001624695
67                        8                   0                  2.73488E−05     0.4875
687                       7                   0.037037037        2.20662E−06     0.012345679
26369                     5697                0.230864791        0.000537466     1.897604344
2636.9                    633                 0.023086479        5.37466E−05     0.189760434
2740.131619               1487.749232         0.016066786        5.32548E−05     0.241446607
0                         0                   0                  0               0
3.043                     1.345               4.544              3.191           2.485
9                         9                   9                  9               9
0.0139                    0.2114              0.0014             0.011           0.0347
676.7279 to 4597.0721     −431.2717           0.0116             0.0000          0.0170
                          to 1697.2717        to 0.0346          to 0.0001       to 0.3625
3222                                                                                                                                         CMC, 2021, vol.67, no.3

                                  Table 6: Testing of hypothesis for differences of mean
Different cases          Testing of hypothesis of     Testing of hypothesis of                                   Testing of hypothesis of      Testing of hypothesis of
                         total case and recovered     total cases and active cases                               total case and death case     total case and critical
                         case                                                                                                                  condition
Mean difference          4625.5                       8352                                                       10545.789                     10355.9
standard error           9340.53                      7474.565                                                   7430.411                      7439.062
Test statistics          0.459                        1.117                                                      1.419                         1.392
DF                       18                           18                                                         18                            18
significance level (p)   0.6264                       0.2785                                                     0.1729                        0.1809
95% CI for mean          −24249.2253 to 14998.2253    −7351.4794 to 24055.4794                                   −5064.9245 to 26156.5023      −5272.9884 to 25984.7884

4 Discussion
     The mean incubation period was 5.2 days (95% confidence interval, 4.1 to 7.0), with the 95th
percentile of the distribution at 12.5 days. In its early stages, the epidemic doubled in size every 7.4
days. With a mean serial interval of 7.5 days (95% CI, 5.3 to 19), the basic reproductive number
was estimated to be 2.2 (95% CI, 1.4 to 3.9) [17]. Across the analyzed period, the delay between
symptom onset and seeking care at a hospital or clinic were longer in Hubei province than in
other provinces in mainland China and internationally. In mainland China, these delays decreased
from 5 days before January 18, 2020, to 2 days thereafter until January 31, 2020 (p = 0 · 0009).
Although our sample captures only 507 (5 · 2%) of 9826 patients with COVID-19 reported by
official sources during the analyzed period, our data align with an official report published by
Chinese authorities on January 28, 2020 [11].

                                                    100000

                                                     50000                                     Total Cases…

                                                            0

                     Figure 1: Outbreak of total cases and recovered cases of corona virus

                                              8000                                                            Active cases of
                                              6000                                                            corona virus
                                              4000
                                              2000
                                                 0
                                                            China
                                                      South Korea
                                                                    Italy
                                                                            Iran
                                                                                   Japan
                                                                                           France
                                                                                                    Germany
                                                                                                               Spain
                                                                                                                       Singapor
                                                                                                                                  USA

  Figure 2: Outbreak of Active cases, Critical condition and death individual with corona virus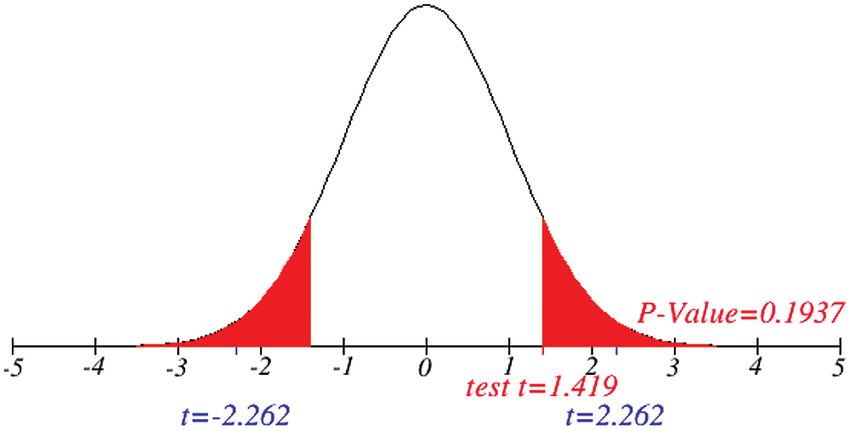
CMC, 2021, vol.67, no.3                                                                         3223

    Figs. 1 and 2 represent the actual status of total cases, recovered cases, active cases, critical
conditions and death cases of COVID-19 for the major affected countries till March 10, 2020.
Fig. 3 represents the comparison of the worldwide effect of coronavirus with time delay which
shows how coronavirus spread in a fast way during last week till 17-03-2020. Figs 4–8 represent
the behavior of developed hypotheses with zero hypothesized mean of total cases, recovered, death
and active cases including critical condition for the p-value respectively. Figs 9–12 represent the
behavior of developed hypotheses of differences total cases with other compartments for the p
value of zero hypothesized difference mean.

                               200000
                               180000
                               160000                 Crona virus case in
                               140000                 the world till 10-…
                               120000
                               100000
                                80000
                                60000
                                40000
                                20000
                                    0

                 Figure 3: Comparison of coronavirus outbreak with time delay

                   Figure 4: Testing of hypothesis for average coronavirus cases

                      Figure 5: Testing of hypothesis for average death cases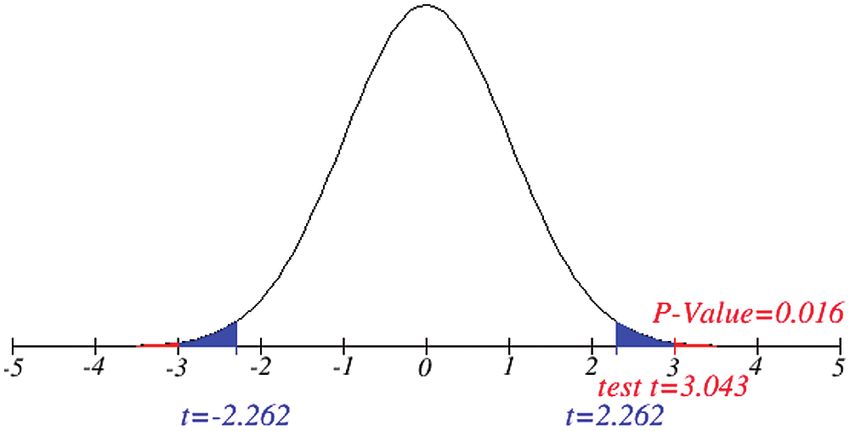
3224                                                                      CMC, 2021, vol.67, no.3

                 Figure 6: Testing of hypothesis for average recovered cases

                   Figure 7: Testing of hypothesis for average active cases

                  Figure 8: Testing of hypothesis for average critical cases

       Figure 9: Testing of hypothesis for difference between total and recovered cases
CMC, 2021, vol.67, no.3 3225
Figure 10: Testing of hypothesis for differences of total and death cases
Figure 11: Testing of hypothesis for differences of total and active cases
Figure 12: Testing of hypothesis for differences of total and critical condition
5 Conclusion
Investigation of developed hypotheses for different countries with 95% confidence and the
average effects were calculated country-wise including p-value which shows how much significance
is increased in COVID 19. Also, the hypothesis was developed for the differences of different
effects with total cases including standard error with zero hypothesized difference mean. Ulti-
mately a decision was made for the developed hypothesis to accept or reject our null hypothesis.
Graphical representation of spread virus with developed hypotheses can be easily analyzed to
show the actual behavior and effect of diseases. Comparison was made to check the increasing
effects worldwide over the time.3226 CMC, 2021, vol.67, no.3
Acknowledgement: We certify that the information that we have presented here is accurate and
complete to the best of our knowledge.
Funding Statement: The authors received no specific funding for this study.
Conflicts of Interest: The authors declare that they have no conflicts of interest to report regarding
the present study.
References
[1] R. S. Baric, K. Fu, W. Chen and B. Yount, “High recombination and mutation rates in mouse
hepatitis virus suggest that coronaviruses may be potentially important emerging viruses,” Advances in
Experimental Medicine and Biology, vol. 380, pp. 571–576, 1995.
[2] R. Mark and M. D. Denison, Coronavirus Research: Keys to Diagnosis, Treatment and Prevention of SARS.
Bookshelf ID, NBK92477: ncbi, National Academy of Sciences, 2004.
[3] S. R. Weiss and J. L. Leibowitz, “Coronavirus pathogenesis,” Advances in Virus Research, vol. 81, pp. 85–
164, 2011.
[4] P. S. Masters, S. Perlman and S. Coronaviridae, In: D. M. Knipe, P. M. Howley (Eds.), Fields Virology,
6th ed., vol. 2. Philadelphia: Lippincott Williams & Wilkins, pp. 825–858, 2013.
[5] S. Su, G. Wong, W. Shi, J. Lue, A. C. K. Lai et al., “Epidemiology, genetic recombination, and
pathogenesis of coronaviruses,” Trends Microbiology, vol. 24, no. 6, pp. 490–502, 2016.
[6] N. S. Zhong, B. J. Zheng and Y. M. Li, “Epidemiology and cause of severe acute respiratory syndrome
(SARS) in Guangdong,” Lancet, vol. 362, pp. 1353–1358, 2003.
[7] G. Wong, W. Liu, Y. Liu, B. Zhou, Y. Bi et al., “SARS, and Ebola: The role of super-spreaders in
infectious disease,” Cell Host & Microbe, vol. 18, no. 4, pp. 398–401, 2015.
[8] N. Zhu, D. Zhang and W. Wang, “A Novel Coronavirus from Patients with Pneumonia in China,” The
new England journal of medicine, vol. 727, pp. 1–7, 2019.
[9] WHO, “Statement on the second meeting of the International Health Regulations, Emergency Commit-
tee regarding the outbreak of novel coronavirus (2019-nCoV),” 2005. https://www.who.int/news/item/.
[10] C. Rivers, J. P. Chretien, S. Riley, J. A. Pavlin, A. Woodward et al., “Using outbreak science to
strengthen the use of models during epidemics,” Nature Communication, vol. 10, no. 1, pp. 3102, 2019.
[11] K. Sun, J. Chen and C. Viboud, “Early epidemiological analysis of the coronavirus disease 2019
outbreak based on crowd sourced data: A population-level observational study,” Lancet Digital Health,
vol. 7500, no. 20, pp. 30026–30021, 2020.
[12] M. Natalie, T. Kobayashi Linton and Y. Yang, “Incubation period and other epidemiological charac-
teristics of 2019 novel coronavirus infections with right truncation: A statistical analysis of publicly
available case data,” Journal of Clinical Medicine, vol. 9, no. 2, pp. 538, 2020.
[13] C. Huang, Y. Wang, X. Li, L. Ren and J. Zhao et al., “Clinical features of patients infected with 2019
novel coronavirus in Wuhan,” Lancet, vol. 395, pp. 497–506, 2020.
[14] C. A. Donnelly, A. C. Ghani, G. M. Leung, A. J. Hedley, C. Farser et al., “Epidemiological determi-
nants of spread of causal agent of severe acute respiratory syndrome in Hong Kong,” Lancet, vol. 361,
no. 9371, pp. 1761–1766, 2003.
[15] World meter Caronavirus, https://www.worldometers.info/coronavirus/.
[16] L. Qun, X. Guan and P. Wu, “A novel coronavirus from patients with pneumonia in china,” 2019 The
New England Journal of Medicine, vol. 2001316, pp. 727–733, 2019.
[17] M. Naveed, D. Baleanu, M. Rafiq, A. Raza, A. H. Soori et al., “Dynamical behavior and sensitivity
analysis of a delayed coronavirus epidemic model,” Computers Materials & Continua, vol. 65, no. 1,
pp. 225–241, 2020.
[18] D. Baleanu, H. Mohammadi and S. Rezapour, “A fractional differential equation model for the
COVID-19 transmission by using the Caputo-Fabrizio derivative,” Advances in Difference Equations,
vol. 20, no. 1, pp. 299, 2020.CMC, 2021, vol.67, no.3 3227
[19] A. Raza, M. Farman, A. Akgül, M. S. Iqbal, A. Ahmad et al., “Simulation and numerical solution of
fractional order Ebola virus model with novel technique,” AIMS Bioengineering, vol. 7, no. 4, pp. 194–
207, 2020.
[20] A. Ahmed, B. Salam, M. Mohammad, A. Akgül and S. H. A. Khoshnaw, “Analysis coronavirus disease
(COVID-19) model using numerical approaches and logistic model,” AIMS Bioengineering, vol. 7, no. 3,
pp. 130–146, 2020.You can also read