Characteristics Evolution of Multiscale Structures in Deep Coal under Liquid Nitrogen Freeze-Thaw Cycles - Hindawi.com
←
→
Page content transcription
If your browser does not render page correctly, please read the page content below
Hindawi
Geofluids
Volume 2021, Article ID 8921533, 9 pages
https://doi.org/10.1155/2021/8921533

Research Article
Characteristics Evolution of Multiscale Structures in Deep
Coal under Liquid Nitrogen Freeze-Thaw Cycles

 Yingfeng Sun ,1,2 Yixin Zhao ,3,4 Yulin Li ,4 Nima Noraei Danesh ,4
 and Zetian Zhang 2
 1
 School of Civil and Resource Engineering, University of Science and Technology Beijing, Beijing 100083, China
 2
 Key Laboratory of Deep Earth Science and Engineering (Sichuan University), Ministry of Education, Chengdu 610065, China
 3
 Beijing Key Laboratory for Precise Mining of Intergrown Energy and Resources, China University of Mining and
 Technology (Beijing), Beijing 100083, China
 4
 School of Energy and Mining Engineering, China University of Mining and Technology (Beijing), Beijing 100083, China

 Correspondence should be addressed to Zetian Zhang; zhangzetian@scu.edu.cn

 Received 17 August 2021; Accepted 22 September 2021; Published 13 October 2021

 Academic Editor: Yong liu

 Copyright © 2021 Yingfeng Sun et al. This is an open access article distributed under the Creative Commons Attribution License,
 which permits unrestricted use, distribution, and reproduction in any medium, provided the original work is properly cited.

 Liquid nitrogen freeze-thaw fracturing has attracted more and more attention in improving the coal reservoir permeability. In
 order to reveal the impact of liquid nitrogen freeze-thaw on the multiscale structure of deep coal, the multiscale structure
 evolution law of deep and shallow coal samples from the same seam in the Qinshui coalfield during the liquid nitrogen freeze-
 thaw cycling was investigated using NMR T 2 spectrum, NMRI, and SEM. The connectivity between mesopores and
 macropores in deep and shallow coal is improved after liquid nitrogen freeze-thaw cycles. The influence of liquid nitrogen
 freeze-thaw cycles on the structure evolution of deep and shallow coal is the formation and expansion of microscopic fractures.
 The initial NMR porosity of deep coal is lower than that of shallow coal from the same coalfield and coal seam. The NMR
 porosity of both the deep and shallow coal samples increases with the increase of the number of freeze-thaw cycles, and the
 NMR porosity growth rate of the deep sample is lower than that of the shallow sample.

1. Introduction (NMR) and found that the development of macropores and
 fractures is superior to that of micropores [12]. Gao studied
Global reserves of deep coalbed methane (CBM) are approx- the influence of temperature and stress on the characteristics
imately 47:6 × 10¹² m3 [1], and the development of deep evolution of pore-fracture structures in deep coal reservoirs
CBM in the United States started early and has been gradu- in the Linxing block by NMR and found that the deforma-
ally commercialized [2–7]. Although China developed deep tion of fractures and mesopores is more significant than that
CBM production relatively late, it has achieved success in of micropores under the same stress and the negative effect
deep CBM development in recent years in the Cainan area of temperature on fractures and mesopores is greater than
of Junggar Basin [8–10], Yanchuannan on the eastern edge that of micropores [13]. Xu et al. analyzed the pore structure
of the Ordos Basin, Linfen block, and Zhengzhuang and of medium-high rank coal samples from depths of 100-
Shizhuang block of Qinshui Basin [11], indicating great 1800 m in Yichuan of Shaanxi Province and Shizhuang of
potential for the development of deep CBM production. Shanxi Province by mercury intrusion, low-temperature liq-
 The multiscale structure of coal is not only the main flow uid nitrogen adsorption, and NMR. Their results show an
channel of CBM but also the main factor influencing its increase in micropores and a decrease in mesopores and
development. Qin et al. investigated the pore-fracture char- macropores with depth [14]. Lu et al. analyzed the pore-
acteristics of deep coal with a depth of more than 1000 m fracture structure of coal samples from different depths of
in the Daning-Jixian area using nuclear magnetic resonance 14 coal mines in the south of Qinshui Basin and found that
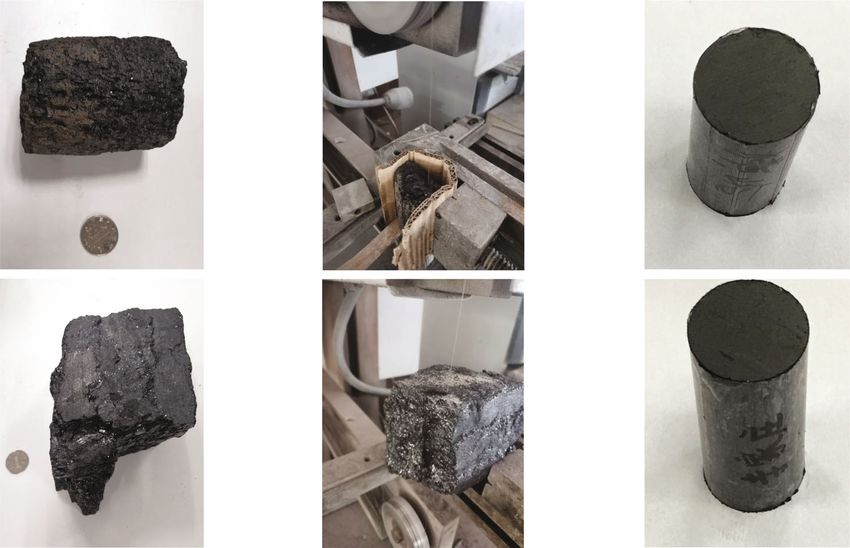
2 Geofluids

fracture density is not affected by depth and is distributed freeze-thaw conditions [30]. Zhai et al. found that freeze-
between 7 and 15 fractures/5 cm. Compared with shallow thaw cycles increase the proportion of mesopores and
coal samples, the average diameter of the pore-throat in deep macropores and reduce the proportion of micropores [31].
coal decreases, the volume of micropores increases slightly, Liquid nitrogen freeze-thaw cycling, a nonwater fractur-
and the volume of mesopores and macropores decreases ing technology, has many advantages over hydraulic fractur-
slightly; when the depth exceeds 1000 m, the porosity is gen- ing. In recent years, scholars have conducted a lot of
erally less than 6% [15, 16]. Zheng et al. studied the variation researches on the effect of liquid nitrogen freeze-thaw cycles
in porosity with depth in Qinshui Basin and found that the on the multiscale coal structure, mainly focusing on the
porosity of coal in the depth greater than 800 m is generally effects of the liquid nitrogen freeze-thaw cycle on shallow
less than 6.5% [17]. Liang et al. studied the pore structure coal. In view of this, using the NMR T 2 spectrum, NMRI,
characteristics of samples at different depths in the Huainan and SEM, this paper compares the evolution of multiscale
coalfield and found that porosity decreased with depth, and structures in deep and shallow coal after different numbers
the ratio of the macropore specific pore volume to the total of liquid nitrogen freeze-thaw cycles to reveal the multiscale
specific pore volume is decreasing, while that of micropores structure evolution law of deep and shallow coal in liquid
is increasing [18]. Zhang found there is a binomial relation- nitrogen freeze-thaw cycling.
ship between porosity and effective stress in deep coal reser-
voirs in the Yushe-Wuxiang block and Shizhuang south 2. Laboratory Experiments: Methodology
block [19]. and Procedures
 Due to the low permeability of CBM reservoirs, hydrau-
lic fracturing has become a common method to improve 2.1. Samples. The two samples used in the experiments were
coal seam permeability. However, the solid particles in the collected from Qinshui coalfield. The HL sample was col-
fracturing fluid may block the flow channel, and the adsorp- lected from coal seam no. 15 in the Hengling block, and
tion of the fracturing fluid on the coal surface and the water- the SJZ sample was collected from coal seam no. 15 in the
swelling minerals in the coal seam leads to expansion of the Sijiazhuang coal mine, with sampling depths of 1436 and
coal matrix during the fracturing, thus reducing the perme- 420 meters, respectively. The sample was prepared by wire-
ability of the seam [20]. In addition, hydraulic fracturing electrode cutting, as shown in Figure 1. The sample used in
consumes large amounts of water, pollutes groundwater, the liquid nitrogen freeze-thaw experiment is cylindrical,
and induces earthquakes [21]. In view of these factors, with a diameter of 25 mm and a length of 50 mm.
exploration of new coal seam fracturing technology is
urgent. Liquid nitrogen fracturing has attracted increasing 2.2. Multiscale Structure Evolution Experiment of Deep
attention in recent years [22, 23]. The vaporization and Coal under Liquid Nitrogen Freeze-Thaw Cycles
expansion of liquid nitrogen injected into the coal seam, 2.2.1. Principles of NMR. This paper mainly uses nuclear
the solidification and expansion of water in the coal seam magnetic resonance imaging (NMRI) and NMR relaxation
caused by low temperature, and the thermal stress caused spectrum. The basic principle of NMRI is to apply the radio
by low temperature will damage and destroy the coal body, frequency pulse, layer selection gradient field, phase encod-
and then, the permeability of the coal seam is improved ing gradient field, and frequency encoding gradient field to
[24]. Qin systematically studied the effect of liquid nitrogen the test sample; then, the signal source in three dimensions
freeze-thaw on the coal pore-fracture structure. He sug- is located through slice selection, phase encoding, and fre-
gested that more freeze-thaw cycles are better than a longer quency encoding. The signal is then collected and decoded
freezing time in improving coal seam permeability [24], and (Fourier transform). Finally, NMRI is achieved according
it is the difference in the initial porosity that causes the dif- to the relationship between the signal intensity and image
ferent increments of permeability under liquid nitrogen gray value (pixels with larger signals are more bright, while
freeze-thaw conditions [25]. Sun et al. found that the impact those with smaller signals are less bright) [32, 33]. The
of freeze-thaw on rocks pores and fractures is sandstone > li- NMRI flowchart is shown in Figure 2 [34].
mestone > granite, which is also related to their initial poros- The quantitative relationship between transverse relaxa-
ities [26]. Using nitrogen adsorption and mercury injection, tion time T 2 and pore radius r is mainly used to analyze the
Qin et al. found that the cumulative seepage pore volume multiscale structure of coal in the NMR relaxation spectrum
and total pore volume have an exponential relationship with analysis [35, 36],
freezing time, and cumulative pore volume has a quadratic
relationship with freeze-thaw cycles [27]. Using NMR and
SEM, Qin et al. observed that when the freezing time r = ρF s T 2 , ð1Þ
increased from 1 minute to 1 hour, the maximum fracture
width increases from 5.56 μm to 100 μm [28]. Yan analyzed where r is the pore radius, ρ is the surface transverse relaxa-
the pore structure of coal samples with different water con- tion rate (m/s), and F s is the shape factor; F s = 1, 2, 3 for the
tent before and after liquid nitrogen freeze-thaw cycling pore shape of the slit, columnar, and spherical, respec-
using nitrogen adsorption and found that the variation in tively [37].
pore structure increases with increasing water content [29]. As shown in Equation (1), the larger the multiscale
Sun et al. found that the pores and fractures become more structure is, the longer the corresponding transverse relaxa-
developed when the freezing temperature decreases under tion time T 2 is.
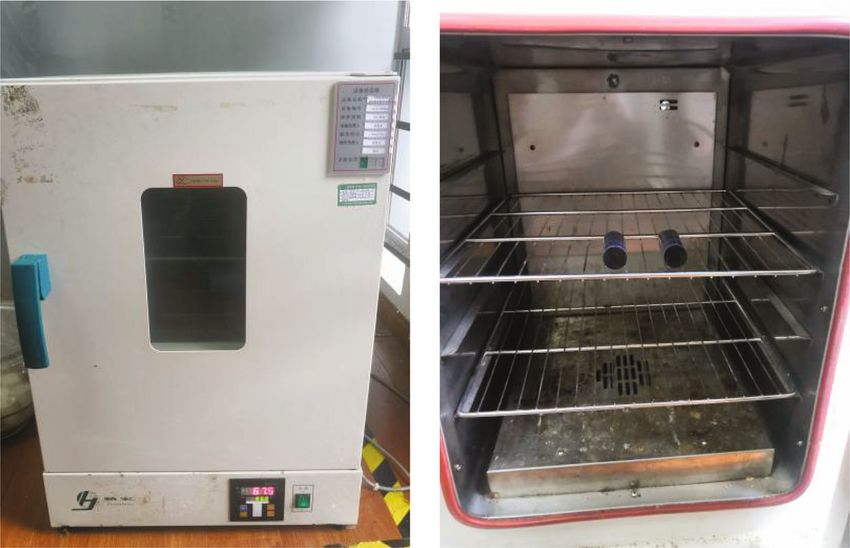
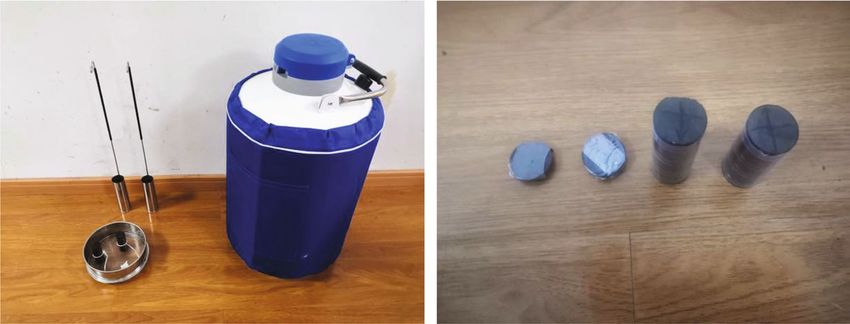
Geofluids 3

 HL

 SJZ

 Figure 1: Coal sample wire-electrode cutting.

 Slice Phase Frequency Signal 2D FT processing Layer image display
 selection encoding encoding acquisition

 Figure 2: Flowchart of nuclear magnetic resonance imaging.

 Figure 3: Drying oven for coal samples.

2.2.2. Experimental Procedures. The coal samples were dried tion, and then, the sample was dried (60°C for 24 hours).
at 60°C for 24 hours before liquid nitrogen freeze-thaw Next, the liquid nitrogen freeze-thaw cycles and related tests
cycling. The drying oven is shown in Figure 3. The T 2 spec- were carried out, using liquid nitrogen to freeze the sample
trum of the dried samples was used as the base signal. The for 1 hour. Figure 5 shows the liquid nitrogen freeze-thaw
SEM, porosity, and permeability tests were carried out device and frozen samples. Then, the samples were melted
before the freeze-thaw cycling. Then, vacuum-water satura- at room temperature for 1 hour, and vacuum-water satura-
tion treatment was performed (12 hours). The vacuum- tion treatment was carried out (12 hours) after every two liq-
water saturation device is shown in Figure 4. The T 2 spec- uid nitrogen freeze-thaw cycles. The T 2 spectrum test was
trum and NMRI tests were conducted under water satura- performed under water saturation, and then, the samples
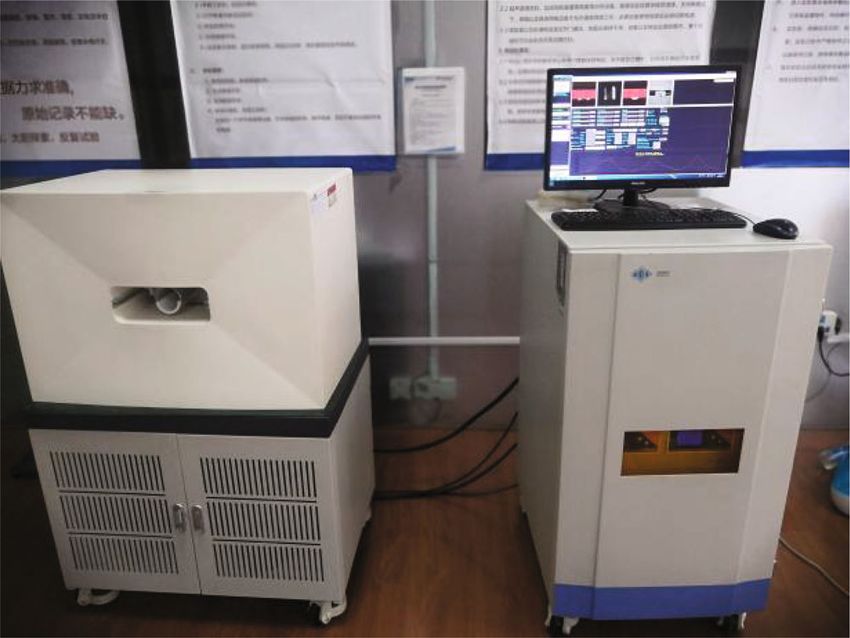
4 Geofluids

 Figure 4: Vacuum-water saturation device.

 Figure 5: Liquid nitrogen freeze-thaw device and frozen samples.

were dried at 60°C for 24 hours and the porosity and perme- freeze-thaw cycles [31]. Qin et al. also observed the expan-
ability tests were conducted. Finally, after 10 liquid nitrogen sion of fractures in coal by SEM after freeze-thaw cycles [28].
freeze-thaw cycles, NMRI and SEM imaging of the samples
were implemented. 3.2. NMRI Comparison before and after Liquid Nitrogen
 Freeze-Thaw Cycles. In order to visually display the micro-
3. Results and Discussion structure evolution of the deep and shallow coal before and
 after the freeze-thaw cycle, NMRI was carried out on the
3.1. SEM Comparison before and after Freeze-Thaw Cycles. HL (deep) and SJZ (shallow) samples before and after 10 liq-
The deep and shallow coal samples were imaged before uid nitrogen freeze-thaw cycles. The MesoMR23-60H
and after the freeze-thaw cycles using an EVO scanning elec- medium-size NMRI analyzer developed by the Suzhou Niu-
tron microscope customized from Zeiss, to investigate the mag Analysis Instrument Corporation was used in this
effect of freeze-thaw cycles on coal microstructure, as shown paper, as shown in Figure 7. In NMRI, the center frequency
in Figure 6. is 21.240 MHz, the echo time is 5.885 ms, the repetition time
 As can be seen in Figure 6, the expansion of fractures can is 500 ms, the slice thickness is 25 mm, the stacking times is
be observed in the deep coal sample (HL), and the formation 16, the frequency code is 256, and the phase code is 192.
of new fractures can be observed in the shallow sample The NMRI results are shown in Figure 8. The bright
(SJZ), after the liquid nitrogen freeze-thaw cycles. Therefore, spots represent the development of the pore structure in
the influence of the freeze-thaw cycles on the microstructure the NMRI images. The brighter and larger spots reflect the
evolution of deep and shallow coal mainly manifests the for- more developed pore structure [38]. Comparing the NMRI
mation of new fractures and the expansion of original frac- images of deep and shallow samples before and after the
tures, which verifies the improved connectivity between freeze-thaw cycle, it can be found that the pore structure of
mesopores and macropores and the fracture (macropores the shallow sample before cycling is better developed than
in NMR tests) development found in subsequent NMR tests that of the deep samples, and the variation in pore structure
after the liquid nitrogen freeze-thaw cycles. Zhai et al. of the shallow sample is also more significant than that of
observed the formation of new fractures in coal by SEM after the deep coal after liquid nitrogen freeze-thaw cycles, which
Geofluids 5

 HL HL

 F-T
 100 m 100 m

 SJZ F-T SJZ

 200 m 200 m

 Figure 6: SEM images before and after freeze-thaw cycle.

 interval was 3000 ms, the RF delay was 0.08 ms, the analog
 gain was 20, the digital gain was 3, the count of cumulative
 samples was 16, the preamplifier gain was 0, the number of
 echoes was 10000, and the echo time was 0.20 ms.
 Figure 10 shows three peaks in the T 2 spectrum during
 liquid nitrogen freeze-thaw cycles for the HL and SJZ sam-
 ples. Based on the relationship between pore size and relax-
 ation time (Equation (1)), with the increase of relaxation
 time, the three peaks in the T 2 spectrum represent micro-
 pores, mesopores, and macropores, from left to right, respec-
 tively. From the evolution law of the T 2 spectrum in the
 process of liquid nitrogen freeze-thaw cycles, it can be found
 that with the increase of the number of freeze-thaw cycles,
 the peak areas corresponding to micropores, mesopores,
 and macropores increase. Namely, with the increase of the
 number of liquid nitrogen freeze-thaw cycles, the volumes
 Figure 7: MesoMR23-60H medium-size NMRI analyzer. of micropores, mesopores, and macropores increase, which
 can be verified by Figure 9 (variation law of porosity over
 freeze-thaw cycles). Also, the valleys between the peaks cor-
can be seen from the initial porosity of the deep and shallow responding to mesopores and macropores gradually become
samples before the freeze-thaw cycle and the variation pat- less visible with more freeze-thaw cycles, which indicates
terns of porosity during the freeze-thaw cycles (Figure 9). that the connectivity between mesopores and macropores
 is gradually enhanced [38].
3.3. Evolution Law of Multiscale Coal Structure during In order to investigate the individual evolution of micro-
Liquid Nitrogen Freeze-Thaw Cycles. Considering that the pores, mesopores, and macropores, the proportion of the
NMR T 2 spectrum comprehensively can reflect the multi- peak areas corresponding to micropores, mesopores, and
scale micropore, mesopore, and macropore structure charac- macropores in the total area of the three peaks after different
teristics, the NNM T 2 spectra of the deep (HL) and shallow cycle numbers is calculated over the process of liquid nitro-
(SJZ) samples were tested before freeze-thaw and after the gen freeze-thaw cycles, as shown in Figure 11.
2nd, 4th, 6th, 8th, and 10th cycles. The MesoMR23-60H It can be observed from Figure 11 that the proportion of
medium-size NMRI analyzer developed by Suzhou Niumag micropores in the total pore volume decreases with the
Analysis Instrument Corporation was also used in the increase of freeze-thaw cycles, and the proportion of meso-
NMR T 2 spectrum test. In the test, the main value of the pores and macropores in the total pore volume increases.
RF signal frequency was 23 MHz, the RF signal frequency Compared to macropores, mesopores increase more obvi-
offset was 401587.9 Hz, the RF 90° pulse width was ously. Zhai et al. investigated the coal pore structure evolu-
10.00 μs, and the RF 180° pulse width was 19.52 μs; the signal tion under freeze-thaw cycles by NMR; they also observed
frequency range and the sampling frequency received by the that the proportion of micropores decreased and the propor-
receiver during sampling were 250 kHz, the sampling repeat tion of mesopores and macropores increased [31].
6 Geofluids

 (a) NMRI of HL sample before F-T (b) NMRI of HL sample after F-T

 (c) NMRI of SJZ sample before F-T (d) NMRI of SJZ sample after F-T

 Figure 8: Comparison of NMRI before and after freeze-thaw cycle.

 6.0 6.0

 5.5 5.5
 NMR porosity (%)
 NMR porosity (%)

 5.0 5.0

 4.5 4.5

 4.0 4.0
 0 2 4 6 8 10 0 2 4 6 8 10
 Freeze-thaw cycle Freeze-thaw cycle

 HL HL HL-fitting
 HL-fitting
 SJZ-fitting SJZ SJZ-fitting
 SJZ
 (a) (b)

 Figure 9: Evolution of the porosity measured by NMR during liquid nitrogen freeze-thaw cycle.

 There is a linear relationship between NMR signal inten- tion exists between the porosity of both samples and the
sity and water mass in pore structure [39]. In view of this, number of freeze-thaw cycles, and the growth rate of the
this paper investigates the linear relationship between deep coal sample is less than that of the shallow coal sample
NMR signal intensity and water mass in the pore structure (Figure 9(a)). Qin et al. found that the coal with larger initial
of the coal sample, as shown in Figure 12. porosity has a larger porosity growth rate during freeze-thaw
 After obtaining the relationship between NMR signal cycling [34]. In this study, the initial porosity in shallow coal
intensity and water mass, the mass of water in the coal sam- is larger than that in deep coal, which can explain the growth
ple pore structure can be obtained by NMR signal intensity, rate of shallow coal being larger than that of deep coal. Sun
from which the volume of the pore structure in the sample et al. and Qin et al. found that there is a quadratic function
can be further obtained. Finally, the evolution law of NMR relation between the porosity and the number of freeze-
porosity with the number of freeze-thaw cycles was thaw cycles in shallow coal and shallow rock, respectively
obtained, as shown in Figure 9. [25, 26]. Therefore, in this study, the relationship between
 Figure 9 indicates that the porosity of the deep (4.00%) the porosity and the number of freeze-thaw cycles was also
sample before liquid nitrogen freeze-thaw cycling is less than fitted by the quadratic function (Figure 9(b)). It can be found
that of the shallow (4.14%) sample. A linear positive correla- that the quadratic function is better than the linear function
Geofluids 7

 200 200
 HL SJZ
 NMR signal intensity 160 160

 NMR signal intensity
 120 120 15
 15
 10
 80 10 80
 5
 5
 0
 40 0 40 100 200 300 400
 100 200 300 400

 0 0
 0.001 0.01 0.1 1 10 100 1000 10000 0.001 0.01 0.1 1 10 100 1000 10000
 Relaxation time (ms) Relaxation time (ms)
 F-T cycle 10 F-T cycle 4
 F-T cycle 8 F-T cycle 2
 F-T cycle 6 F-T cycle 0

 Figure 10: Evolution of NMR T 2 spectrum during liquid nitrogen freeze-thaw cycle.

 100 Proportion in total pore 100
 Proportion in total pore

 80 HL 80 SJZ
 volume (%)
 volume (%)

 60 60

 40 40

 20 20

 0 0
 0 2 4 6 8 10 0 2 4 6 8 10
 Freeze-thaw cycle Freeze-thaw cycle

 Micropores
 Mesopores
 Macropores

 Figure 11: Evolution of pore structure at different scales during liquid nitrogen freeze-thaw cycles.

 10000 while the coefficient of quadratic term is negative in deep
 coal, which indicates that the effect of increasing the
 8000 freeze-thaw number on improving the structure is more sig-
 NMR signal intensity

 nificant in shallow coal than in deep coal. The difference
 6000 between deep and shallow coals in response to freeze-thaw
 cycles may be also caused by the difference of rock mechan-
 4000 ical properties. Li and Li found that the compressive
 strength, shear strength, and cohesion of rock increase with
 2000 the increase of depth [40].
 y = 139.018 + 3000.655x, R2 = 0.99993
 0 4. Conclusions
 0.0 0.5 1.0 1.5 2.0 2.5 3.0
 Water mass (g) The multiscale structure evolution law of deep and shallow
 coal samples from the same seam in the Qinshui coalfield
Figure 12: Relationship between NMR signal intensity and water during the liquid nitrogen freeze-thaw cycles was investi-
mass. gated using the NMR T 2 spectrum, NMRI, and SEM. The
 following conclusions can be drawn:

in fitting the relation between the porosity and the number (1) The initial NMR porosity of deep coal is lower than
of freeze-thaw cycles in both deep and shallow coals. The that of shallow coal from the same coalfield and coal
coefficient of the quadratic term is positive in shallow coal, seam
8 Geofluids

 (2) The connectivity between mesopores and macro- ference, Society of Petroleum Engineers, Calgary, Alberta, Can-
 pores in deep and shallow coal is both improved ada, 2010.
 after liquid nitrogen freeze-thaw cycles, and the con- [4] D. D. Rice, “Composition and origins of coalbed gas,” AAPG
 nectivity is gradually enhanced over freeze-thaw Studies in Geology, vol. 38, pp. 159–184, 1993.
 cycles [5] R. C. Johnson and R. M. Flores, “Developmental geology of
 coalbed methane from shallow to deep in Rocky Mountain
 (3) The influence of the liquid nitrogen freeze-thaw basins and in Cook Inlet-Matanuska basin, Alaska, U.S.A.
 cycle on the structure evolution of deep and shallow and Canada,” International Journal of Coal Geology, vol. 35,
 coal is mainly the formation and expansion of no. 1-4, pp. 241–282, 1998.
 microscopic fractures [6] R. R. Tonnsen and J. L. Miskimin, “A conventional look at an
 (4) During the liquid nitrogen freeze-thaw cycles, the unconventional reservoir: coalbed methane production poten-
 volumes of micropores, mesopores, and macropores tial in deep environments,” in Proceedings of AAPG Annual
 Convention and Exhibition, New Orleans, Louisiana, 2010.
 in deep and shallow coal increase. The proportion of
 micropores in the total pore structure volume [7] C. R. Nelson, “Deep coalbed gas plays in the U.S. rocky moun-
 decreases, and the proportion of mesopores and tain region,” in Proceedings of AAPG Annual Meeting, Salt
 Lake City, Utah, 2003.
 macropores in the total pore structure volume
 increases. Compared to macropores, the increase of [8] C. B. Che, Report on the New Round of National Oil and Gas
 Resource and Coalbed Methane Resource Evaluation Results,
 the proportion of the mesopore volume in the total
 Beijing, 2006.
 pore volume is more significant
 [9] C. H. Liu, J. Zhu, C. B. Che, H. L. Yang, and M. Z. Fan, “Meth-
 (5) The NMR porosity of both deep and shallow coal odologies and results of the latest assessment of coalbed meth-
 samples increases with the number of freeze-thaw ane resources in China,” Natural Gas Industry, vol. 29, no. 11,
 cycles, and the NMR porosity growth rate of the pp. 130–132, 2009.
 deep sample is lower than that of the shallow sample [10] Y. T. Wang and W. F. Lan, “Origin of hydrocarbons and its
 exploration in Cainan oilfield,” Xinjiang Petroleum Geology,
 vol. 15, no. 1, pp. 30–36, 1994.
Data Availability [11] S. H. Cui, H. L. Liu, B. Wang, N. Ning, and S. X. Sang, “Trap-
The experimental data used to support the findings of this ping characteristics of coalbed methane in low-rank coal of
study are included within the article. Zhungaer basin,” Geoscience, vol. 21, no. 4, pp. 719–724, 2007.
 [12] H. L. Qin, H. F. Yao, X. B. Jia, P. F. Li, and Y. J. Meng, “Pore
 and fissure characteristics of deep coal reservoir based on
Conflicts of Interest NMR,” Coal Technology, vol. 38, no. 8, pp. 55–89, 2019.
 [13] X. D. Gao, Study on porosity and permeability evolution mech-
The authors declare that they have no conflicts of interest.
 anism and fracturing reconstruction feasibility of deep coal res-
 ervoirs in Linxing area, China university of Mining and
Acknowledgments Technology-Beijing, 2019.
 [14] Q. L. Xu, W. H. Huang, S. H. Tang et al., “Pore structure and
The research is financially sponsored by the National Natu- adsorption of deep medium-high rank coal reservoirs,” Geosci-
ral Science Foundation of China (Grant Nos. 52004293, ence, vol. 30, no. 2, pp. 413–419, 2016.
U1910206, 51861145403, and 51874312); the Open Project [15] X. X. Lu, The reservoir characteristics of deep coal sean in
Program of Key Laboratory of Deep Earth Science and Engi- Southern Qinshui basin, China university of Geosciences-Bei-
neering (Sichuan University), Ministry of Education (No. jing, 2013.
DESE 202004); the Fundamental Research Funds for the [16] X. X. L. W. H. Huang, Y. P. Chen, S. R. Zhang, J. Wu, and Y. Y.
Central Universities (No. FRF-TP-20-034A1); the China Xu, “Pore structure of deep coal seam in southern Qinshui
Postdoctoral Science Foundation (No. 2018M641526); and basin,” Journal of Northeast Petroleum University, vol. 39,
the Yue Qi Distinguished Scholar Project of the China Uni- no. 3, pp. 41–49, 2015.
versity of Mining & Technology (Beijing). [17] G. Q. Zheng, D. F. Yang, and X. L. Zhou, “Comparative study
 on reservoir properties of deep and shallow coal seams in Qin-
 shui basin,” Coal Technology, vol. 37, no. 3, pp. 108–110, 2018.
References
 [18] H. X. Liang, P. Chen, L. H. Tong, and C. H. Lu, “Pore charac-
 [1] S. Li, D. Z. Tang, H. Xu, and S. Tao, “Progress in geological teristics of deep part coal and significance in Huainan coal-
 researches on the deep coalbed methane reservoirs,” Earth Sci- field,” Coal Geology of China, vol. 22, no. 6, pp. 5–8, 2010.
 ence Frontiers, vol. 23, no. 3, pp. 10–16, 2016. [19] M. Zhang, The variation law of deep coal measure gas reservoirs
 [2] L. J. Zhao and Y. Qin, “Current status on deep coalbed meth- physical properties with the increase of temperature and pres-
 ane in China,” China Coalbed Methane, vol. 7, no. 2, pp. 38– sure, China university of Mining and Technology, 2019.
 40, 2010. [20] X. Y. Wen, X. Y. Yi, Y. Lu, B. S. Guan, L. Liang, and P. Liu,
 [3] R. R. Tonnsen and J. L. Miskimins, “Simulation of deep “Evalution and primary exploration of damage experiment of
 coalbed methane permeability and production assuming vari- coal rock permeability caused by different fracture fluid,” Pet-
 able pore volume compressibility,” Proceedings of Canadian rochemical Industry Application, vol. 30, no. 3, pp. 12–15,
 Unconventional Resources and International Petroleum Con- 2011.
Geofluids 9

[21] K. Zhu, “Impact of shale gas hydraulic fracturing development [36] S. Li, D. Tang, Z. Pan, H. Xu, and W. Huang, “Characterization
 on environment,” China Petroleum and Chemical Standard of the stress sensitivity of pores for different rank coals by
 and Quality, vol. 36, no. 22, pp. 57–78, 2016. nuclear magnetic resonance,” Fuel, vol. 111, pp. 746–754,
[22] C. Z. Cai, F. Gao, G. S. Li, Z. W. Huang, and P. Hou, “Evalua- 2013.
 tion of coal damage and cracking characteristics due to liquid [37] W. Looyestijin and J. Hofman, “Wettability-index determina-
 nitrogen cooling on the basis of the energy evolution laws,” tion by nuclear magnetic resonance,” SPE Reservoir Evaluation
 Journal of Natural Gas Science and Engineering, vol. 29, and Engineering, vol. 9, no. 2, pp. 146–153, 2006.
 pp. 30–36, 2016. [38] S. Li, M. K. Luo, C. J. Fan, H. J. Bi, and Y. P. Ren, “Quantitative
[23] C. Zhai, L. Qin, S. M. Liu, J. Z. Xu, Z. Q. Tang, and S. L. Wu, characterization of the effect of acidification in coals by NMR
 “Pore structure in coal: pore evolution after cryogenic freezing and low-temperature nitrogen adsorption,” Journal of China
 with cyclic liquid nitrogen injection and its implication on Coal Society, vol. 42, no. 7, pp. 1748–1756, 2017.
 coalbed methane extraction,” Energy & Fuels, vol. 30, no. 7, [39] Y. X. Zhao, Y. F. Sun, S. M. Liu, K. Wang, and Y. D. Jiang,
 pp. 6009–6020, 2016. “Pore structure characterization of coal by NMR cryoporome-
[24] L. Qin, Pore evolution after fracturing with cyclic liquid nitro- try,” Fuel, vol. 190, pp. 359–369, 2017.
 gen and the mechanism of permeability enhancing, China uni- [40] J. R. Li and H. B. Li, “Experimental study on mechanical prop-
 versity of Mining and Technology, 2018. erties of rocks with different depths,” Chinese Journal of Rock
[25] L. Qin, C. Zhai, S. M. Liu, J. Z. Xu, G. Q. Yu, and Y. Sun, Mechanics and Engineering, vol. 21, no. S1, pp. 948–951, 2001.
 “Changes in the petrophysical properties of coal subjected to
 liquid nitrogen freeze-thaw - a nuclear magnetic resonance
 investigation,” Fuel, vol. 194, pp. 102–114, 2017.
[26] Y. Sun, C. Zhai, J. Z. Xu, Y. Z. Cong, L. Qin, and C. Zhao,
 “Characterisation and evolution of the full size range of pores
 and fractures in rocks under freeze-thaw conditions using
 nuclear magnetic resonance and three-dimensional X-ray
 microscopy,” Engineering Geology, vol. 271, 2020.
[27] L. Qin, S. G. Li, Z. Cheng et al., “Changes in the pore structure
 of lignite after repeated cycles of liquid nitrogen freezing as
 determined by nitrogen adsorption and mercury intrusion,”
 Fuel, vol. 267, pp. 117214–117214, 2020.
[28] L. Qin, C. Zhai, J. Z. Xu, S. M. Liu, C. Zhong, and G. Q. Yu,
 “Evolution of the pore structure in coal subjected to freeze
 −thaw using liquid nitrogen to enhance coalbed methane
 extraction,” Journal of Petroleum Science and Engineering, vo,
 vol. 175, pp. 129–139, 2019.
[29] D. C. Yan, Experimental study on the effects of liquid nitrogen
 freezing and thawing damage in coal with different water con-
 tent, China university of Mining and Technology, 2019.
[30] Y. Sun, C. Zhai, L. Qin, J. Z. Xu, and G. Q. Yu, “Coal pore char-
 acteristics at different freezing temperatures under conditions
 of freezing–thawing cycles,” Environmental Earth Sciences,
 vol. 77, p. 525, 2018.
[31] C. Zhai, S. L. Wu, S. M. Liu, L. Qin, and J. Z. Xu, “Experimental
 study on coal pore structure deterioration under freeze–thaw
 cycles,” Environmental Earth Sciences, vol. 76, no. 15, p. 507,
 2017.
[32] P. C. Lauterbur, “Image formation by induced local interac-
 tions: examples employing nuclear magnetic resonance,”
 Nature, vol. 242, no. 5394, pp. 190-191, 1973.
[33] M. R. Mitchell, R. W. Tarr, T. E. Conturo, C. L. Partain, and
 A. E. James, “Spin echo technique selection: basic principles
 for choosing MRI pulse sequence timing intervals,” Radio-
 graphics, vol. 6, no. 2, pp. 245–260, 1986.
[34] Suzhou Niumag Analytical Istrument Corporation, “Nuclear
 magnetic resonance imaging MRI-introduction to the princi-
 ple of nuclear magnetic resonance imaging,” https://www
 .niumag.com/he-ci-gong-zhen-cheng-xiang-mri-he-ci-gong-
 zhen-cheng-xiang.html, 2016.
[35] W. Kenyon, “Nuclear magnetic resonance as a petrophysical
 measurement,” Nuclear Geophysics, vol. 6, no. 2, pp. 153–
 171, 1992.
You can also read