COVID-19 transmission across Washington State
←
→
Page content transcription
If your browser does not render page correctly, please read the page content below
COVID-19 transmission across
 Washington State

 Washington State Department of Health
 October 20, 2021

To request this document in another format, call 1-800-525-0127. Deaf or hard of hearing
customers, please call 711 (Washington Relay) or email civil.rights@doh.wa.gov.

Publication Number 820-114

For inquiries about this report from media, contact the Public Information Desk:
doh‐pio@doh. wa.gov

 0
SitRep 40: COVID-19 transmission across Washington State
Gitanjali Singh1, Ian Painter1, Juan M. Lavista Ferres2, Ruth Etzioni3, Barbra A. Richardson3,4, Cathy Wasserman1
1
 Washington State Department of Health; 2Microsoft AI For Health; 3Fred Hutch Cancer Center; 4University of Washington
Results as of October 19, 2021.
 The current Situation Report is based on complete data through October 8. The most recent 10 days
 are considered incomplete as it takes several days for the Washington State Department of Health to
 receive 90% of reported cases, hospitalizations and deaths. We continue to work on decreasing these
 time frames. Note that both statewide and county-specific trends since October 8 may have changed.
 To assess changes, you can review the most up to date picture of case, hospital admission, and death
 trends including incomplete data on the Epidemiology Curves tab of the WADoH COVID-19 data
 dashboard. Incomplete data will continue to populate in the coming days, so flattening or decreasing
 trends may or may not persist. Increasing trends in the incomplete data, though, will likely only grow.

Summary of current situation
Overview: Current model results based on data through October 8 indicate that COVID-19 transmission
in Washington state is decreasing, with R-effective slightly below 1 from late August through October 2.
Prevalence of COVID-19 has been declining since early September, but levels are still high.
Cases: Since the last report, case counts have steadily declined, though they still remain high, at levels
similar to those observed in November of 2020.
Hospital admissions: Hospital admissions and occupancy also began to decline over the past month.
Both admissions and occupancy still remain at high levels similar to the peak levels experienced in the
surge of November 2020-January 2021.
Variants: The delta variant continues to account for almost 100% of cases sequenced.
Outlook: Hospitals across the state are operating at full capacity, and projections while less dire than last
month continue to suggest that high levels of occupancy are likely to persist through the fall.
Public health action: Vaccination continues to be the most effective strategy to reduce COVID-19
transmission and reduce the risk of severe disease. Wear a mask in public indoor settings and crowded
outdoor settings, regardless of vaccination status, and avoid crowded situations. Vaccinate against
influenza to prepare for flu season. In tandem, these actions will help prevent further burden on the
healthcare system.

 1
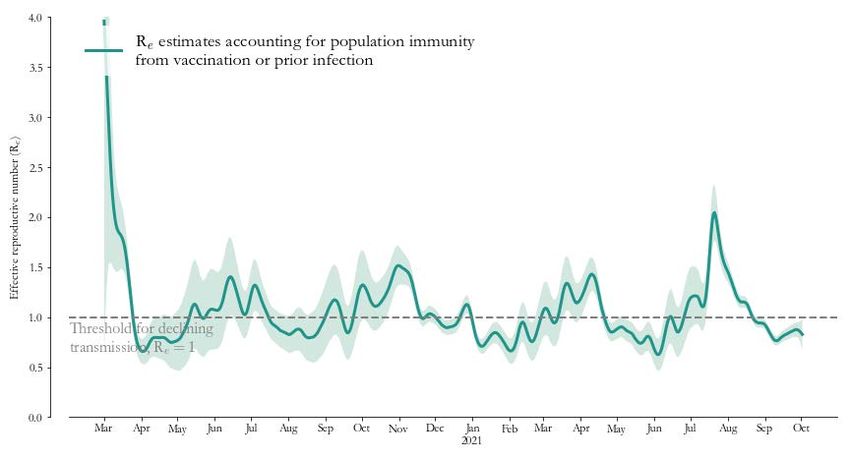
Statewide estimates of the effective reproductive number
Using data from the Washington Disease Reporting System (WDRS) through October 8, we are reporting
the effective reproductive number (Re) as of October 2. The green line and green-shaded region shows
estimates of total Re which accounts for contributions from behavior, variants, and population immunity,
either from prior infection or due to vaccination. On October 2, Rewas likely between 0.67 and 0.98,
with a best estimate of 0.83. Re increased sharply in early July, reflecting rapidly increasing transmission
across the state due to the delta variant. The drop in Re starting the end of July could reflect increases in
preventive behaviors, such as masking, as people became more aware of the delta surge. Re has
remained slightly below 1 since late August. To reduce levels of cases and hospitalizations, total Re
needs to maintain a value substantially below 1 for a sustained period of time. Achieving this will require
a combination of a high level of vaccination and widespread adoption of behaviors that reduce exposure
and transmission including wearing masks in public indoor settings and crowded outdoor settings, or
avoiding crowded settings altogether, regardless of vaccination status.

Figure 1: estimates for Washington state. The green line and green-shaded region depict the “total”
 , which accounts for behavior, variants, and population immunity.

 2
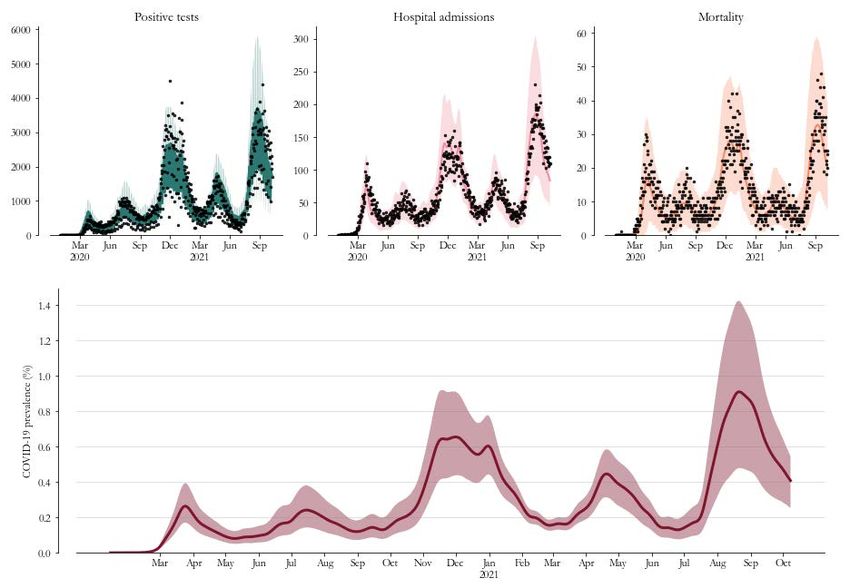
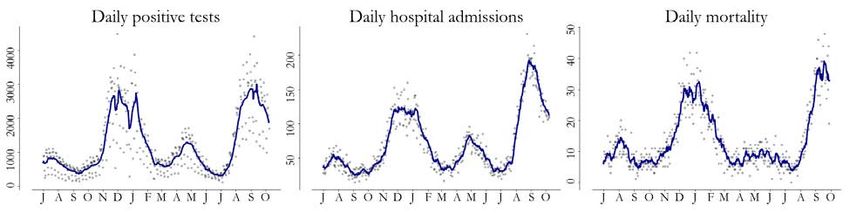
Model-based statewide prevalence
On October 8 , overall prevalence (the percentage of Washington state residents with active COVID-19
infection) in Washington state was likely between 0.25% and 0.54%, with a best estimate of 0.41%
(Figure 2). This translates to 1 in 244 WA residents currently estimated to have an active COVID-19
infection (symptomatic and asymptomatic). Prevalence increased sharply through July, exceeding levels
during the third wave of infection that lasted from November 2020-January 2021. Since early
September, prevalence has steadily declined, and as of October 8 has decreased by about 50% since our
last report in September. Despite these declines, prevalence still remains high, similar to levels observed
at the peak of the spring 2021 surge.

Figure 2: Model-based prevalence estimates (bottom, 95% CI shaded) and model fit to cases (top left),
hospitalizations (top middle) and deaths (top right) for Washington state. Prevalence is the percentage of
Washington state residents with active COVID-19 infection.

 3

Model-based statewide immunity
On October 8, we estimate that overall population immunity to SARS-CoV-2 in Washington state was
between 61.5% and 65.7% with a best estimate of 63.5% (Figure 3). Immunity derived from prior
infection was around 20.3% (95% uncertainty interval: 18.8% to 21.9%), and additional immunity derived
from vaccination was around 43.2% (95% uncertainty interval: 41.7% to 44.6%). Overall immunity has
increased more rapidly since August, reflecting both increases in immunity from prior infection due to
the delta surge, as well as increases in vaccination.

Figure 3: Model-based estimates of population-level immunity to SARS-CoV-2 infection as of October 8.
Overall population immunity is indicated in the blue line and shaded area. The percent of the population
deriving immunity from prior infection, is shown in orange. Individuals who acquire immunity from both
infection and vaccination are counted in the immunity from prior infection estimate. The additional
percent of the population deriving immunity only from vaccination at least 14 days prior is shown in
purple. Note that these estimates assume that either prior infection or vaccination give individuals
long-term immunity against all SARS-CoV-2 variants, so waning of immunity after infection is not
accounted for.

 4
Trends in cases, hospital admissions, and deaths
Case counts have declined since early September. The seven-day rolling average case count declined
from a peak of 2937 on January 8 to 745 cases per day as of February 15, remained at that level for a
month, increased to 1518 cases per day as of April 23 and declined to 376 as of July 3 and increased to
the most recent peak of 3552 as of September 13 and declined to 2224 as of October 8. (Figure 4)

Hospital admissions also began to decline in early September. The seven-day rolling average of hospital
admissions declined from a peak of 117 on January 6 to 31 as of March 6, flattened near that level until
late March, increased to a peak of 84 as of April 27, declined to a low of 30 as of June 16, and flattened
at around 30 through July 8. Admissions increased to 195 as of Aug 29, and have since declined
substantially to 115 as of October 8, but remain high.

Deaths have shown some variability at high levels since early September. The seven-day rolling average
of deaths declined from a peak of 32 on January 10 to 5 as of March 23, and varied at between 5 and 10
deaths per day through early August, after which a sharp increase began, reaching 36 as of September 7.
There was a slight decline in mid-September, to 32 as of September 14, and then an increase again to 38
as of September 21, and a decline to 33 as of September 28 (note that there is an earlier cut-off date for
deaths because of the additional time it takes for deaths to be verified and entered in the state vital
records database).

Figure 4: Seven-day rolling case counts (left panel), hospital admissions (middle panel) and deaths (right
panel) for Washington from July 2020 through October 8 (cases and hospitalizations) and September 28
(deaths) 2021. Because of how confirmed deaths are being reported, we are using an earlier cutoff for
data on daily mortality.

County-level trends
Case counts (Figure 5a): County-level case counts as of October 8:
● Case counts are declining in all of the five largest counties (Clark, King, Pierce, Snohomish, Spokane),
 though counts are still high, similar to November 2020 levels.
● All middle-sized counties are seeing declining case counts (Benton, Cowlitz, Franklin, Kitsap, Skagit,
 Thurston, Whatcom, Yakima), except for Grant county where cases are flattening.
● Counts are declining or flattening in many small counties (Douglas, Grays Harbor, Island, Kittitas, Lewis,
 Okanogan, Stevens, Walla Walla, Whitman, Clallam, Adams, Asotin, and Lincoln). Case counts are
 increasing in Chelan and Klickitat. All other small counties have fewer than 10 cases per day.
Case rates (Figure 5b): Figure 5b shows the decrease in county-specific case rates across the state for the
two-week period ending on October 8 compared to the two-week period ending on September 8. For
the period ending on September 8, 32 counties had rates above 500 per 100,000. In comparison, for the
two-week period ending October 8, 17 counties had rates above 500 per 100,000.

 5
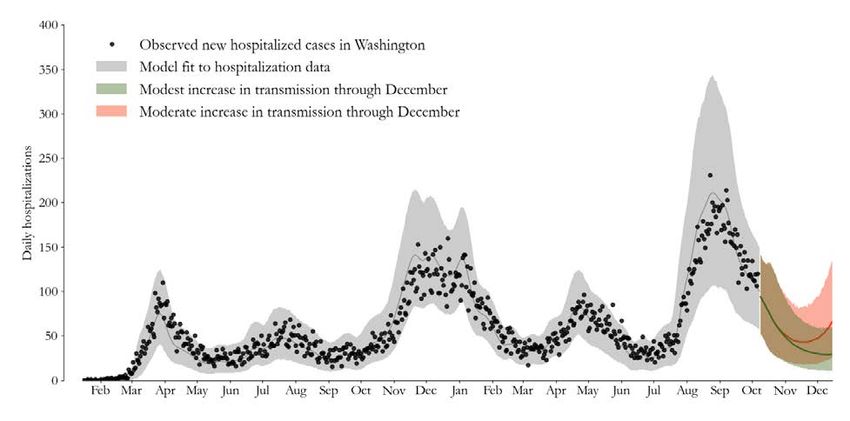
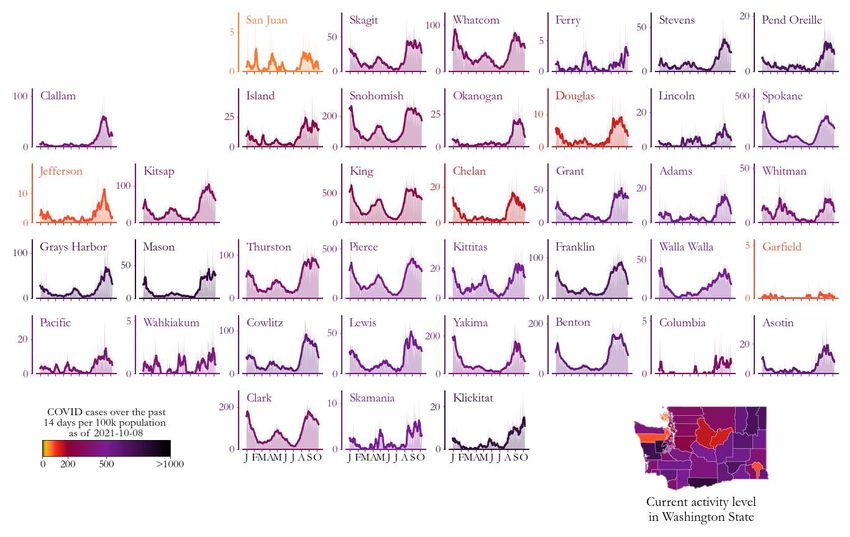
Figure 5a: Daily COVID-19 positives (shaded areas) and 7-day moving averages (curves) arranged geographically and colored by COVID-19
activity level (total cases from September 25 to October 8 per 100,000 people). Case trends across counties highlight geographic correlations and
help us better understand region-level estimates of the transmission rate (see Figure 1).

 6
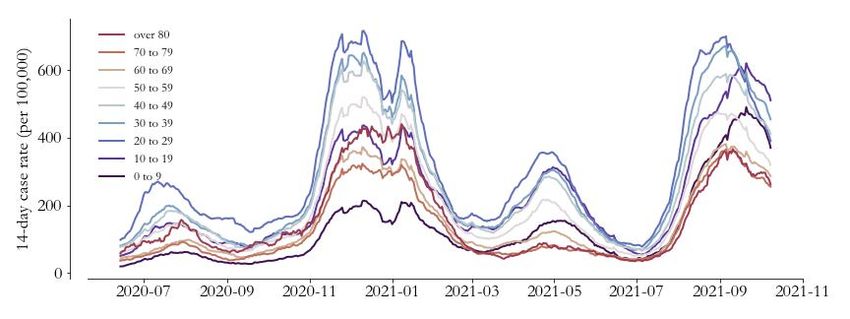
Figure 5b: 14-day COVID-19 case rates (cases per 100,000 people) by county over two time periods, the two-week period ending on September 8
(left), and the two-week period ending on October 8 (right).

 7
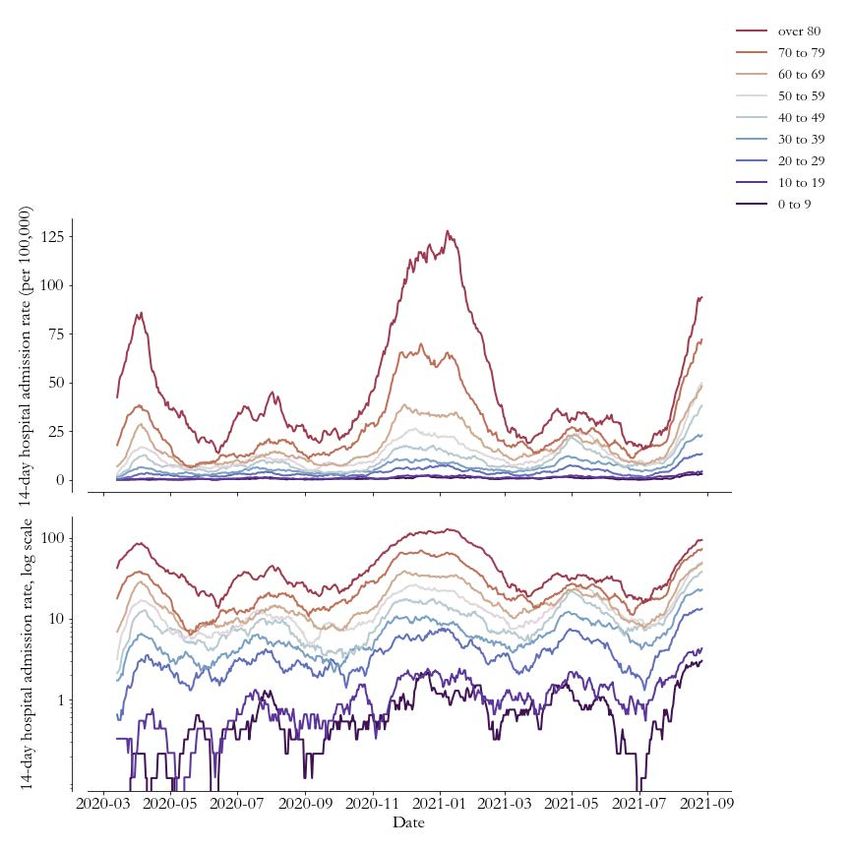
Trends in case rates by age group
Across Washington state, 14-day case rates (cases per 14-day period per 100,000 people) increased
sharply in all age groups from early July through mid-August, when they began to decline (Figure 6). As
of October 8, case rates in all age groups continue to decline, although the decline began noticeably
later among children and adolescents aged 0-9 and 10-19 (shown separately in the lower panel for
clarity) than it did for most adult age groups. This may be related to increased testing of children and
adolescents as schools reopened this fall, as this pattern is not observed in hospital admissions in the
0-19 age group (Figure 7, next page). While case rates among adults at the peak of the delta surge were
similar to those at the peak of the winter 2020 surge, case rates among children were about 1.5 times
higher at the peak of the delta surge than at the peak of the winter 2020 surge.

Figure 6. 14-day case rates by 10-year age group across Washington state, as of October 8, 2021. The
upper panel shows rates by 10-year age group for all ages 0-80+. The bottom panel shows the rates
separately for the 0-19 population.

 8
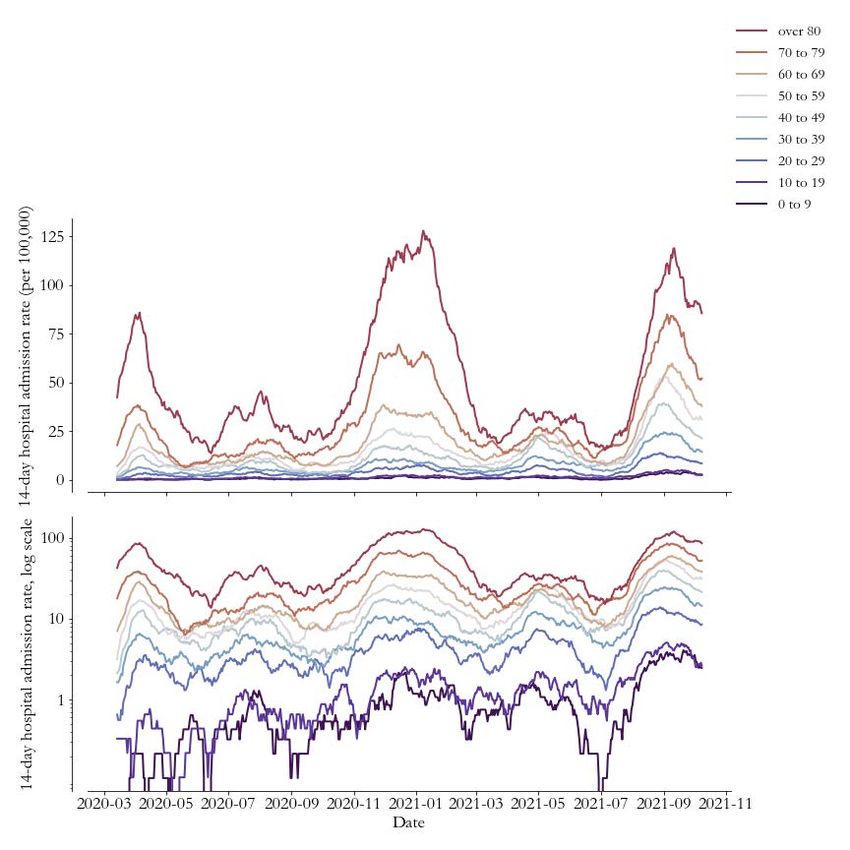
Trends in hospital admission rates by age group
Hospital admission rates (first hospital admissions per 14-day period per 100,000 population) across
Washington state increased from July through early September, when they began to decline in most age
groups. As of October 8, admission rates are declining in most adult age groups, with some flattening in
the 30-39 and 50-59 age groups (Figure 7). Admission rates for ages 0-19 remain low.

The hospital admission data shown here are from WDRS and incorporate information from both case
investigation/contact tracing, as well as syndromic surveillance, and represent the most reliable source
of data on first hospital admissions for COVID-19, although data are less timely than the WA Health
system. Data as of October 16 (not shown) from hospital reports to the WA Health system show declines
in hospital admissions in most adult age groups, except for ages 80+, among whom rates are plateauing.

Vaccination continues to protect many Washington residents from serious illness. Hospital admission
rates remain at least 9 times higher among the unvaccinated than among the fully vaccinated across age
groups (for further details see the full DOH report on cases, hospitalizations, and deaths by vaccination
status).

Figure 7. Statewide 14-day hospital admission rate per 100,000 population by 10-year age group as of
September 8. The top panel shows the rates on a standard numeric scale, and the bottom panel shows
the rates on a log scale to be able to better compare the rate of decline between age groups that have
large differences in rates.

 9
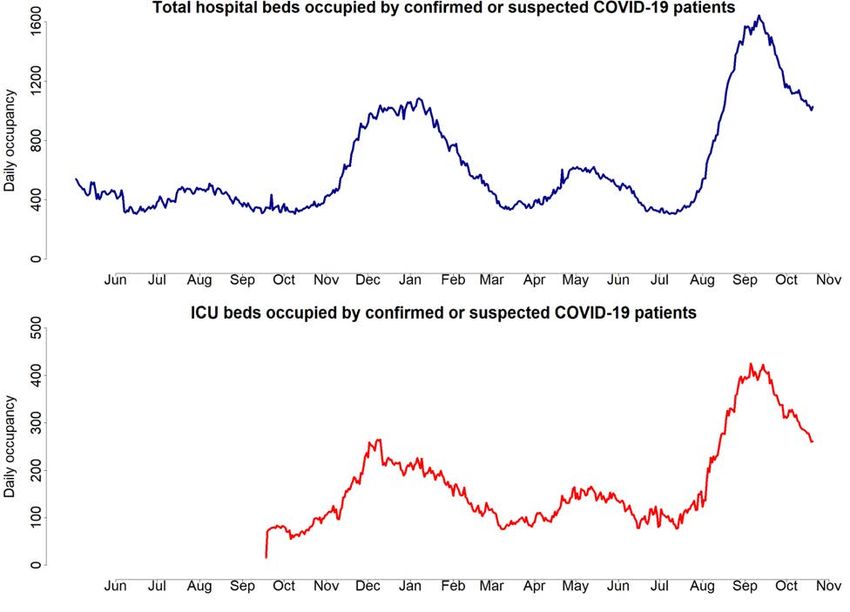
Hospital occupancy
Across the state, the number of total hospital beds (Figure 8, top panel) and ICU beds (Figure 8, bottom
panel) occupied by confirmed or suspected COVID-19 patients increased sharply starting in mid-July and
peaked in mid-September. Declines have continued through October 16, but current occupancy levels
still remain high, similar to those observed at the peak of the third wave of infection in November
2020-January 2021. Although hospital occupancy related to COVID-19 has declined from nearly 25% of
bed capacity in early September to around 17% in early October, total hospital occupancy has remained
constant at over 90% (Figure 9). Hospitals remain at very high occupancy despite declines in COVID-19
related occupancy. This is due to increases in people seeking health care and elective procedures
deferred at the peak of the delta surge, as well as staffing shortages.

Figure 8. Total hospital beds and ICU beds occupied by confirmed or suspected COVID-19 patients
reported through the WA Health system. Data collection for ICU beds occupied by COVID-19 patients
started September 17, 2020. Hospital occupancy data has minimal reporting lag, and is shown here using
data up to October 16, 2021. Both confirmed and suspected cases are included, rather than just
confirmed cases, since this best reflects total resources being used. Note that bed occupancy will increase
faster than admissions since patients being treated for COVID-19 generally stay in the hospital for several
days.

 10
Figure 9. 7-day average of percent of acute care staffed hospital beds occupied by all patients (maroon
line), and percent of acute care staffed hospital beds occupied by COVID-19 patients (pink line) based on
data from the WA Health system, using data through October 14. Accessed from the Healthcare System
Readiness tab of the DOH COVID-19 dashboard.

 11
Hospital admission projections
We have projected hospital admissions and occupancy through the end of December under two
scenarios. The first scenario assumes transmission drops slightly over the next two weeks from
the current estimate of Re of 0.83, followed by a modest increase in transmission through the
end of December. This increase is similar to the increase that occurred from March to April
during the spring wave. The second scenario assumes a moderate increase in transmission
through December, increasing at twice the rate of the first scenario. While vaccination provides
much more protection this fall and winter compared to last year, exposure to COVID-19 and
disease transmission continues to be influenced by our behavior. Potential increases in
transmission could result from the combined effects of relaxations in NPI behavior, increased
travel and holiday gatherings, increasing time spent indoors with people outside one’s
household, other seasonal related effects and school related transmission.
Under the modest increase scenario, we project that hospital admissions will continue to
decrease through December, with the rate of decrease leveling off by the end of December at
between 10 and 60 admissions per day (Figure 10), a level that is slightly lower than the low
points seen after prior waves. Under the moderate increase scenario, the decrease in
admissions levels out in mid-November, followed by increases through the end of December,
reaching between 50 and 210 admissions per day at the end of December. Considerable
uncertainty is inherent in both scenarios, and we have little data to estimate whether increases
in transmission are more likely to be modest or moderate. Still, they provide insight into
potential future burdens on the health system.

Figure 10. Projections of hospital admissions based on two transmission scenarios, a scenario with
modest increases in transmission (green line and shaded area), and a scenario with a moderate increase
in transmission (red line and shaded area).

 12
Hospital occupancy projections
We used the hospital admission projections described above to project hospital beds occupied under the
two scenarios. The modest increase in transmission scenario projects a slow decrease in beds occupied
by COVID patients through the end of December, reaching between 400 and 790 beds occupied per day.
The moderate increase in transmission scenario results in a slow decrease in occupancy through early
November, followed by increases through the end of the year, reaching between 530 and 1375 beds
occupied per day (Figure 11). Although the number of beds occupied by COVID patients is projected to
fall in both scenarios through November, overall capacity will remain tight due to a build up of delayed
care and continued staffing shortages. Seasonal increases in hospital admissions related to other
respiratory viruses including influenza will likely further increase occupancy.

Modest increase scenario

Moderate increase scenario

Figure 11. Projections of hospital occupancy based on two transmission scenarios, one based on a
modest increase in transmission (upper panel), and the other based on a moderate increase in
transmission (lower panel).

 13
Fraction of cases attributable to variants of concern
Using genetic sequence data from DOH as well as collaborating institutions on the GISAID platform, we
have estimated the fraction of cases in WA that are attributable to SARS-CoV-2 variants of concern and
variants of interest. Extrapolating from data available through September 29, and using a multinomial
generalized additive model, we estimate that as of October 18, nearly 100% of cases are due to the delta
variant (B.1.617.2 and AY.1-33 sublineages) (Figure 12). There is some uncertainty in these projected
estimates due to the use of a method that only approximates a representative sample. Despite
uncertainty in these estimates, they provide an informative picture of the evolution of SARS-CoV-2
variant strains in Washington state. A full report of whole genome sequencing of SARS-CoV-2 lineages
circulating in Washington state is produced weekly by DOH.

Figure 12. Estimated fraction of cases attributable to variants of concern and variants of interest in
Washington State. Data used in this analysis exclude sequences obtained by targeting B.1.1.7/alpha. This
figure shows a seven-day running average through September 29 (darker colors) and then a multinomial
growth model nowcast through October 18 (lighter colors). For the figure, variants of interest B.1.427
and B.1.429/epsilon have been combined as they are closely related. To assist with public discussions of
variants, WHO proposed using labels consisting of the Greek alphabet, i.e. alpha, beta, gamma, as a
practical way to discuss variants by non-scientific audiences.

 14
Implications for public health practice
Across Washington state, SARS-CoV-2 transmission increased exponentially over July corresponding to
increasing predominance of the delta variant. Subsequently, Re declined through August, likely due to
increases in protective population behaviors such as masking. Re has remained slightly below one since
late August. Prevalence increased sharply through mid-August and has been declining since, though
levels still remain high--similar to those observed at the peak of the spring 2021 surge. Cases and
hospital admissions have declined steadily since September, though they still remain high, at levels
similar to the peak of the November 2020-January 2021 surge. Deaths remain high as of the end of
September. Declines in both total and ICU beds occupied by confirmed or suspected COVID-19 patients
began in mid-September, but occupancy levels remain extremely high, and many hospitals across the
state are operating at or near full capacity.

The B.1.617.2 and AY.(1-33) delta variant lineages have remained the predominant Variant of Concern
(VOC) in Washington state, with close to 100% of cases attributable to this variant since mid-August.
Although hospital admission rates are declining, rates remain at least 9 times higher among the
unvaccinated in comparison to the fully vaccinated. Vaccines continue to afford strong protection against
severe disease, reducing strain on an already stretched health care system.

The near-term outlook suggests that trends are moving in the right direction, although cases, hospital
admissions, and deaths remain high. Medium term projections depend on whether increasing
transmission or increasing population immunity has more impact. At current levels of transmission, the
effects of increasing population immunity due to the surge in delta cases and the slowly increasing
vaccination rates are projected to reduce cases and hospitalizations over the next month.
Increased transmission through December due to holiday gatherings, seasonal changes increasing indoor
activity and NPI fatigue may increase transmission levels sufficiently to offset the current level of
population immunity. The estimated 36% of the population susceptible to infection will likely be hit
hardest by any increases in transmission. Both scenario projections suggest that this may result in a long
plateau of high levels of hospital admissions similar to what was seen November 2020 through January
2021. High levels of hospital occupancy are likely to persist through the fall, compounded by flu season
and the substantial numbers of people who were forced to delay care at the peak of the delta surge.

Many hospitals across the state continue to function at extremely high occupancy, near capacity, due to
continued high volumes of COVID-19 cases and staffing shortages. Currently 17% of hospital beds are
occupied by COVID-19 patients. During the peak of the delta surge this was as high as 25% - one of every
four beds available. High numbers of hospitalized COVID-19 patients impacts the number of beds
available to treat patients for other conditions, including cancer treatment. It also strains health care
providers in Washington State, both in increased workload and emotional burden of caring for patients
who have to delay care because the beds that are needed may not be available.

Increased population vaccine uptake is critical to reducing transmission, but the impacts on health care
services will not be seen immediately. However, the use of NPIs, particularly masking in public indoor
settings and crowded outdoor settings, regardless of vaccination status can immediately reduce
transmission and burden on health care. Avoiding crowded events such as sporting events, concerts, and
fairs, as well as large parties and celebrations is also an important means of reducing transmission.
Additionally, promoting vaccination against influenza is critical given the likelihood flu may be more
 15
common this year. In tandem, these measures can help to prevent further pressure on the healthcare
system across the state. Given the likelihood that high levels of occupancy will persist through the fall,
any measures that can be taken to reduce transmission from now through the end of the year are
warranted.

Key inputs, assumptions, and limitations of the IDM modeling approach
We use a COVID-specific transmission model fit to testing and mortality data to estimate the effective
reproductive number over time. The key modeling assumption is that individuals can be grouped into
one of four disease states: susceptible, exposed (latent) but non-infectious, infectious, and recovered.

 ● For an in-depth description of our approach to estimating and its assumptions and
 limitations, see the most recent technical report on the modeling methods. The estimates this
 week and going forward use the updated method in that report, which results in some
 statistically-insignificant retrospective changes to relative to our previous report.
 ● In this situation report, we use data provided by Washington State Department of Health
 through the Washington Disease Reporting System (WDRS). We use the WDRS test, hospital
 admission, and death data compiled on October 18, and to hedge against delays in reporting,
 we analyze data as recent as October 8 across the state for cases and hospital admissions, and
 as recent as September 28 for deaths. This relatively conservative hedge against lags is in
 response to reports of increasing test delays.
 ● Estimates of describe average transmission rates across large regions, and our current work
 does not separate case clusters associated with known super-spreading events from diffuse
 community transmission.
 ● Results in this report come from data on testing, confirmed COVID-19 cases, and deaths (see
 previous WA State report for more details). Also as described previously, estimates of are
 based on an adjusted epi curve that accounts for changing test availability, test-positivity rates,
 and weekend effects, but all biases may not be accounted for.
 ● This report describes patterns of COVID transmission across Washington state, but it does not
 examine factors that may cause differences to occur. The relationships between specific causal
 factors and policies are topics of ongoing research and are not addressed herein.
 ● Our modelling framework has been updated to take vaccination data into account. Detailed
 methodological documentation is currently being prepared by the Institute for Disease
 Modeling. At a high level, based on observational data, our approach assumes that on average
 58.0% (95% CI: 52% to 64%) of those vaccinated after the first dose and an additional 24.4%
 after the second dose (for a total of 82.4% [95% CI: 77% to 87%) are protected from SARS-CoV-2
 infection 14 days after each dose. Among vaccinated people not protected from SARS-CoV-2
 infection, our modelling framework assumes roughly 20% to be protected from experiencing
 severe COVID-19 symptoms (i.e. hospitalization or death) while still able to transmit the virus.
 One critical limitation to note is the use of the same assumptions for all vaccines. Therefore, for
 this report, the single-shot Johnson & Johnson vaccine was considered equivalent to first-doses
 of the Pfizer or Moderna vaccines. This limitation is not expected to have a large influence on
 results since the Johnson and Johnson vaccines currently constitute a small proportion (less than
 4%) of the total vaccine doses administered to-date in Washington state.

 16
Collaboration notes
The Institute for Disease Modeling (IDM), Microsoft AI For Health, the University of Washington, and the
Fred Hutchinson Cancer Research Center are working with WA DoH to provide support for regional
modeling of case, testing, and mortality data across Washington State to infer effective reproduction
numbers, prevalence, and incidence from data in the Washington Disease Reporting System. Modeling
and analysis for the report are led by WA DoH and are based on models developed by IDM and advanced
by Microsoft to better represent the state. The WA DoH wishes to thank IDM for their support in model
development and implementation for this report, in particular, Dr. Niket Thakkar, PhD, and Dr. Mike
Famulare, PhD, of IDM, who developed and shared software and programming scripts and provided
technical and scientific advice to the WA DoH. This collaboration has evolved alongside the science, data
systems, and analysis behind the models, and it reflects the ongoing commitment of all parties involved
to improve our understanding of COVID-19 transmission and to support WA DoH in its public health
mission. This collaboration and its outputs will continue to evolve as scientific frontiers and policy needs
change over time.
These reports were previously published on the IDM InfoHub. Going forward, as of December, 9, 2020,
new reports will be published on the DOH website. IDM will continue to provide technical assistance for
the reports, as part of this collaboration.

 17
You can also read


