Housing Affordability in New York State - Office of ...
←
→
Page content transcription
If your browser does not render page correctly, please read the page content below
Housing Affordability in
   New York State

                           June 2019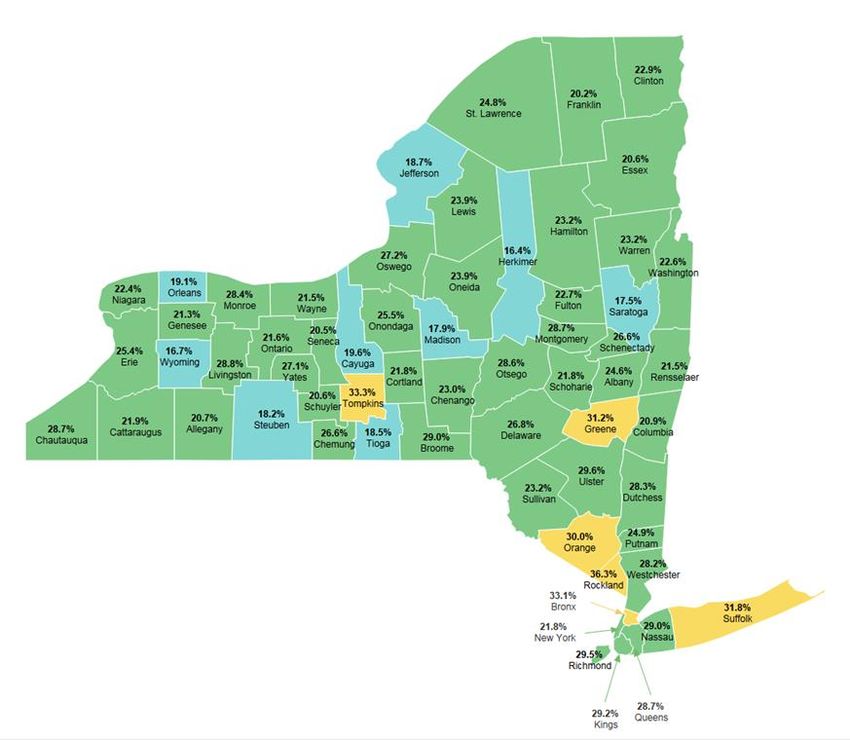
Message from the Comptroller
June 2019

After almost a full decade of U.S. economic expansion, too many
New Yorkers still face real challenges making ends meet. One clear
sign of this troubling reality is the millions of renters and
homeowners in our State who struggle with high housing costs.

As of 2017, nearly 2.8 million New York households faced housing
costs that were 30 percent or more of their income, meaning they
were above a commonly accepted benchmark for housing
affordability. Almost half of all renters and more than one in four
homeowners were in this category, according to U.S. Census
Bureau data.

Based on criteria used by the U.S. Department of Housing and Urban Development, more than
1.3 million households – including more than one of every four renters – were “severely
burdened” by housing costs of half or more of their income.

High housing costs may force families and individuals to scrimp on other necessities or go
without them altogether. Many find it impossible to put aside savings for emergency needs,
college or retirement; some may face eviction or conclude their only choice is to move to lower-
cost locations. Such outcomes have broader, harmful implications for New York’s economy.

The housing affordability challenge results from a combination of factors. Statewide, median
rental costs rose by nearly 13 percent, after adjusting for inflation, over the decade ending in
2017. That compared to a 2.5 percent increase in median household income for renters.
Although the picture improved for homeowners over the period, nearly 1.1 million paid costs
above the 30 percent affordability benchmark in 2017.

While rental and homeowner costs are generally higher in downstate regions, the challenge of
affordability extends throughout New York State, as incomes elsewhere tend to be lower. As
the details in this report make clear, housing affordability can be elusive for New Yorkers in
urban, suburban and rural settings alike. As State policy makers continue to address the
challenges of assuring affordable housing, the data and analysis in this report can help to
inform choices that lead to a better quality of life for all New Yorkers.

Thomas P. DiNapoli
State Comptroller
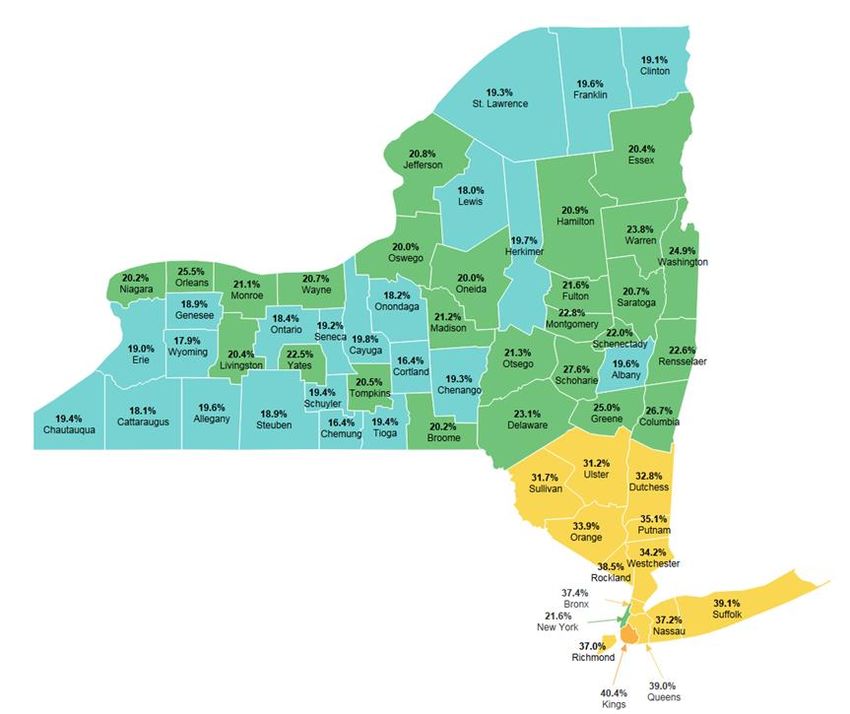
Table of Contents

I. EXECUTIVE SUMMARY ....................................................................................................... 1
II. HOUSING AFFORDABILITY IN NEW YORK ...................................................................... 3
          Trends in Affordability ................................................................................................................ 4
          County-Level Measures of Housing Affordability .................................................................... 7
          Factors That Affect Housing Affordability .............................................................................. 11
III. CONCLUSION .................................................................................................................. 15
IV. APPENDICES................................................................................................................... 16
          Appendix A: Housing Cost Burden Percentages by County ................................................ 16
          Appendix B: Housing Costs and Household Income by County.......................................... 18
          Appendix C: Percentages of Rental and Owner Households by County, 2013-2017 ......... 20
          Appendix D: Numbers of Rental and Owner Households by County, 2013-2017 ............... 21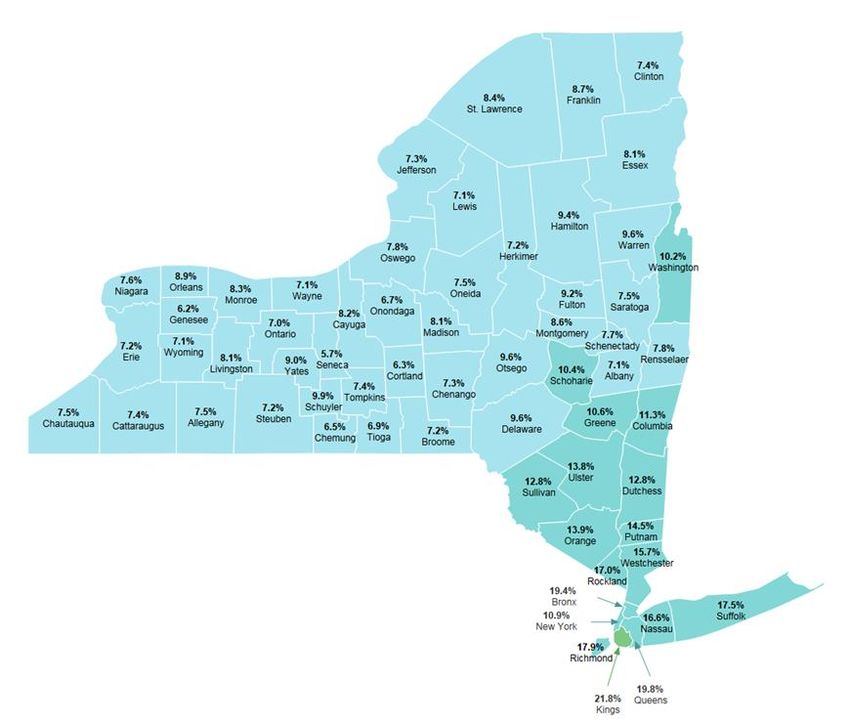
I. Executive Summary
Housing is generally considered affordable when it consumes less than 30 percent of
household income. However, for many New Yorkers housing affordability is elusive, as their
monthly costs exceed this threshold – often by significant amounts. In 2017, housing costs for
nearly 2.8 million of New York’s 7.3 million households, including almost half of all rental
households and more than one in four homeowners, exceeded the affordability threshold,
according to U.S. Census Bureau data. Within this group, nearly 1.4 million households were
considered severely burdened by housing costs that consumed half or more of their income.

The percentages of New Yorkers with housing costs exceeding these affordability benchmarks
were among the nation’s highest in 2017, and the State’s rankings have worsened compared
to 2008. For example, in 2017 New York ranked third among the states in the proportions of
both renter and owner households devoting half or more of their income to housing. In 2008,
those rankings were fifth and sixth highest, respectively.

The decade examined in this report includes what is now one of the longest periods of
economic expansion in U.S. history. Changes over the period brought some good news
regarding affordability for New York homeowners. In that group, the percentage of homeowners
with monthly housing costs above the affordability level fell from 34.5 percent in 2008 to 27.5
percent in 2017. Still, the latter figure represented nearly 1.1 million households, one indication
of the continuing challenge of achieving affordable housing.

For renters, the trend has been more troubling. Despite broadly favorable economic trends –
especially in New York City – the number and the percentage of renters statewide who pay 30
percent or more of income for housing costs both rose when compared to the beginning of the
decade. So, too, did the number and share of renters who were severely burdened with costs
representing at least half of household income.

Further, the proportion of New Yorkers living in rental housing rose from 2008 to 2017, so that
the negative trend for renters reflected a growing impact. Statewide, the number of rental
households increased by 5.7 percent from 2008 to 2017. Over the 10-year period, more than
one in four renters consistently paid gross rents consuming at least half of their household
income. Nearly 900,000 renters spent 50 percent or more of their income on housing in 2017.

Housing affordability measures are driven by the relative levels of household income and
household costs. In constant (inflation-adjusted) dollars, median household incomes in New
York State rose from 2008 to 2017 by 2.1 percent for homeowners and 2.5 percent for renters,
respectively.

The negative affordability trend for renters described above and the accompanying
improvement in affordability for homeowners result in part from differing trends in housing costs
over the period. Median monthly housing costs increased for rental households by 12.7
percent. For homeowners, such costs decreased by 10.2 percent in inflation-adjusted terms,
according to Census data. Incomes and housing costs vary regionally throughout New York
                                                1
State, with both generally being higher in the downstate metropolitan region than throughout
most of the upstate region. In counties across the State, however, significant numbers of
homeowners and renters encounter difficulty in paying their housing costs. Although
affordability concerns may be driven more by high costs for some New Yorkers, and by low
incomes for others, the balance of those factors can produce tough challenges in either case.
Not surprisingly, especially high proportions of lower-income households struggle with
burdensome housing costs.

Counties all across the State are faced with the issue of housing affordability. Rockland, Bronx,
Greene, Suffolk and Tompkins counties experienced the highest proportions of New York rental
households facing housing costs representing at least 30 percent of income during the 2013-
2017 period; other counties in this category included Nassau and Queens. (For statewide
analysis, this report uses Census data for individual years; county-level presentations reflect
five-year Census data, unless otherwise noted.)

While discussions of affordable housing often focus on families and individuals who rent, many
homeowners continue to struggle to fit their housing costs into limited household budgets. For
the 2013-2017 period, the downstate region was home to all of the 10 counties with the highest
proportions of homeowners paying 30 percent or more and 50 percent or more of income for
housing. Kings County had the highest proportions of homeowners with housing costs above
the thresholds for affordability and severely housing cost-burdened, at 40.4 percent and 21.8
percent, respectively.

As detailed in this report, many New Yorkers are feeling pressure in trying to meet increasing
housing costs with incomes that are not keeping pace. A combination of factors - - including
higher rental costs, a rising real estate tax burden and lack of sustained economic growth in
some areas - - contributes to the increasing challenge New Yorkers face in finding affordable
housing.

The lack of affordable housing for many New Yorkers, which is driven by economic trends, also
impacts the State’s economy in turn. Employers may find it difficult to attract and retain well-
qualified workers if those individuals are unable to afford the homes they would like. Housing
affordability also affects the amount of income that households have available for other non-
discretionary and discretionary spending, as well as for investments in savings or businesses.
As significant numbers of households face housing costs above the affordability threshold, the
consequences may include reduced potential for economic growth as well as troubling impacts
on New Yorkers’ quality of life.

                                               2
II. Housing Affordability in New York
Access to a secure, stable place to live is a basic human need. For many New Yorkers, the
share of household income required to secure access to this basic need is a matter of critical
concern.1 This report evaluates New York State trends in housing affordability from 2008 to
2017, the most recent year for which Census data are available.2

New York’s 7.3 million occupied housing units (households) in 2017 included both owner-
occupied (53.8 percent) and renter-occupied (46.2 percent) units. Within the owner-occupied
sector, an estimated 61 percent of all households had a mortgage.

Housing affordability is a serious concern for many households within each of these categories.
Housing is generally considered affordable when it consumes less than 30 percent of
household income.3 Households are considered severely cost burdened when such costs are
50 percent or more of income.4

Almost half of renter households in the State paid gross rent (rent or housing costs as it refers
to renters) exceeding the affordability threshold, and more than one in four renter households
were considered severely cost burdened in 2017, as shown in Figure 1. 5 Although the
percentage of owner-occupied units that exceeded these benchmarks was lower, almost 1.1
million New York homeowners had housing costs above the affordability threshold.

Figure 1

                               Occupied Housing Units in New York State, 2017

                                                                      Total          Renter           Owner
                Occupied Units                                      7,304,332       3,374,299       3,930,033
                Number Above Affordability Threshold                2,760,054       1,677,867       1,082,187
                Percentage Above Affordability Threshold               37.8%           49.7%            27.5%
                Number with Severe Cost Burden                      1,386,225         898,008         488,217
                Percentage with Severe Cost Burden                     19.0%           26.6%            12.4%
                Sources: U.S. Census Bureau

1 Household income is calculated as the total of annual incomes of all residents of a household above the age of 15. For more
information: https://www2.census.gov/programs-surveys/acs/tech_docs/subject_definitions/2017_ACSSubjectDefinitions.pdf.
2 Statewide figures are drawn from the U.S. Census Bureau, American Community Survey (ACS) 1-year estimates. In addition,

the report uses ACS 5-year estimates from 2013-2017 to evaluate affordability for individual counties. The data can be found
here: https://factfinder.census.gov/faces/nav/jsf/pages/guided_search.xhtml. ACS 1-year estimates are data that have been
collected over a 12-month period and are available for geographic areas with at least 65,000 people. The Census Bureau also
combines 5 consecutive years of ACS data to produce estimates, including for those geographic areas with fewer than 65,000
residents.      For       more     information      about     single-year          and      multiple-year       estimates,     see:
www.census.gov/content/dam/Census/library/publications/2018/acs/acs_general_handbook_2018.pdf.
3 See U.S. Department of Housing and Urban Development, “Defining Housing Affordability,” available at

https://www.huduser.gov/portal/pdredge/pdr-edge-featd-article-081417.html.
4 See, for example: https://www.census.gov/housing/census/publications/who-can-afford.pdf.
5 As reported in the ACS, “gross rent” includes the monthly costs for utilities, and fuels used in the home if these costs are paid

by the rental household or paid for the renter by someone else. Housing costs are “selected monthly owner costs,” as reported
by the ACS, and include monthly costs for mortgages, insurance, utilities, fuels used in the home and real estate taxes.
                                                                3
New Yorkers are more likely than residents of the United States as a whole to grapple with
issues of affordable housing. In the State, 37.8 percent of all households were above the
affordability threshold, and 19.0 percent faced severe cost burdens, compared to 30.7 percent
and 14.0 percent nationally, in 2017.
Not surprisingly, while households of varied income levels may face affordability challenges,
renters and homeowners with lower household incomes are more likely to exceed the
affordability threshold. For example, in 2017, more than three-quarters of renter households
with incomes of less than $20,000 had housing costs above the 30 percent threshold; that was
more than double the proportion of renters with household incomes between $50,000 and
$74,999. Among renter households with incomes above $75,000, the proportion was less than
10 percent. A similar pattern exists for homeowners.
While households at both lower and higher income levels sometimes devote large shares of
their incomes to housing costs, lower income New Yorkers are more likely to suffer harmful
impacts as a result. Families and individuals with higher incomes may make housing choices
for lifestyle purposes including location, property size and amenities. Lower income New
Yorkers, by contrast, are more likely to have limited disposable income and thus face limited
options in allocating household budgets.
For these households, impacts may include overcrowding in the home; reduced spending on
food, education and health care; longer commutes to work; lower housing and neighborhood
quality; and lower educational attainment for children.6 Unaffordable housing costs may lead
to evictions, with a range of troubling results for affected households. More broadly,
persistently high numbers of households burdened with high housing costs may have troubling
implications for New York State’s economy. For example, housing affordability affects the
amount of income that is available to households for other spending and the lack of affordable
housing may make it more difficult for employers to attract and retain workers.7
Trends in Affordability
Among all 50 states, New York had the fourth highest percentage of renters and the sixth
highest percentage of homeowners with housing costs above the affordability threshold in
2017. New York’s rankings in each of these categories worsened compared to 2008, when the
State was ranked sixth and tenth, respectively.
New York’s standings for rental and homeowner households considered severely cost
burdened also worsened in 2017 compared to 2008. The percentage of severely cost
burdened renter households went from fifth to third highest, while the share of homeowners
rose from sixth to third highest.
6 Stuart Gabriel and Gary Painter, “Why Affordability Matters,” presentation at Conference on Housing Affordability, American
Enterprise Institute, Washington DC, April 6, 2017; available at https://www.aei.org/wp-content/uploads/2017/04/CHA-Panel-
1.pdf.
7 Wardrip, Keith, Laura Williams and Suzanne Hague. “The Role of Affordable Housing in Creating Jobs and Stimulating Local
Economic Development: A Review of the Literature.” Center for Housing Policy. January 2011.
4New York’s statewide median gross rent increased steadily from 2008 through 2017. The total
increase was $138 or 12.7 percent in inflation-adjusted (constant) dollars, to $1,226 monthly.8
For homeowners, meanwhile, median costs for the same period decreased by $157 monthly,
or 10.2 percent, to $1,379.9 Median real estate taxes increased during this timeframe by $98
monthly to $442.10 Mortgage interest rates declined over much of this period, one possible
contributing factor to the decline in homeowner costs.11 (Unless otherwise noted, all cost and
income figures in this report are in constant dollars.) 12
Although homeowner costs decreased in the State during the 10-year period, homeowners had
less impact on overall New York affordability measures, as owner households’ share of total
occupied units decreased from 55.3 percent in 2008 to 53.8 percent in 2017. The overall
number of renter-occupied units increased by 5.7 percent or 183,192 units over the period,
reaching 46.2 percent of occupied units.
Household incomes increased during the period. For renters in New York State, the increase
in the annual median income was $1,042, or 2.5 percent, and for homeowners such increase
was $1,800 or 2.1 percent.
A total of 1.7 million New York households lived in rental units with rents equal to or higher than
30 percent of household income in 2017, an increase of 9.8 percent from 2008. Within this
group, 898,008 households lived in units with rents that fell into the severely cost-burdened
category, an increase of 9.2 percent over the same period. In each year during this time frame,
more than one in every four of New York’s rental households were considered severely cost
burdened, as shown in Figure 2.
8 Census data on housing costs do not reflect the positive impact of government-sponsored housing subsidies. Such subsidies
may reduce the number of households with rental costs above affordable levels, but are available only to a minority of such
households.
9 This information addresses costs for owner-occupied housing with and without a mortgage. The estimated percentage of
these households with a mortgage dropped from 65.5 percent in 2008 to 60.9 percent in 2017.
10 Real estate taxes reported are for “owner-occupied housing units.” Real estate taxes as defined in the ACS 2017 Subject
Definitions include the total amount of real estate taxes on the entire property (land and buildings) paid to all taxing jurisdictions
including special assessments, school taxes, and other municipal taxes. The Office of the State Comptroller also publishes
data on overall property tax collections by local governments, and changes in the level of such collections over time. Household
property tax data derived from Census Bureau statistics differ in certain respects from those collected and reported by the
Office of the State Comptroller and are not considered comparable.
11 Federal Reserve Economic Data. Economic Research Division, Federal Reserve Bank of St. Louis. See:
https://fred.stlouisfed.org.
12 As measured by the Consumer Price Index research series, in 2017 it took $1.14 to purchase the same amount of goods
and services that $1.00 purchased in 2008.
5Figure 2
Percentage of New York State Rental Households with Rents
Above the Affordability Threshold
60%
50%
40%
30%
20%
10%
0%
2008 2009 2010 2011 2012 2013 2014 2015 2016 2017
Percentage of Rental Households with Rent Above Affordability Threshold
Percentage of Rental Households with Severe Housing Cost Burden
Sources: U.S. Census Bureau
While the share of homeowners with “affordable” housing improved in 2017 when compared to
2008, significant numbers of these New Yorkers continue to pay high costs relative to their
incomes. In 2017, 27.5 percent of New York State homeowners paid 30 percent or more of
household income in monthly housing expenses, as shown in Figure 3.
Figure 3
Percentage of New York State Homeowners with Housing Costs
Above the Affordability Threshold
40%
35%
30%
25%
20%
15%
10%
5%
0%
2008 2009 2010 2011 2012 2013 2014 2015 2016 2017
Percentage of Homeowners with Costs Above Affordability Threshold
Percentage of Homeowners with Severe Housing Cost Burden
Sources: U.S. Census Bureau
6Although the overall number of homeowners in this category declined by 20.5 percent from
2008, nearly 1.1 million homeowners – or more than one in four – were left to contend with
monthly housing costs above the affordability threshold. In addition, in 2017, 12.4 percent or
488,217 of these New York homeowner households were severely cost-burdened, paying 50
percent or more of their income for housing expenses. That proportion fell by more than half
from 2008.
County-Level Measures of Housing Affordability
Counties all across New York State are confronted with issues related to housing affordability.
In most counties (54 of 62), the share of rental households paying housing costs over the
affordability threshold was over 40 percent during the 2013-2017 period, using ACS 5-year
estimates. Rockland County had the highest percentage, at 59.4 percent. In 17 of these
counties, this proportion was also more than one in every two rental households. Hamilton
County, the least populated county in the State, had the lowest percentage at 29.2.
Rockland also led all counties with the highest percentage of renter-occupied units that were
severely housing cost-burdened, at 36.3 percent. In 25 other counties, this proportion was more
than one in every four rental households.13
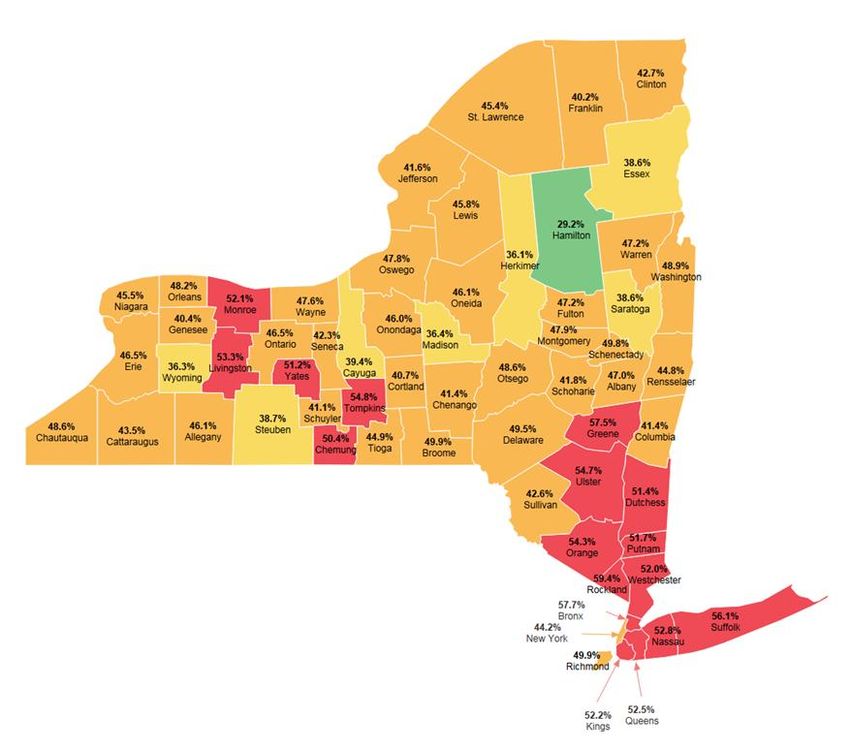
Figures 4 and 5 show the percentage of rental households in each county with housing costs
above the affordability and severe cost burden thresholds in the 2013-2017 period.14
13 In comparing the share of cost-burdened households in particular counties, the report assesses relative affordability,
measuring housing costs in relation to income. While incomes are generally higher in the downstate metropolitan region than
in upstate New York, housing costs are also generally higher downstate. For example, a rent or monthly owner cost that may
fall below the affordability threshold in New York City may be above the affordability threshold in an upstate county. See
Appendix B for county-by-county information on median monthly homeowner costs, median monthly gross rent and median
household income for the 2013-2017 period.
14 See Appendix A for figures which provide county-by-county percentages of homeowners and renters with housing costs
above the affordability and severe cost burden thresholds during the 2013-2017 period. Appendix C and D include county-by-
county information in the 2013-2017 period on the percentages and numbers of rental and homeowner households.
7Figure 4
Percentage of Rental Households with Rents Above
the Affordability Threshold in New York Counties, 2013–2017
Sources: U.S. Census Bureau
In evaluating county level affordability trends for rental households, a general regional pattern
emerges at the extremes of affordability. All the counties where fewer than 40 percent of rental
households are above the affordability threshold are in upstate regions, and those regions
generally also have lower proportions of severely cost burdened households than downstate
counties. Still, areas with relatively high proportions of households meeting both benchmarks
exist throughout the State.
8Figure 5
Percentage of Rental Households with Rents Above the Severe Housing
Cost Burden Threshold in New York Counties, 2013-2017
Sources: U.S. Census Bureau
An even clearer upstate/downstate pattern emerges for households that own their own homes.
The counties with the lowest percentages of homeowners above the affordability and severely
housing cost-burdened thresholds are primarily located in upstate regions, while those with the
highest percentages are in New York City, Long Island, and the Hudson Valley. For example,
four of five counties within New York City – Kings, Queens, Bronx and Richmond – were within
the top ten for homeowners exceeding both the affordability and severely housing-cost
burdened thresholds. Both counties on Long Island – Nassau and Suffolk – and four of the
seven counties in the Hudson Valley were also in the top ten.
Figures 6 and 7 show the percentage of homeowner households in each county with owner
costs above the affordability and severe cost burden thresholds in the 2013-2017 period.
9Figure 6
Percentage of Households with Homeowner Housing Costs Above the Affordability
Threshold in New York Counties, 2013-2017
Sources: U.S. Census Bureau
10Figure 7
Percentage of Households with Homeowner Housing Costs Above the Severe Cost Burden
Threshold in New York Counties, 2013-2017
Sources: U.S. Census Bureau
Factors That Affect Housing Affordability
In estimating housing costs for renters and homeowners, the ACS considers costs associated
with maintaining a household. As reported in the ACS, “gross rent” includes the monthly costs
for utilities, and fuels used in the home if these costs are paid by the rental household.
“Selected monthly owner costs,” as reported by the ACS, include those for mortgages,
insurance, utilities, fuels used in the home and real estate taxes.15
15U.S. Census Bureau, American Community Survey and Puerto Rico Community Survey, 2017 Subject Definitions. While
the Census data includes utilities, fuel and certain other costs, these components are not separately analyzed in this report.
11In addition to changes in overall housing costs, real estate taxes, and household incomes (as
shown in Figures 8 and 9), factors that affect affordability include relative demand for housing
compared to supply. These elements, along with real estate taxes, are discussed below. 16
Housing Costs
On a statewide basis, median monthly homeowner costs decreased by $157 in constant
dollars, or 10.2 percent to $1,379, between 2008 and 2017. The median monthly rent statewide
increased by $138, or 12.7 percent, during that period.17 As described earlier in this report, the
decline in costs for homeowners helped drive an improvement in affordability for those New
Yorkers, while the increase in rental costs contributed to a more negative affordability picture
for renters.
Real Estate Taxes
Real estate taxes affect housing costs directly and indirectly. Homeowners’ tax payments are
reported as part of the ACS survey of housing costs. Although owners of rental property factor
taxes into the rent they charge their tenants, such costs are not reported separately by the
Census Bureau. Statewide, monthly real estate taxes on owner-occupied housing units
increased by $98 in constant dollars, or 28.4 percent to $442, between the 2008 and 2017
ACS. The median monthly property tax comprised an increasing share of all median monthly
housing costs for homeowners over this period, rising from 22.4 percent in 2008 to nearly one-
third in 2017.
Figure 8
Statewide Trends in Housing Costs and Real Estate Taxes
(in 2017 Constant Dollars) 18
$1,800
$1,600
$1,400
$1,200
$1,000
$800
$600
$400
$200
$0
2008 2009 2010 2011 2012 2013 2014 2015 2016 2017
Median Gross Rent Median Owner Cost Median Property Tax
Sources: U.S. Census Bureau
16 Increases in cost factors between 2008 and 2017 for renters do not appear to be large. However, since housing can be one
of the largest categories of expenditure in many household budgets, even modest cost increases may have a significant impact
on a household budget.
17 To control for inflation, household income and other dollar figures were adjusted to 2017 dollars using factors based on the
All-Items CPI-U-RS (CPI Research Series) from the U.S Bureau of Labor Statistics: https://www.bls.gov/cpi/research-
series/home.htm.
18In this chart, median real estate tax figures as reported by the U.S. Census Bureau are converted from an annual figure to
a monthly figure by dividing by 12.
12Household Income
Since affordability is measured in relation to household income, changes in household income
can have a significant impact on affordability.
Over the period from 2008 to 2017, the median household income for renters increased by
$1,042 in constant dollars or 2.5 percent to $42,073, and for homeowners, income increased
by $1,800, or 2.1 percent to $89,035.
Figure 9
Statewide Trends in Household Income
(in 2017 Constant Dollars)
$100,000
$90,000
$80,000
$70,000
$60,000
$50,000
$40,000
$30,000
$20,000
$10,000
$0
2008 2009 2010 2011 2012 2013 2014 2015 2016 2017
Median Among Renters Median Among Homeowners Overall Median
Sources: U.S. Census Bureau
The Relative Scarcity of Housing
Market forces have an important impact on housing affordability. Imbalances between the
numbers of families and individuals seeking housing and the number of housing units available
can cause housing prices to rise or fall. The ratio of vacant housing units to the overall housing
supply is one way in which the relative availability (or scarcity) of housing can be measured.
Statewide, vacancy rates for rental housing and owner-occupied housing in 2017 stood at 4.2
percent and 1.6 percent, respectively. Both figures declined over the decade, from 4.7 percent
and 1.8 percent in 2008, respectively. Over the same period, the total number of occupied
housing units in New York State grew by 166,850, or 2.3 percent, driven by an increase of
183,192 in renter-occupied units. There were 183,388 more vacant housing units in 2017 than
in 2008, an increase of 21.8 percent, according to Census data.
13In some areas, such as New York City, population growth can be expected to exacerbate the
problem of affordability and availability if housing supply doesn’t keep pace. In New York City,
the share of recently available rental units affordable to appropriately-sized low- and moderate-
income households declined by 12.1 percentage points and 9.7 percentage points,
respectively, from 2007 to 2017. At the same time, the share of such rental units available to
extremely low- and very low-income households increased only marginally.19 In 2017, 11.5
percent of all rental housing in the City was considered overcrowded, while 4.5 percent was
severely overcrowded, both figures up from 2008.20
19 NYU Furman Center. See State of New York City’s Housing and Neighborhoods in 2018 available at:
https://furmancenter.org/files/sotc/SOC_2018_Full_2018-05-22.pdf. The report defines recently available rental housing units
as occupied units whose tenants moved in less than 12 months before their survey date. Extremely low-income, very low-
income, low-income and moderate-income are classified as earning 30 percent or less, 30 percent to 50 percent, 50 percent
to 80 percent and 80 percent to 120 percent of the area median income as defined by the U.S. Department of Housing and
Urban Development’s Section 8 and Home program guidelines.
20 New York City Rent Guidelines Board. See 2019 Housing Supply Report, May 16, 2019 available at
https://www1.nyc.gov/assets/rentguidelinesboard/pdf/hsr19.pdf and 2009 Housing Supply Report, June 4, 2009 available at
https://www1.nyc.gov/assets/rentguidelinesboard/pdf/hsr09.pdf. The reports define “overcrowded” as more than one person
per room, on average, and “severely overcrowded” as more than 1.5 persons per room.
14III. Conclusion
By several measures, it is clear that housing affordability is a critical concern confronting
millions of New Yorkers. In 2017, almost half of New York State’s rental households and more
than one in four homeowners faced housing costs above the affordability threshold of 30
percent of household income. On the national level, New York had among the highest
percentages of homeowners and renters above the affordability and severe housing cost
burden thresholds. New York’s rankings among all states for these housing affordability
metrics deteriorated for renters and homeowners alike from 2008 to 2017.
Factors including household income, overall housing costs, real estate taxes and relative
scarcity are important to consider in analyzing housing affordability. Changes in these factors
have been mixed over the period described in this report. While details have changed,
however, one essential point has not: The challenge of finding an affordable home remains
difficult for too many in New York State. As a result, large numbers of New Yorkers may be
forced to limit their spending on basic needs such as food, health care and education,
undermining standards of living and potential for quality of life. Negative impacts on New York’s
overall economy may result, as well. Successfully addressing these difficult challenges will
require policy makers to consider factors including the particular urgency of the affordability
problem for renters, variations in conditions and needs among New York’s regions, and the
effectiveness of policies and programs the State has already put into place to promote
affordable housing in New York.
15IV. Appendices
Appendix A: Housing Cost Burden Percentages by County
Figure A-1
Percentages of Rental Households Above Affordability
and Severe Cost Burden Thresholds, 2013-2017
Above Above
Affordability Affordability Severe Cost Severe Cost
County Threshold County Threshold County Burden County Burden
Rockland 59.4% Ontario 46.5% Rockland 36.3% Hamilton 23.2%
Bronx 57.7% Erie 46.5% Tompkins 33.3% Sullivan 23.2%
Greene 57.5% Allegany 46.1% Bronx 33.1% Warren 23.2%
Suffolk 56.1% Oneida 46.1% Suffolk 31.8% Chenango 23.0%
Tompkins 54.8% Onondaga 46.0% Greene 31.2% Clinton 22.9%
Ulster 54.7% Lewis 45.8% Orange 30.0% Fulton 22.7%
Orange 54.3% Niagara 45.5% Ulster 29.6% Washington 22.6%
Livingston 53.3% St. Lawrence 45.4% Richmond 29.5% Niagara 22.4%
Nassau 52.8% Tioga 44.9% Kings 29.2% Cattaraugus 21.9%
Queens 52.5% Rensselaer 44.8% Nassau 29.0% New York 21.8%
Kings 52.2% New York 44.2% Broome 29.0% Cortland 21.8%
Monroe 52.1% Cattaraugus 43.5% Livingston 28.8% Schoharie 21.8%
Westchester 52.0% Clinton 42.7% Montgomery 28.7% Ontario 21.6%
Putnam 51.7% Sullivan 42.6% Queens 28.7% Wayne 21.5%
Dutchess 51.4% Seneca 42.3% Chautauqua 28.7% Rensselaer 21.5%
Yates 51.2% Schoharie 41.8% Otsego 28.6% Genesee 21.3%
Chemung 50.4% Jefferson 41.6% Monroe 28.4% Columbia 20.9%
Richmond 49.9% Columbia 41.4% Dutchess 28.3% Allegany 20.7%
Broome 49.9% Chenango 41.4% Westchester 28.2% Essex 20.6%
Schenectady 49.8% Schuyler 41.1% Oswego 27.2% Schuyler 20.6%
Delaware 49.5% Cortland 40.7% Yates 27.1% Seneca 20.5%
Washington 48.9% Genesee 40.4% Delaware 26.8% Franklin 20.2%
Otsego 48.6% Franklin 40.2% Chemung 26.6% Cayuga 19.6%
Chautauqua 48.6% Cayuga 39.4% Schenectady 26.6% Orleans 19.1%
Orleans 48.2% Steuben 38.7% Onondaga 25.5% Jefferson 18.7%
Montgomery 47.9% Saratoga 38.6% Erie 25.4% Tioga 18.5%
Oswego 47.8% Essex 38.6% Putnam 24.9% Steuben 18.2%
Wayne 47.6% Madison 36.4% St. Lawrence 24.8% Madison 17.9%
Fulton 47.2% Wyoming 36.3% Albany 24.6% Saratoga 17.5%
Warren 47.2% Herkimer 36.1% Oneida 23.9% Wyoming 16.7%
Albany 47.0% Hamilton 29.2% Lewis 23.9% Herkimer 16.4%
Sources: U.S. Census Bureau
16Figure A-2
Percentages of Owner Households Above Affordability
and Severe Cost Burden Thresholds, 2013-2017
Above Above
Affordability Affordability Severe Cost Severe Cost
County Threshold County Threshold County Burden County Burden
Kings 40.4% Wayne 20.7% Kings 21.8% Essex 8.1%
Suffolk 39.1% Saratoga 20.7% Queens 19.8% Livingston 8.1%
Queens 39.0% Tompkins 20.5% Bronx 19.4% Madison 8.1%
Rockland 38.5% Livingston 20.4% Richmond 17.9% Rensselaer 7.8%
Bronx 37.4% Essex 20.4% Suffolk 17.5% Oswego 7.8%
Nassau 37.2% Broome 20.2% Rockland 17.0% Schenectady 7.7%
Richmond 37.0% Niagara 20.2% Nassau 16.6% Niagara 7.6%
Putnam 35.1% Oswego 20.0% Westchester 15.7% Saratoga 7.5%
Westchester 34.2% Oneida 20.0% Putnam 14.5% Chautauqua 7.5%
Orange 33.9% Cayuga 19.8% Orange 13.9% Oneida 7.5%
Dutchess 32.8% Herkimer 19.7% Ulster 13.8% Allegany 7.5%
Sullivan 31.7% Franklin 19.6% Sullivan 12.8% Clinton 7.4%
Ulster 31.2% Albany 19.6% Dutchess 12.8% Cattaraugus 7.4%
Schoharie 27.6% Allegany 19.6% Columbia 11.3% Tompkins 7.4%
Columbia 26.7% Chautauqua 19.4% New York 10.9% Jefferson 7.3%
Orleans 25.5% Schuyler 19.4% Greene 10.6% Chenango 7.3%
Greene 25.0% Tioga 19.4% Schoharie 10.4% Steuben 7.2%
Washington 24.9% St. Lawrence 19.3% Washington 10.2% Broome 7.2%
Warren 23.8% Chenango 19.3% Schuyler 9.9% Herkimer 7.2%
Delaware 23.1% Seneca 19.2% Warren 9.6% Erie 7.2%
Montgomery 22.8% Clinton 19.1% Delaware 9.6% Albany 7.1%
Rensselaer 22.6% Erie 19.0% Otsego 9.6% Wayne 7.1%
Yates 22.5% Steuben 18.9% Hamilton 9.4% Lewis 7.1%
Schenectady 22.0% Genesee 18.9% Fulton 9.2% Wyoming 7.1%
Fulton 21.6% Ontario 18.4% Yates 9.0% Ontario 7.0%
New York 21.6% Onondaga 18.2% Orleans 8.9% Tioga 6.9%
Otsego 21.3% Cattaraugus 18.1% Franklin 8.7% Onondaga 6.7%
Madison 21.2% Lewis 18.0% Montgomery 8.6% Chemung 6.5%
Monroe 21.1% Wyoming 17.9% St. Lawrence 8.4% Cortland 6.3%
Hamilton 20.9% Chemung 16.4% Monroe 8.3% Genesee 6.2%
Jefferson 20.8% Cortland 16.4% Cayuga 8.2% Seneca 5.7%
Sources: U.S. Census Bureau
17Appendix B: Housing Costs and Household Income by County
Figure B-1
Median Monthly Gross Rent and Median Renter Income, 2013-2017
Median Median
Median Renter Median Renter
County Rent Income County Rent Income
Albany $969 $36,913 Niagara $669 $26,056
Allegany $633 $24,682 Oneida $735 $28,001
Bronx $1,133 $30,307 Onondaga $823 $30,906
Broome $734 $24,911 Ontario $837 $32,376
Cattaraugus $626 $24,584 Orange $1,187 $39,398
Cayuga $715 $30,872 Orleans $683 $23,925
Chautauqua $631 $23,115 Oswego $748 $26,822
Chemung $764 $25,130 Otsego $808 $28,974
Chenango $645 $25,422 Putnam $1,334 $51,854
Clinton $762 $30,683 Queens $1,456 $48,971
Columbia $886 $34,632 Rensselaer $908 $34,635
Cortland $742 $31,925 Richmond $1,229 $37,456
Delaware $696 $23,038 Rockland $1,420 $39,600
Dutchess $1,174 $41,235 St. Lawrence $723 $25,050
Erie $778 $29,183 Saratoga $1,046 $48,664
Essex $798 $34,195 Schenectady $894 $30,581
Franklin $670 $26,303 Schoharie $781 $31,452
Fulton $734 $28,939 Schuyler $741 $25,878
Genesee $748 $30,211 Seneca $750 $30,298
Greene $876 $25,582 Steuben $691 $28,813
Hamilton $713 $39,444 Suffolk $1,646 $48,689
Herkimer $657 $30,667 Sullivan $860 $33,820
Jefferson $966 $38,177 Tioga $695 $29,304
Kings $1,314 $41,388 Tompkins $1,055 $30,841
Lewis $742 $28,696 Ulster $1,053 $33,454
Livingston $755 $25,736 Warren $881 $33,639
Madison $755 $31,903 Washington $823 $31,223
Monroe $872 $29,520 Wayne $742 $27,094
Montgomery $732 $24,678 Westchester $1,444 $48,703
Nassau $1,663 $53,706 Wyoming $634 $30,228
New York $1,615 $64,171 Yates $732 $26,941
Sources: U.S. Census Bureau
18Figure B-2
Median Monthly Owner Costs and Median Owner Income, 2013-2017
Median Median
Median Owner Median Owner
County Costs Income County Costs Income
Albany $1,291 $91,088 Niagara $882 $66,545
Allegany $659 $54,559 Oneida $878 $65,008
Bronx $1,472 $78,745 Onondaga $1,043 $76,973
Broome $855 $64,205 Ontario $1,045 $75,732
Cattaraugus $730 $56,052 Orange $1,805 $94,970
Cayuga $903 $66,267 Orleans $903 $57,869
Chautauqua $702 $55,440 Oswego $896 $65,004
Chemung $835 $66,831 Otsego $797 $60,694
Chenango $730 $57,959 Putnam $2,240 $113,960
Clinton $821 $64,035 Queens $1,582 $82,874
Columbia $1,164 $74,654 Rensselaer $1,272 $82,463
Cortland $928 $71,111 Richmond $1,970 $97,362
Delaware $754 $55,288 Rockland $2,433 $115,523
Dutchess $1,772 $95,271 St. Lawrence $730 $57,220
Erie $951 $72,092 Saratoga $1,331 $92,138
Essex $866 $63,784 Schenectady $1,199 $80,036
Franklin $738 $60,130 Schoharie $941 $60,289
Fulton $791 $58,440 Schuyler $784 $58,375
Genesee $894 $66,692 Seneca $818 $61,849
Greene $989 $65,432 Steuben $754 $60,023
Hamilton $743 $56,686 Suffolk $2,239 $105,889
Herkimer $728 $58,723 Sullivan $1,047 $65,063
Jefferson $888 $65,842 Tioga $822 $68,758
Kings $1,844 $88,539 Tompkins $1,145 $79,895
Lewis $750 $59,339 Ulster $1,379 $76,884
Livingston $948 $66,419 Warren $1,060 $72,530
Madison $987 $67,285 Washington $987 $64,632
Monroe $1,105 $75,493 Wayne $946 $63,238
Montgomery $858 $60,333 Westchester $2,539 $127,152
Nassau $2,494 $121,764 Wyoming $839 $64,664
New York $1,889 $148,734 Yates $837 $62,015
Sources: U.S. Census Bureau
19Appendix C: Percentages of Rental and Owner Households by
County, 2013-2017
Rental Owner Rental Owner
County Households Households County Households Households
Albany 43.2% 56.8% Niagara 28.5% 71.5%
Allegany 25.7% 74.3% Oneida 33.4% 66.6%
Bronx 80.3% 19.7% Onondaga 35.1% 64.9%
Broome 34.3% 65.7% Ontario 26.8% 73.2%
Cattaraugus 28.7% 71.3% Orange 31.6% 68.4%
Cayuga 29.2% 70.8% Orleans 25.0% 75.0%
Chautauqua 30.0% 70.0% Oswego 27.4% 72.6%
Chemung 31.9% 68.1% Otsego 25.7% 74.3%
Chenango 25.1% 74.9% Putnam 18.1% 81.9%
Clinton 32.0% 68.0% Queens 55.5% 44.5%
Columbia 27.6% 72.4% Rensselaer 36.6% 63.4%
Cortland 35.3% 64.7% Richmond 30.5% 69.5%
Delaware 26.7% 73.3% Rockland 31.1% 68.9%
Dutchess 30.8% 69.2% St. Lawrence 27.5% 72.5%
Erie 35.0% 65.0% Saratoga 28.5% 71.5%
Essex 24.0% 76.0% Schenectady 32.2% 67.8%
Franklin 27.1% 72.9% Schoharie 24.5% 75.5%
Fulton 28.6% 71.4% Schuyler 23.6% 76.4%
Genesee 27.5% 72.5% Seneca 26.8% 73.2%
Greene 24.2% 75.8% Steuben 28.2% 71.8%
Hamilton 15.3% 84.7% Suffolk 19.7% 80.3%
Herkimer 28.3% 71.7% Sullivan 33.1% 66.9%
Jefferson 44.4% 55.6% Tioga 22.9% 77.1%
Kings 70.0% 30.0% Tompkins 44.5% 55.5%
Lewis 22.0% 78.0% Ulster 30.6% 69.4%
Livingston 26.8% 73.2% Warren 28.1% 71.9%
Madison 24.0% 76.0% Washington 27.3% 72.7%
Monroe 36.2% 63.8% Wayne 23.2% 76.8%
Montgomery 31.1% 68.9% Westchester 38.5% 61.5%
Nassau 19.4% 80.6% Wyoming 24.2% 75.8%
New York 75.9% 24.1% Yates 22.9% 77.1%
Sources: U.S. Census Bureau
20Appendix D: Numbers of Rental and Owner Households by County,
2013-2017
Rental Owner Rental Owner
County Households Households County Households Households
Albany 54,102 71,274 Niagara 25,090 62,888
Allegany 4,661 13,463 Oneida 30,201 60,271
Bronx 397,698 97,658 Onondaga 65,234 120,606
Broome 27,052 51,769 Ontario 11,880 32,389
Cattaraugus 9,106 22,617 Orange 40,011 86,449
Cayuga 9,173 22,255 Orleans 4,048 12,166
Chautauqua 15,885 37,098 Oswego 12,579 33,302
Chemung 11,055 23,609 Otsego 6,074 17,553
Chenango 5,108 15,265 Putnam 6,215 28,101
Clinton 10,138 21,542 Queens 431,863 346,041
Columbia 7,041 18,429 Rensselaer 23,578 40,878
Cortland 6,327 11,598 Richmond 50,722 115,428
Delaware 5,090 14,008 Rockland 31,113 68,822
Dutchess 33,120 74,264 St. Lawrence 11,449 30,189
Erie 135,159 251,212 Saratoga 26,505 66,624
Essex 3,657 11,600 Schenectady 17,306 36,519
Franklin 5,136 13,820 Schoharie 3,068 9,471
Fulton 6,450 16,085 Schuyler 1,756 5,688
Genesee 6,582 17,369 Seneca 3,624 9,912
Greene 4,146 12,960 Steuben 11,395 28,956
Hamilton 168 927 Suffolk 96,263 393,065
Herkimer 7,134 18,053 Sullivan 9,158 18,521
Jefferson 19,194 24,012 Tioga 4,574 15,422
Kings 660,898 283,752 Tompkins 17,356 21,630
Lewis 2,249 7,987 Ulster 21,319 48,343
Livingston 6,544 17,888 Warren 7,644 19,605
Madison 6,322 19,985 Washington 6,557 17,431
Monroe 108,715 191,781 Wayne 8,469 28,109
Montgomery 6,135 13,565 Westchester 133,154 212,731
Nassau 86,154 357,982 Wyoming 3,789 11,897
New York 575,892 182,453 Yates 2,142 7,196
Statewide Total 3,360,227 3,942,483
Sources: U.S. Census Bureau
21Contact Office of the New York State Comptroller 110 State Street, 15th Floor Albany, New York 12236 (518) 474-4015 www.osc.state.ny.us Prepared by the Office of Budget and Policy Analysis
You can also read