(BSA) MasterMind. cCBT. Badalona Serveis Assitencials - mafeip
←
→
Page content transcription
If your browser does not render page correctly, please read the page content below
Support Services for the Management and Utilization of
 Monitoring and Assessment of the EIP ‐ MAFEIP Tool

                  MasterMind. cCBT.
    Badalona Serveis Assitencials
               (BSA)

                                          Authors:
Jordi Piera, Clara Faulí, Ruth Vilar, Strahil Birov, Veli Stroetmann, Francisco Lupiáñez‐
                                         Villanueva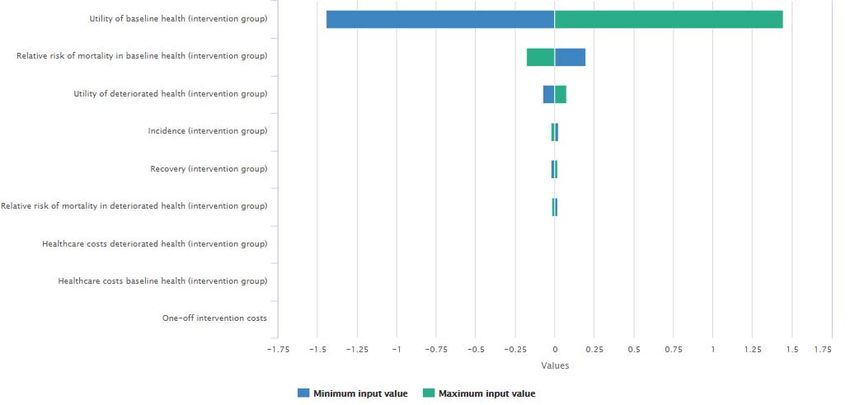
http://mafeip.eu
                                                                                                       info@mafeip.eu

                                           Executive summary
Description of the intervention
The objective of the MasterMind1 project was to make high quality treatment for depression
more widely available for adults suffering from the illness through the use of ICT. This use case
focuses on one of the two services included in the project, the cCBT (Guided cCBT for treatment
of depression). The service targeted patients aged 18 or older diagnosed with depression and its
contents were divided into seven mandatory modules and an extra one, meant to be self‐
administered approximately at a rhythm of one per week. This resource was expected to improve
the delivery of psychological interventions in general practice. The present use case focuses on
the results from the pilot in Badalona Serveis Assistencials (BSA)2, in which participants ranged
from 18 to 75 years old and it included both females (67%) and males (33%). In this site, the cCBT
service was combined with the routine face‐to‐face visits with the GP. The evaluation used a one‐
group pre‐trial‐post‐trial study design and followed the assessment domains as defined by the
Model for ASessment of Telemedicine (MAST) (Kidholm et al., 2012)3.

Model input
Defining the health states and the transition probabilities
The health states are defined according to the symptoms of a Major Depressive Disorder (MDD).
The category of ‘no symptoms’ represents the baseline health and having symptoms of MDD the
deteriorated state. At the start of the treatment all 84 participants had symptoms, but after the
intervention 44% of them showed no symptoms. Thus, this is the value used as an input for the
recovery rate of the intervention group. The recovery rate for the control group (29%) comes
from the scientific literature, concretely from trials that assess the effect of medication in the
treatment of depression during a similar period (Table 1). The incidence rate of 3%, was obtained
from the literature and was used for both the control and the intervention group because the
intervention’s target is to cure those impaired by depression, not to prevent new cases (Table 1).
The risk for mortality of those with depression is, according to the scientific literature, higher than
for the general population. In line with this, a relative risk (RR) of 1.92 is used for the deteriorated
state (both for the control and the intervention groups) (Table 1).

Computing the costs
The summary of the costs directly related to the intervention, which are costs that affect only the
group that tested the cCBT service, are shown in Table 1. The one‐off costs, those only incurred
at the implementation point, include technical support, training provision, and ICT infrastructure.
These costs were divided by the number of patients that started the intervention, 261. On the
other hand, the recurring costs derived from the service practice include the costs of the cCBT
sessions (direct costs and overheads). The cost of each session was multiplied by eight, the total
number of modules of the service. However, since only those with depressive symptoms follow
the treatment, these costs should only be counted in the deteriorated state. For this reason, we
add them under healthcare costs in the intervention’s deteriorated state. Moreover, since all

1 https://mastermind‐project.eu/
2 Badalona Serveis Assistencials https://apps.bsa.cat/drupal/
3 Kidholm, K., Pedersen, C. D., Jensen, L. K., Ekeland, A. G., Bowes, A., Flottorp, S., & Bech, M. (2012). A model for

assessment of telemedicine applications – MAST. International Journal of Technology Assessment in Health Care,
28(1), 44–51.

                                                                                                                         2
http://mafeip.eu
                                                                                                info@mafeip.eu

participants in MasterMind start with depression symptoms, implying that they receive the
treatment, we also add them to the one‐off costs, which account for the cost of the first cycle.
Table 1 also reports the healthcare and societal costs in each situation, usual care and
intervention, and for both alive health states. Healthcare costs refer to resource use within the
healthcare system. On the other hand, societal costs include the healthcare costs plus those costs
outside the healthcare sector. The costs were obtained from a study focusing on the Major
Depressive Disorder in Spain (Sicras‐Mainar, Mauriño, Cordero, Blanca‐Tamayo, & Navarro‐
Artieda, 2012)4. The study calculated healthcare costs (physician visits, hospitalisations,
pharmaceuticals, etc.) and indirect costs associated with patients' production losses due to sick
leave (i.e. societal costs), for patients that were in remission (baseline state) and for those that
were not (deteriorated state). In addition, BSA participated in a very similar project, Caring me,
that estimated the reduction in costs during the cCBT intervention. These estimates were applied
to the previous values in order to get the healthcare and societal costs for the intervention’s
deteriorated state. The healthcare costs of the intervention’s baseline are the same than those
of the control group, because since they have recovered, the intervention no longer applies to
them.

Utility
MAFEIP recommends using the EQ‐5D to calculate utility, but MasterMind did not use this
questionnaire. However, it collected the variable Satisfaction with life using a 7‐point Likert scale.
This was mapped into the 0‐1 range and used as a proxy for Quality of Life. The utility in the
baseline for both groups was calculated as the average satisfaction with life of those that after
the MasterMind pilot had no symptoms. On the other hand, the average utility of those that had
depressive symptoms after the pilot is the value that we input for the intervention’s deteriorated
state. Finally, the average utility of the whole sample before the intervention started is the value
that we use for the control group/deteriorated state, since all participants had depressive
symptoms before the implementation of the cCBT service (Table 1).
                         Table 1. Input data used to populate the MAFEIP model
                                                               Control Group             Intervention Group
    Transition Probabilities
                                              Incidence             3%                           3%
                                               Recovery             29 %                         44 %
    Relative Risk
                                         Baseline State             1.00                         1.00
                                     Deteriorated State             1.92                         1.92
    Costs
                 One‐off cost per patient (Intervention)             ‐                         2,414 €
          Recurring cost per patient/year (intervention)             ‐                            ‐
                             Healthcare cost – Baseline            451 €                        451 €
                         Healthcare cost – Deteriorated            826 €                       2,573 €
                                 Societal cost – Baseline         1,442 €                       533 €
                            Societal cost – Deteriorated          2,668 €                      2,726 €
    Utility
                                           Baseline State           0.71                         0.71
                                      Deteriorated State            0.39                         0.59

4Sicras‐Mainar, A., Mauriño, J., Cordero, L., Blanca‐Tamayo, M., & Navarro‐Artieda, R. (2012). Costes y factores
asociados a las respuestas óptima y subóptima al tratamiento del trastorno depresivo mayor en atención primaria.
Atencion Primaria, 44(11), 667–675.

                                                                                                               3
http://mafeip.eu
info@mafeip.eu
Model output
Figure 1 shows the overall impact of the intervention on the costs and effects of the whole target
population. The incremental cost‐effectiveness ratio (ICER) is placed in the upper‐right quadrant
of the cost‐effectiveness plane. This means that the intervention is more effective than the
current care, but it is also more expensive. Therefore, the cost‐effectiveness of the service
depends on the Willingness to Pay (WTP) threshold. Concretely, the cCBT implemented during
MasterMind is cost‐effective if the willingness to pay is at least 9,900€ per QALY.
Figure 1. Cost‐effectiveness
ICER
4http://mafeip.eu
info@mafeip.eu
1. Description of the intervention
The objective of the MasterMind project is to make high quality treatment for depression more
widely available for adults suffering from the illness through the use of ICT. Despite the availability
of effective treatments, the number of people that actually receive treatment for depressive
disorders is not optimal. Moreover, unipolar depression is amongst the most prevalent mental
disorders around the world, and is associated with a high disease burden and elevated economic
and societal costs due to absenteeism, early retirement, loss of productivity and premature death
(Ferrari et al., 20135; Kessler, 20076; Wittchen et al., 20117). In the usual care situation, the
majority of persons with a mild or moderate depressive disorder receive treatment in primary
care settings, mostly from GPs, by means of antidepressants and less by brief psychotherapeutic
interventions. Patients suffering from more severe depressive disorders are often referred to
specialised mental healthcare services where treatment consists of medication, psychotherapy,
or a combination of both.
In this context, the use of the cCBT resource could be a way to improve the delivery of
psychological interventions in general practice. This would allow for short consultations and for
the clinician to be a facilitator rather than a cognitive therapist. These features could improve
feasibility in general practice, where the volume of patients is high, and it is essential that
interventions are brief and practical.
MasterMind tested two services: cCBT (Guided cCBT for treatment of depression) and cCVC
(Video conference for Collaborative Care and treatment of depression), in fifteen pilot sites. This
analysis focuses on one of these sites: Badalona Serveis Assistencials (BSA), a public health and
social care provider operating in the most populated suburban area of Barcelona (Spain). BSA is
one of the frontrunners within the implementation of ICT in the provision of care at all levels and
has been doing so for the last 10 years. In the case of the deployment of cCBT services,
MasterMind was the second experience of Badalona, which had previously done a similar project
called Caring me8 through a public‐private partnership with Arvato‐Bertelsmann. The
underpinning concept around the pilot site in Badalona was to empower the general practitioners
(GPs) operating at the 7 Primary Care Centres of BSA within the treatment of mild and moderate
Major Depressive Disorder, thus providing them with an Internet‐based intervention to deal with
those types of patients. The cCBT intervention adopted in BSA was developed by the so‐called
Spanish Cluster (comprising the Spanish partners of the project) and was fully designed from
scratch and called Supera tu Depresión (Get Over your Depression). The contents are divided into
seven mandatory modules and an extra one, meant to be self‐administered approximately at a
rhythm of one per week. It targets patients aged 18 or older diagnosed with depression. The
service, which was successfully piloted for more than one year, has now become a routine
practice service in BSA9.
5 Ferrari, A. J., Charlson, F. J., Norman, R. E., Flaxman, A. D., Patten, S. B., Vos, T., & Whiteford, H. A. (2013). The
Epidemiological Modelling of Major Depressive Disorder: Application for the Global Burden of Disease Study 2010. PLoS
ONE, 8(7).
6 Kessler, D., Lewis, G., Kaur, S., Wiles, N., King, M., Weich, S., … Peters, T. J. (2009). Therapist‐delivered internet
psychotherapy for depression in primary care: a randomised controlled trial. The Lancet, 374, 628–634.
7 Wittchen, H. U., Jacobi, F., Rehm, J., Gustavsson, A., Svensson, M., Jönsson, B., … Steinhausen, H. C. (2011). The size
and burden of mental disorders and other disorders of the brain in Europe 2010. European Neuropsychopharmacology,
21(9), 655–679.
8 http://www.caring‐me.com/
9 http://apps.bsa.cat/drupal/?q=node/126
5http://mafeip.eu
info@mafeip.eu
The age of the participants in the BSA pilot ranged from 18 to 75 years old and it included both
females (67%) and males (33%). The cCBT service was combined with the routine face‐to‐face
visits with the GP. The evaluation used a one‐group pre‐trial‐post‐trial study design and followed
the assessment domains as defined by the Model for ASessment of Telemedicine (MAST)
(Kidholm et al., 2012)10.
10Kidholm, K., Pedersen, C. D., Jensen, L. K., Ekeland, A. G., Bowes, A., Flottorp, S., & Bech, M. (2012). A model for
assessment of telemedicine applications – MAST. International Journal of Technology Assessment in Health Care,
28(1), 44–51.
6http://mafeip.eu
info@mafeip.eu
2. Model input
2.1. Defining the health states and the transition probabilities
In the MasterMind project, each pilot measured the symptoms of depression according to routine
practice diagnostic procedures (e.g. PHQ‐9, BDI, etc.). Participants were classified in 5 categories:
1 = No symptoms are experienced, 2 = Symptoms are mild, 3 = Symptoms are moderate, 4 =
Symptoms are severe, 5= Symptoms are very severe. The category of no symptoms represents
the baseline health and the rest the deteriorated state, that in this case implies having symptoms
of a Major Depressive Disorder (MDD).
At the start of the treatment all 84 participants11 had symptoms, since, by definition, the
intervention was intended at people suffering MDD. Most of them had mild symptoms (69%),
around one fifth had moderate symptoms (21.4%), and just a few had severe symptoms (9.5%).
After the intervention, 37 showed no symptoms. This is a 44% of the sample, and it is the value
that it is used as an input for the recovery rate of the intervention group. A systematic review and
meta‐analysis of remission from untreated major depression found that 23% of prevalent cases
of untreated depression remit12 within 3 months, 32% within 6 months and 53% within 12 months
(Whiteford et al., 2013)13. The MasterMind intervention lasts approximately after 3 months, thus
the value of 23% could be regarded as the recovery value without the intervention (control
group). However, due to the fact that patients in usual care are often under medication, the
recovery rate of this group could be higher. Some trials assess the effect of medication in the
treatment of depression at 16 weeks, often comparing it with other forms of treatment. De
Jonghe, Kool, Van Aalst, Dekker, & Peen (2001)14 found a remission rate for pharmacotherapy of
29.7%. Dimidjian et al. (2006)15 estimated antidepressant medication rates of remission of 42%
using the BDI16. Based on the HRSD17, the rate was 33% among the less severely depressed
participants and 23% among the more severely depressed. Finally, Kessler et al. (2009) report
that in the control group (usual care from their GP while on an 8‐month waiting list for online
CBT), 24% recovered from depression at 4 months. The average of the values from these studies
is 29%18, which is the number that is used as input for the model in the control group. In the
sensitivity analysis the applied range is between 23% and 42%.
Regarding the incidence rate, the same value for the control and the intervention groups is used
because the intervention’s target is to cure those impaired by depression, not to prevent new
11 The sample does not include the drop‐outs, only those for which data both before and after treatment is available.
12 Remission was defined as rescinded diagnoses or below threshold scores on standardized symptom measures.
13 Whiteford, H. A., Harris, M. G., McKeon, G., Baxter, A., Pennell, C., Barendregt, J. J., & Wang, J. (2013). Estimating
remission from untreated major depression: A systematic review and meta‐analysis. Psychological Medicine, 43(8),
1569–1585.
14 De Jonghe, F., Kool, S., Van Aalst, G., Dekker, J., & Peen, J. (2001). Combining psychotherapy and antidepressants in
the treatment of depression. Journal of Affective Disorders, 64(2–3), 217–229.
15 Dimidjian, S., Hollon, S., Dobson, K., Schmaling, K., Kohlenberg, R., Addis, M., … Jacobson, N. (2006). Randomized trial
of behavioral activation, cognitive therapy, and antidepressant medication in the acute treatment of adults with major
depression. Journal of Consulting and Clinical Psychology, 74(4), 658–670.
16 Beck Depression Inventory.
17 Hamilton rating scale for depression.
18 For Dimidjian et al. (2006) we did the weighted average among the two sub‐samples (less and more depressed),
according to the MasterMind participants and we then did the average between the two scales, BDI and HRSD.
7http://mafeip.eu
info@mafeip.eu
cases. The literature review conducted by Ferrari et al. (2013)19 found a pooled estimate of annual
incidence of 3%, which is also included in the model.
The risk for mortality, according to the scientific literature, should be a bit higher than for the
general population. As mentioned before, unipolar depression is associated with premature
death. For instance, people with major depression and schizophrenia have a 40% to 60% greater
chance of dying prematurely than the general population, due to physical health problems left
unattended and suicide (WHO, 2013)20. WHO provides data on deaths by cause but this does not
include depressive disorders. Baxter, Page, & Whiteford (2011)21 conducted a systematic review
and meta‐analysis of excess mortality in population‐based studies of clinically defined depression.
They concluded that there is a significantly higher risk of mortality for major depression, with an
estimated relative risk (RR) of 1.92. Therefore, this is the value used within the present exercise
for the deteriorated health state. Since reducing suicides was not the main objective of the
intervention, and it is not possible to demonstrate whether the MasterMind service model
reduced this risk, we introduce the same value in the intervention and control groups.
2.2. Computing the costs
The main costs to implement the MasterMind services (intervention one‐off costs) are the
support given to therapists to implement the services in their daily routine, the ICT infrastructure,
and the training for users. This training focused on both the clinical and technical aspects, thus
on how to use the platform, and on the therapeutic intervention elements that are included in
the platform. Two people from BSA personnel supported the implementation of the intervention
during one year, one was in charge of the technical support and the other of providing training
to users. The salary of such technical staff is approximately (according to the Spanish standards)
of 40,000€/year. This was divided by two because they were also in charge of supporting the cCVC
service. Moreover, all the implementation costs were divided by the number of patients that
started the intervention, 261, which gives a total number of 246€ per patient. Regarding the
recurring costs, the direct costs associated with one cCBT session (including therapist salary,
licences, service level agreements and maintenance and ICT infrastructure) are estimated to be
238€. Overheads (office rent, gas, heating/cooling, administration etc.) are around 33€ per
session. Since the program contains eight modules, these costs were multiplied by eight, reaching
the number of 2,168€ per patient and year. However, since only those with depressive symptoms
follow the treatment, these costs should only be counted in the deteriorated state. For this
reason, we add them in Table 3 under healthcare costs (which are also expressed in terms of costs
per year and person, but allow to distinguish between states). In addition, all participants in
MasterMind start with depression symptoms, implying that they receive the treatment. To
account for this, we include the sessions’ cost also in the one‐off section, which computes the
cost of the first cycle (Table 2).
19 Ferrari, A. J., Charlson, F. J., Norman, R. E., Flaxman, A. D., Patten, S. B., Vos, T., & Whiteford, H. A. (2013). The
Epidemiological Modelling of Major Depressive Disorder: Application for the Global Burden of Disease Study 2010.
PLoS ONE, 8(7).
20 WHO. (2013). Mental Health Action Plan 2013‐2020. Geneva. Retrieved from
http://apps.who.int/iris/bitstream/10665/89966/1/9789241506021_eng.pdf
21 Baxter, A. J., Page, A., & Whiteford, H. A. (2011). Factors influencing risk of premature mortality in community
cases of depression: A meta‐analytic review. Epidemiology Research International, 2011, 1–12.
8http://mafeip.eu
info@mafeip.eu
Table 2. Intervention costs
Intervention one‐off costs (per patient)
Time spent to support therapists to implement the service(s) 77
Training cost 77
ICT infrastructure 92
Direct costs of cCBT sessions 1,904
Overheads 264
TOTAL 2,414
Healthcare costs refer to resource use within the healthcare system in each situation, usual care
and intervention. This includes, among others, the cost of consultations with the health
professional, hospitalisation costs, cost of medication, etc. The MasterMind project did not
compute healthcare costs. However, a study focusing on the Major Depressive Disorder in Spain
(Sicras‐Mainar et al., 2012) estimated the cost per person and year. It calculated healthcare costs
(physician visits, hospitalisations, pharmaceuticals, etc.) and indirect costs associated with
patients' production losses due to sick leave (i.e. societal costs). These costs were calculated for
patients that were in remission and those that were not. Healthcare costs for patients in
remission (baseline state) were estimated to be 451€ and for those not in remission (deteriorated
state) 826€.
As previously mentioned, BSA participated in a very similar project, Caring me, that did an
estimation about the cost. Caring me provided a CBT therapy through a virtual platform that
consisted of 12 sessions. The planned interval between sessions was 7‐21 days, thus, the whole
intervention could approximately last around 3‐8 months. They estimated that the intervention
reduced healthcare costs22 by 51%. Assuming the same impact for MasterMind, we get that the
healthcare costs for the deteriorated state are 405€. We add to this the costs of the cCBT sessions
which gives a value of 2,573€. In the baseline state, we input the same value than for the control
group, because since they have recovered, the intervention no longer applies to them.
22This was composed of primary care costs (consultations, tests, medication, etc.) and specialised care costs (days in
hospital, consultations, emergency care).
9http://mafeip.eu
info@mafeip.eu
Table 3. Healthcare Costs (per patient and year in €)
Control Group baseline health 451
Control Group deteriorated health 826
Intervention Group baseline health 451
Intervention Group deteriorated health 2,573
The societal costs include the healthcare costs plus those costs outside the healthcare sector. For
example: time spent using the new service, time spent travelling for patients and caregivers,
travel costs for patients and caregivers, time spent by patients in consultation, time spent in
caregiving tasks by informal caregiver, etc. As mentioned above, Sicras‐Mainar et al. (2012)
estimated the costs due to loss of labour productivity. The estimates were 991€ for patients in
remission and 1,842€ for the ones not in remission. On the other hand, the Caring me project
estimated that the losses due to sick leave had diminished by 91.7% after the intervention.
Assuming the same impact for MasterMind, would give a cost for the intervention group of 82€
(baseline) and 153€ (deteriorated). These costs are added to the healthcare costs (Table 4).
Table 4. Societal Costs (per patient and year in €)
Control Group baseline health
Cost of sick leave 991
Healthcare costs 451
TOTAL 1,442
Control Group deteriorated health
Cost of sick leave 1,842
Healthcare costs 826
TOTAL 2,668
Intervention Group baseline health
Cost of sick leave 82
Healthcare costs 451
TOTAL 533
Intervention Group deteriorated health
Cost of sick leave 153
Healthcare costs 2,573
TOTAL 2,726
2.3. Utility
MAFEIP recommends using EQ‐5D to calculate utility, but MasterMind did not use this
questionnaire. However, it collected the variables Satisfaction with life23 and satisfaction with
mental health24 using a 7‐point Likert scale, which will be used as a proxy for Quality of Life. These
variables were computed before and after treatment. The values in the 7‐point Likert scale were
mapped into a 0‐1 range25. We calculated the utility in the baseline health scenario as the average
satisfaction with life of those that after the MasterMind pilot had no symptoms. The same value
23 How satisfied are you with your life as a whole today?
24 How satisfied are you with your mental health?
25 Using the formula: X = (x ‐ 1) / 6
10http://mafeip.eu
info@mafeip.eu
was used as input for both the control and intervention26 groups. On the other hand, the average
utility of those that had depressive symptoms after the pilot, is the value that we input for the
intervention’s deteriorated state. Finally, the average utility of the whole sample before the
intervention started is the value that we use for the control group’s deteriorated state, since all
participants had depressive symptoms before the implementation of the cCBT service (Table 5).
Table 5. Utility
Control Intervention
Baseline 0.71 0.71
Deteriorated 0.39 0.59
26This implies assuming that the utility of patients once they have recovered is the same regardless of the treatment
followed (cCBT or usual care)
11http://mafeip.eu
info@mafeip.eu
3. Model output
The figure below shows the incremental costs by age, which are positive. This means that the
intervention is more expensive than usual care. The incremental effects by age are also positive,
due to the fact that MasterMind increased participants’ satisfaction with life (Figure 3). In
consequence, the incremental cost‐effectiveness ratio (ICER)27 is placed in the upper‐right
quadrant (Figure 4). Thus, the cost‐effectiveness of the service depends on willingness to pay.
Concretely, the cCBT implemented during MasterMind is cost‐effective if willingness to pay is at
least 9,900€ per Quality‐adjusted life year (QALY)28. The cost‐effectiveness of the intervention
improves when societal costs are taking into account.
Figure 2. Incremental cost by age
Figure 3. Incremental effects by age
27 This is the ratio between incremental costs and incremental effects.
28 https://www.nice.org.uk/glossary?letter=q
12http://mafeip.eu
info@mafeip.eu
Figure 4. Cost‐effectiveness plane (healthcare costs)
The following figures show the cumulative costs and effects. The population is 25,105, the
estimation of the number of people assigned to BSA who suffer from depression. Looking at the
discounted values29, we observe that the lines become practically flat around the year 40 after
the start of the intervention, implying that the services would not produce further costs neither
effects.
Figure 5. Cumulative incremental costs
29 The discount rate is 3% for both costs and effects.
13http://mafeip.eu
info@mafeip.eu
Figure 6. Cumulative incremental effects
The following figures display the expected transition between states for one specific person (in
this case a 20 years old female). In intervention, the patient has higher probability of staying in
the baseline state, since the recovery rate is larger (the incidence and mortality rates are the
same). Moreover, since the incidence is very low (3%) and in the MAFEIP tool all the population
start at the baseline health state, the patient has a low probability of staying in the deteriorate
state during her lifetime, both in intervention and in usual care.
Figure 7. Patient flow through model states (Alive states)
Figure 8. Patient flow through model states (Dead state)
The sensitivity analysis allows us to assess how the output varies when one parameter changes.
First, as explained above we apply the range of recovery rates for the control group found in the
literature (23‐42%). We can see that for a willingness to pay of €15K/QALY, the service would be
considered cost‐effective or not depending on the recovery rate. For example, if the recovery
rate of the control group is 42% (red square) the intervention would not be considered be cost‐
14http://mafeip.eu
info@mafeip.eu
effective. On the other hand, the cost‐effectiveness of the intervention greatly changes with a
±10% variation in the baseline health utility for those in intervention (Figure 10).
Figure 9. Univariate sensitivity analysis with a change in the recovery rate for the control
group
Figure 10. Univariate sensitivity analysis with a change in the baseline health utility for the
intervention group
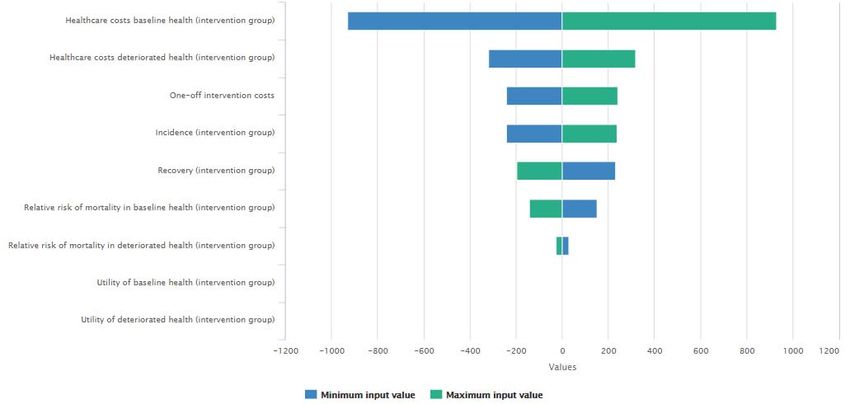
The figures below show how a change in several parameters affect the incremental costs (Figure
11) and the incremental effects (Figure 12), when applying a ±10% change in each parameter.
The baseline healthcare costs in intervention are the ones that have a greater impact on costs,
while the utility in baseline (where the population spends a larger amount of time) is clearly the
item that changes more the effects.
15http://mafeip.eu
info@mafeip.eu
Figure 11. Parameter impact on incremental costs
Figure 12. Parameter impact on incremental effects
16http://mafeip.eu
info@mafeip.eu
4. Lessons learned
This section summarises the main difficulties we have encountered in adapting the intervention
performed in MasterMind to the Markov model used in MAFEIP. These difficulties are detailed
below:
In the intervention all participants started with the health condition (depression), since
its aim was to achieve recovery more than to reduce incidence. However, in the current
version of the tool, all the population starts the simulation by default in the baseline
health state. As a result, in the simulation patients spend many periods in the baseline,
possibly underestimating the prevalence of depression.
The section on intervention costs does not differentiate between states, but the target
of MasterMind are the individuals with depressive symptoms. Thus, these costs should
only be counted in the deteriorated state. In order to address this, we added the
recurring intervention costs under healthcare costs (which are also expressed in terms of
costs per year and person, but allow to distinguish between states). We also added them
to the one‐off costs, because all participants in MasterMind start with depression
symptoms, implying that they receive the treatment in the first cycle.
The MAFEIP tool estimates the incremental health and economic outcomes of an
intervention compared with the standard care. The study design in MasterMind did not
include a control group. We addressed this issue by looking at similar interventions in the
scientific literature.
Since in the intervention all patients started in the deteriorated state it was not possible
to obtain the probability of moving from the baseline to the deteriorated state
(incidence) from the pilot’s results. Therefore, we used the same value than for the
control group, the one obtained from the scientific literature. It makes sense that the
incidence rate is the same for both groups, since the intervention focuses on the recovery
of those that already have the condition.
It would be useful to have more guidelines on how to convert different variables to utility,
since not all projects use the EQ‐5D. For example, in this case we used the variable
satisfaction with life in a 7‐point Likert scale, which was latter mapped into the 0‐1 range.
These lessons learned can be applied for the further development of the MAFEIP tool.
17You can also read