Evaluation of the Current Handling Fees Paid to Certified Redemption Centers
←
→
Page content transcription
If your browser does not render page correctly, please read the page content below

Evaluation of the
Current Handling Fees Paid to
Certified Redemption Centers
April 6, 2021
Purchase Order #00263233

Submitted to:
Michael Burke
Hawaii Department of Health
2827 Waimano Home Road
Pearl City, HI 96782

Submitted by:
Wendy Pratt, Managing Director
Crowe LLP
400 Capitol Mall, Suite 1400
Sacramento, California 95814-4434
Direct 916.492.5173
Tel    916.441.1000
Fax    916.441.1110
Wendy.Pratt@crowe.com
Crowe LLP
                                                                                    Independent Member Crowe Global

                                                                                    400 Capitol Mall, Suite 1400
                                                                                    Sacramento, California 95814-4434
                                                                                    Tel 916.441.1000
                                                                                    Fax 916.441.1110
                                                                                    www.crowe.com

April 6, 2021

Michael Burke, Solid Waste Coordinator
Hawaii Department of Health
2827 Waimano Home Road
Pearl City, HI 96782

Dear Mr. Burke:

Crowe LLP (Crowe) is pleased to provide the enclosed Evaluation of the Handling Fees Paid to Certified
Redemption Centers Report. This report provides our recommended statewide per container handling fees for
aluminum, bi-metal, glass, and plastic (combined PET #1 and HDPE #2) beverage containers effective Fiscal
Year 2022 (July 1, 2021). This report also provides an analysis of the fiscal impact of the recommended
handling fees on the Deposit Beverage Container (DBC) Special Fund through Fiscal Year 2025 (FY25).
Crowe’s evaluation of the current handling fees paid to CRCs indicates that the DOH should implement
new handling fees effective FY22. Crowe’s handling fee recommendations represent an increase in per
container statewide rates across all container types, as follows:
•   Aluminum/bi-metal per container handling fee increase from 3.3-cents per container to 3.4-cents
•   Glass per container handling fee increase from 7.8-cents per container to 8.1-cents
•   Plastics (PET #1 and HPDE #2 combined) per container handling fee increase from 3.9- cents to 4.0-cents.

Using FY20 redemption data, the CRCs would receive approximately 2.8 percent ($700 thousand) more
in handling fees payments with the recommended handling fees. Individual CRC companies would see an
increase in handling fee payments of between 3 percent and 4 percent. Further, our fiscal impacts
analysis results indicate the DBC Special Fund can support our recommended handling fees effective
with the existing 1-cent non-refundable container fee through FY25.
Over the course of the last several months, Crowe worked collaboratively with the DOH team to obtain
necessary documentation and program data to perform this evaluation of handling fees paid to CRCs.
We greatly appreciate the DOH team’s responsiveness and diligence to provide us with the proper
information to successfully perform this evaluation.

Sincerely,

Wendy Pratt, Managing Director
Crowe LLP
400 Capitol Mall, Suite 1400
Sacramento, California 95814-4434
Direct 916.492.5173
Tel    916.441.1000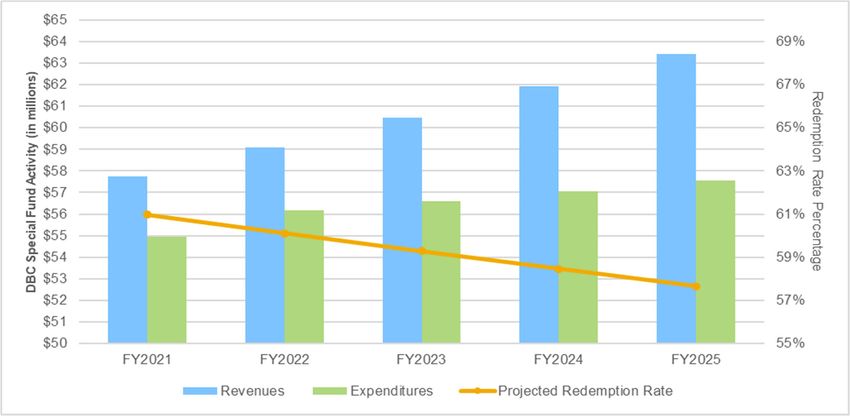
Evaluation of the Current Handling Fees Paid to Certified Redemption Centers                                                                                              i

Table of Contents

1. Introduction .................................................................................................................................... 1-1
   A. Purpose of the Evaluation of Current Handling Fees ................................................................. 1-1
   B. Overall Approach to the Evaluation of Current Handling Fees .................................................. 1-2
   C. Summary of Handling Fee Evaluation Results and Recommendations..................................... 1-2

2. Methodology................................................................................................................................... 2-1
   A. Overview of the Handling Fee Adjustment Model ...................................................................... 2-1
   B. Overview of Fiscal Impacts Analysis and Assumptions ............................................................. 2-4

3. Recommended Handling Fees ..................................................................................................... 3-1
   A. Explanation of Recommended Handling Fees ........................................................................... 3-1
   B. Comparison to Current Handling Fee Payments........................................................................ 3-4
   C. Justification for Recommended Handling Fees .......................................................................... 3-5

4. Fiscal Impacts Analysis ................................................................................................................ 4-1
   A. Overview of Results .................................................................................................................... 4-1
   B. Baseline Results ......................................................................................................................... 4-4
   C. Economic Downturn (Moderate) Results.................................................................................... 4-5
   D. Economic Growth Results .......................................................................................................... 4-6
   E. Economic Downturn (Aggressive) Results ................................................................................. 4-7
   F. Uncertainty and Unknowns......................................................................................................... 4-8
   G. Summary and Implications ......................................................................................................... 4-9

Appendix A: Adjustment Indicators ................................................................................................. A-1

CROWE GLOBAL NETWORK – Crowe LLP and its subsidiaries are independent members of Crowe Global, a Swiss organization. “Crowe” is the brand used by the Crowe
Global network and its member firms, but it is not a worldwide partnership. Crowe Global and each of its members are separate and independent legal entities and do not obligate
each other. Crowe LLP and its subsidiaries are not responsible or liable for any acts or omissions of Crowe Global or any other Crowe Global members, and Crowe LLP and its
subsidiaries specifically disclaim any and all responsibility or liability for acts or omissions of Crowe Global or any other Crowe Global member. Crowe Global does not render any
professional services and does not have an ownership or partnership interest in Crowe LLP or any other member. Crowe Global and its other members are not responsible or
liable for any acts or omissions of Crowe LLP and its subsidiaries and specifically disclaim any and all responsibility or liability for acts or omissions of Crowe LLP and its
subsidiaries. Visit www.crowe.com/disclosure for more information about Crowe LLP, its subsidiaries, and Crowe Global.
ii            Table of Contents                                           Hawaii Department of Health

                                  [This page intentionally left blank.]

     © 2021 Crowe LLP                                                           www.crowe.com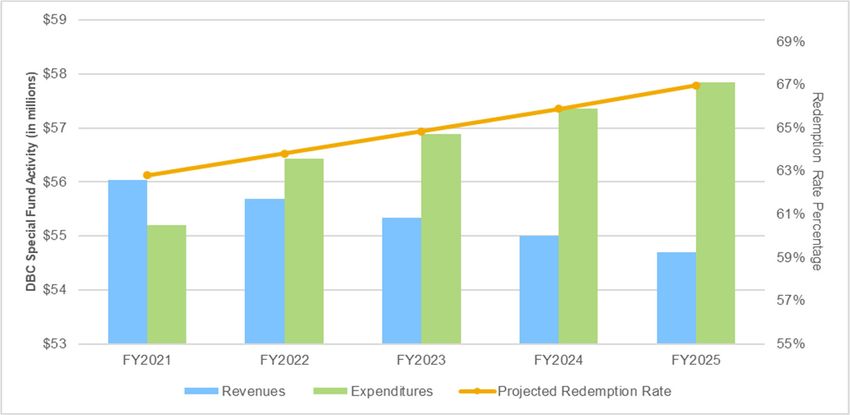
Section 1
Introduction
Evaluation of the Current Handling Fees Paid to Certified Redemption Centers                                                 1-1

1. Introduction
This proposed evaluation of current handling fees paid to Certified Redemption Centers (CRCs) will
determine whether handling fee payments should be adjusted in Fiscal Year 2022 (FY22) or remain the
same. The recommended handling fee adjustments, by material type, will be based on results within the
Handling Fee Adjustment Model (Model), a Microsoft Excel-based tool developed by the DOH in coordination
with Crowe LLP (Crowe). The result of this evaluation will be a critical element supporting the daily
operations and financial status of the CRCs and the Program. The evaluation results are fundamental to
support recycling in the state and to the financial viability of the Program.
The remainder of this section is organized as follows:
         A. Purpose of the Evaluation of Current Handling Fees
         B. Overall Approach to the Evaluation of Current Handling Fees
         C. Summary of Handling Fee Evaluation Results and Recommendations.

A. Purpose of the Evaluation of Current Handling Fees
This evaluation will determine whether handling fee payments should be adjusted in Fiscal Year 2022 (FY22)
or remain the same. The recommended handling fee adjustments, by material type, will be based on results
within the Handling Fee Adjustment Model (Model)1, a Microsoft Excel-based tool developed by the DOH in
coordination with Crowe LLP (Crowe). The result of this evaluation will be a critical element supporting the
daily operations and financial status of the CRCs and the Program. The evaluation results are fundamental to
support recycling in the state and to the financial viability of the Program.

Recent Handling Fee Adjustment Results
In July 2019, the DOH implemented new FY20 handling fees for the first time since the DBC program’s
inception in 2005. The handling fees were based on a detailed cost survey performed by Crowe that
focused on CRCs’ FY16 and FY17 labor and operational costs. The DOH implemented the current FY21
per container handling fees on July 1, 2020. The current per container handling fees were based on
Crowe’s evaluation of handling fees paid to certified redemption centers (CRCs). Crowe utilized the Model
to perform the evaluation and to determine recommended handling fees effective FY21, which resulted in
an increase of approximately 11 to 12 percent for each DBC material type. Exhibit 1-1 provides FY21
(current) handling fees resulting from the adjustment to FY20 handling fees.

Exhibit 1-1
Handling Fees Paid per Deposit Beverage Container (FY20 and FY21)
                                   FY20 Per Container                                                      FY21 Per Container
    DBC Material Type                                                      Adjustment
                                     Handling Fee                                                            Handing Fee

    Aluminum                               3 cents                          110.68%                                3.3 cents
    Glass                                  7 cents                          111.75%                                7.8 cents
    Plastic                                3.5 cents                        110.69%                                3.9 cents
    Bi-metal                               3 cents                          110.68%                                3.3 cents

1
    As part of the first study of DBC handling fees, Crowe developed the Handling Fee Adjustment Model (Model) to provide the DOH with
    a defensible framework for adjusting handling fees paid to CRCs in future years without performing a comprehensive cost study.

    © 2021 Crowe LLP                                                                                    www.crowe.com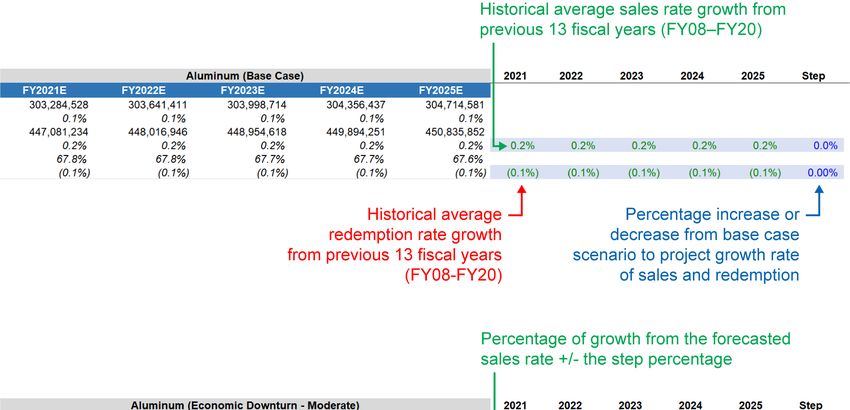
1-2          Introduction                                                               Hawaii Department of Health

In December 2020, the DOH selected Crowe to perform this evaluation of current handling fees paid to
CRCs in order to provide a justifiable recommendation for potential new handling fees effective FY22. A key
component of this evaluation is the fiscal impacts analysis of the recommended handling fees on the DBC
Special Fund through FY25. The results of the fiscal impacts analysis provide a forward-looking approach to
informing the final recommended handling fees and potential policy or program recommendations that may
be necessary as a result of implementing the potential new handling fees in FY22.

B. Overall Approach to the Evaluation of Current Handling Fees
Crowe’s evaluation of current handling fees paid to CRCs builds off of the five tasks identified in the RFQ.
Exhibit 1-2 summarizes the key tasks Crowe performed as part of this evaluation.

Exhibit 1-2
Evaluation of Current Handling Fees Paid to CRCs – Key Tasks
    Evaluation of Current Handling Fees Paid to Certified Redemption Centers – Contractor Tasks

    1. Conduct an Evaluation of the Current (FY 21) Handling Fees Paid – conduct a detailed evaluation of current
       (FY21: July 1, 2020 to June 30, 2021) handling fees paid to CRCs by utilizing the Handling Fee Adjustment
       Model developed by Crowe.

    2. Determine if an Adjustment to the Current Handling Fees is Needed – based on the results of Task 1,
       determine whether handing fees for FY22 (July 1, 2021 to June 30, 2022) should remain at the same level or be
       adjusted (decreased or increased).

    3. Recommend New Handling Fees (if applicable) – based on the results of Task 2, recommend new handling
       fees, by material type, for the DOH to implement in FY22; provide justification for new handling fees, by material
       type, or a justification for not adjusting the handling fees.

    4. Conduct a Fiscal Impact Analysis of the Proposed (Recommended) Handling Fees on the DBC Special
       Fund – conduct a detailed fiscal analysis to evaluate whether the DBC Special Fund could support the proposed
       FY22 handling fee recommendations through FY25.

    5. Prepare Draft and Final Reports – Prepare draft and final reports describing work performed under Tasks 1
       through 4; present methodology and results to the Office of Solid Waste Management (OSWM), Administrative
       Staff from the Department of Health, and public hearings, if needed.

In Section 2, Methodology, we describe each of these tasks in detail within context of the Adjustment
Model and the fiscal analysis component of this evaluation.

C. Summary of Handling Fee Recommendations
Crowe’s evaluation of the current handling fees paid to CRCs indicates that the DOH should implement
new handling fees effective FY22, July 1, 2021. Crowe’s handling fee recommendations represent an
increase in per container statewide rates across all container types, as follows:
•      Aluminum/bi-metal per container handling fee increase from 3.3-cents per container to 3.4-cents
•      Glass per container handling fee increase from 7.8-cents per container to 8.1-cents
•      Plastics (PET #1 and HPDE #2 combined) per container handling fee increase from 3.9-cents to
       4.0-cents.

Using FY20 redemption data, the CRCs would receive approximately 3 percent ($700 thousand) more in
handling fees payments with the recommended handling fees. Individual CRC companies would see an
increase in handling fee payments between 3 and 4 percent.

    © 2021 Crowe LLP                                                                              www.crowe.com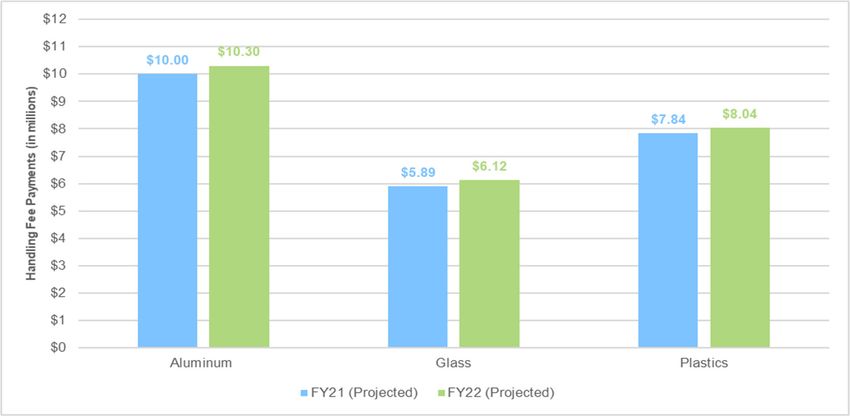
Evaluation of the Current Handling Fees Paid to Certified Redemption Centers                       1-3

Exhibit 1-3 provides a comparison of the current and recommended statewide per container handling fee
rates by DBC material type. The “current handling fee” column provides the current per container
statewide handling fees. The “adjustment” column provides the results from the overall adjustments to
CRCs’ weighted recycling costs resulting from the Adjustment Model (e.g. – for aluminum, CRCs’ costs
increased by 3.36 percent). The “recommended handling fee” column represents the results of the “current
handling fee” multiplied by the “adjustment”.

Exhibit 1-3
Comparison of Recommended and Current per Container Handling Fees by DBC Material Type
 DBC Material Type      Current Handling Fee          Adjustment           Recommended Handling Fee

 Aluminum                     $0.033                   103.36%                     $    0.034
 Glass                        $0.078                   103.93%                     $    0.081
 Plastic                      $0.039                   103.31%                     $    0.040
 Bi-Metal                     $0.033                   103.36%                     $    0.034

In Section 3, Recommended Handling Fees, we provide detailed rationale, including an explanation and
justification, for our recommended handling fees in Exhibit 1-3. In Section 4, Fiscal Impacts Analysis, we
provide the results of the fiscal impact of the recommended handling fees on the DBC Special Fund
through FY25. The report concludes with a summary and discussion of the implications of this evaluation.

 © 2021 Crowe LLP                                                                 www.crowe.com
1-4       Introduction                                           Hawaii Department of Health

                         [This page intentionally left blank.]

 © 2021 Crowe LLP                                                      www.crowe.com
Section 2
Methodology
Evaluation of the Current Handling Fees Paid to Certified Redemption Centers                              2-1

2. Methodology
This section describes Crowe’s overall methodology to evaluate the current handling fees paid to Certified
Redemption Centers (CRCs). The first subsection provides an overview of the Handling Fee Adjustment
Model (Adjustment Model), which Crowe utilized to evaluate current handling fees paid to CRCs and to
determine recommended handling fees effective Fiscal Year 2022 (FY22). The second subsection
describes Crowe’s approach to evaluating the fiscal impacts of the recommended handling fees on the
Deposit Beverage Container (DBC) Special Fund through Fiscal Year 2025 (FY25).
This section is organized as follows:
     A. Overview of the Handling Fee Adjustment Model
     B. Overview of Fiscal Impacts Analysis and Assumptions.

A. Overview of the Handling Fee Adjustment Model
The Adjustment Model is a Microsoft Excel-based tool that provides a defensible framework to regularly
evaluate and adjust DBC statewide handling fees by material type. In coordination with the Department of
Health (DOH), Crowe developed the Adjustment Model to annually review key economic indicators
representing Certified Recycling Center (CRC) cost categories (i.e. labor, indirect labor, on/intra/off island
transportation, etc.) and to determine if those indicators have changed significantly enough to warrant an
upward adjustment in handling fees. There are six potential adjustment factors in the model:

•       Wage index adjustment                              •     Health Care adjustment
•       Minimum wage adjustment                            •     Shipping adjustment
•       Cost of living adjustment (COLA)                   •     Fuel adjustment.

Except for the shipping adjustment, all of the indices are available on government web pages. We provide
a summary of the descriptions and sources of the adjustment factors in Appendix A.
In order to determine a potential shipping adjustment, Crowe prepared a short on-line survey for CRCs.
The DOH distributed the shipping survey to ten CRCs that ship materials off-island. The CRCs responded
with quarterly shipping invoices for glass shipments, which Crowe then utilized as support to calculate an
adjustment factor representative of increases to off-island shipping for all DBC materials.
The Model determines which, if any, indices to apply to the appropriate percentage of the current handling fee.
For example, 42 percent of the 3.33-cent aluminum handling fee supports direct labor (1.4 cents per container).
The wage index increased 5.3 percent in 2020, so the Model applied that 5.3 percent increase to 3.4 cents,
resulting in a new labor cost per container of 1.5 cents.
The Model takes the highest relevant adjustment factor for each cost component to apply to the relevant
portion of costs specific to each of the three major material types. Exhibit 2-1 summarizes the cost factors
and components they apply to within the Model. If any adjustment factors are greater than the COLA, the
model will apply them to the relevant cost component. The default adjustment is the Urban Hawaii COLA.

Exhibit 2-1
Adjustment Factors for Recycling Cost Components
           Recycling Cost Component                    Applicable Adjustment

    Direct Labor                           Wage Index, Minimum Wage, or COLA
    Indirect Labor                         COLA or Health Care
    Off-Island Transportation              COLA, Shipping, or Fuel
    Inter- and On-Island Transportation    COLA or Fuel
    All Other Costs                        COLA

    © 2021 Crowe LLP                                                                      www.crowe.com
2-2 Methodology Hawaii Department of Health Once all the relevant adjustment factors have been entered into the Model, the Model calculates the potential increases to handling fees for each material type. Handling Fee Adjustment Model Components The Adjustment Model contains six key components: 1) Introduction, 2) Summary, 3) Adjustment Indicators, 4) Shipping Survey Results, 5) CRC Handling Fee Payments, and 6) DBC Special Fund Coverage. These components provide a defensible documentation package to support Crowe’s recommended handing fee adjustments. Below is a brief description of each component within the Model. 1. Introduction – The Introduction outlines the steps involved in preparing and approving potential changes to the DBC Program’s handling fees; the Introduction also provides a high-level guide for the DOH to obtain the adjustment indicators, enter the adjustment indicators in to the Model, and then review the handling fee adjustments for approval and implementation. 2. Summary – The Summary provides an overview of the handling fee adjustment results, including the adjusted recycling costs by DBC material type, and the key adjustment factors utilized to inform the results. 3. Adjustment Indicators – The Adjustment Indicators provides the DOH with a form to obtain and then enter the adjustment indicator data from the identified sources in to the Model; the Adjustment Indicator form automatically calculates the “Adjustment Factor,” which informs the adjusted recycling costs by DBC material type. 4. Shipping Survey Results – The Shipping Survey Results provides the DOH with a form to enter shipping survey responses, which serve as the basis for developing an updated shipping adjustment indicator based on the average shipping cost per glass shipping container. This year, Crowe sent out a survey to the 11 recyclers participating in the program to collect FY20 and year-to-date FY21 glass shipping costs by quarter. The average of FY21 shipping costs was used as the shipping adjustment factor. The FY21 shipping cost average is indicative of whether shipping costs are on an upward or downward trend for the remainder of the year. 5. CRC Handling Fee Payments – The CRC Handling Fee Payments provides the DOH with a form to determine the recommended percent change in handing fee payments based on the handling fee adjustment results. Crowe provided estimated FY21 Handling Fee Payments by recycler as well as Recommended FY22 Handling Fee Payments by recycler within this tab. 6. DBC Special Fund Coverage – The DBC Special Fund Coverage provides the DOH with a fund projection model indicating the ending balance based on the projected handling fee payment results; this provides the DOH with assurance that the DBC Special Fund has the necessary funds on hand to cover the adjusted handling fee payments. Handling Fee Adjustment Calculations The Adjustment Model automatically calculates handling fee adjustments based on key inputs within the Adjustment Indicators form. These indicators provide a basis to adjust the weighted costs of recycling, which inform the change in handling fee rates by DBC material type (aluminum/bi-metal, glass, and plastic). As mentioned, the model considers six (6) adjustment indicators. A link to the source for each indicator is located on the Adjustment Indicators tab. In Exhibit 2-2, we provide a snapshot of the Adjustment Indicators form within the Adjustment Model. In the “Updated Indicator(s)” column, Crowe entered updated data for each of the adjustment indicators. The form then calculates an “adjustment factor,” which reflects the change, in percentage, from the base indicator. The “adjustment factor” is then applied to the current handling fee rate to calculate an adjusted rate. © 2021 Crowe LLP www.crowe.com
Evaluation of the Current Handling Fees Paid to Certified Redemption Centers                   2-3

Exhibit 2-2
Handling Fee Adjustment Indicators Form

 © 2021 Crowe LLP                                                              www.crowe.com
2-4        Methodology                                                     Hawaii Department of Health

B. Overview of Fiscal Impacts Analysis and Assumptions
Crowe updated two Microsoft Excel-based models developed during the first study of DBC handling fees
to evaluate the impact of the recommended handling fees resulting from this evaluation on the DBC
Special Fund through FY25. Both models provided a framework to determine if the DBC Special Fund
could cover its liabilities with the recommended handling fees under three varying scenarios: baseline,
economic downturn, and economic growth. To illustrate the short term fiscal impact of the COVID-19
pandemic, we also developed an aggressive economic downturn scenario to forecast the DBC Special
Fund’s condition should economic downturn conditions continue based on FY21 estimated sales and
redemption rates through FY25. In the remainder of this section, we provide details about the assumptions
used in each model and the basis for our aggressive downturn scenario.

1.    Sales and Redemption Rate Projection Model
Crowe developed the sales and redemption model to demonstrate varying statewide beverage container
sales and redemption rates under different economic conditions through FY25. Using historical DBC data
provided by the DOH along with beverage container market data, we made projection assumptions within
the model to increase and decrease sales (number of containers) and redemption rates. To perform these
projections, Crowe developed four (4) scenarios based on varying assumptions on the status of the
economy, recycling, and beverage markets over the next four fiscal years. Each scenario assumes
different sales and redemption rates in order to demonstrate potential fiscal impacts to the DBC Special
Fund in a “status quo” economy, downturn economy, growth economy, and an aggressive downturn
economy.
It is important to note that the baseline, economic downturn, and economic upturn scenarios are based on
historical beverage container sales and redemption rates. Whereas, the aggressive economic downturn
scenario projects future sales and redemption rates using FY21 estimated sales and redemption data.

Baseline Scenario
The baseline scenario represents a “status quo” economy and is based on a 13 fiscal year historical
average (i.e., from FY08 to FY20) of statewide beverage container sales and redemption rates. It is
important to note that our model does not adjust bi-metal sales or redemption rates because bi-metal
makes up such a small share of beverage containers sold and redeemed. Exhibit 2-3 summarizes
projected beverage container sales and redemption rates for each DBC material within the baseline
scenario.

Exhibit 2-5
Sales and Redemption Assumption – Baseline Scenario
 DBC                Baseline % Change   Baseline % Change
 Material Type           in Sales       in Redemption Rate

 Aluminum                 0.2%                -0.1%
 Glass                   -3.4%                -1.4%
 Plastic                  1.7%                -0.3%

Economic Downturn (Moderate) Scenario
The economic downturn scenario projects for a slight decrease in beverage container sales and an
increase in redemption rates due to the likely impacts of a downturn in the overall economy, such as
increased unemployment and a decrease in household incomes. In this scenario, we decreased sales
growth from the baseline scenario by 1 percent and increased redemption rates from the baseline scenario
by 2 percent. Exhibit 2-4 summarizes percent changes in sales and redemption rate for the economic
downturn scenario in comparison to the baseline scenario.

 © 2021 Crowe LLP                                                                www.crowe.com
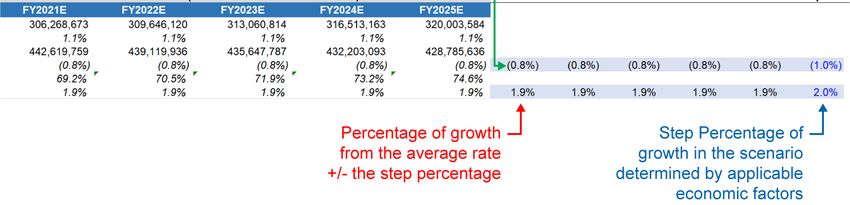
Evaluation of the Current Handling Fees Paid to Certified Redemption Centers                                    2-5

Exhibit 2-3
Comparison between Baseline and Economic Downturn Scenarios
Sales and Redemption Assumptions
 DBC                  Baseline %      Economic Downturn %          Baseline %              Economic Downturn %
 Material Type      Change in Sales      Change in Sales    Change in Redemption Rate    Change in Redemption Rate

 Aluminum                0.2%               -0.8%                    -0.1%                              1.9%
 Glass                  -3.4%               -4.4%                    -1.4%                              0.6%
 Plastic                 1.7%                0.7%                    -0.3%                              1.7%

Economic Growth Scenario
The economic upturn scenario projects for an increase in beverage container sales and a decrease in
redemption rates due to the likely impacts of an upturn in the overall economy, such as a decrease in
unemployment and an increase in household income. In this scenario, we increased sales growth from the
baseline scenario by 2 percent and decreased redemption rates from the baseline scenario by 1 percent.
Exhibit 2-5 summarizes percent changes in sales and redemption rate for the economic growth scenario
in comparison to the baseline scenario.

Exhibit 2-4
Comparison between Baseline and Economic Growth Scenarios
Sales and Redemption Assumptions
 DBC                  Baseline %       Economic Upturn %           Baseline %               Economic Upturn %
 Material Type      Change in Sales     Change in Sales     Change in Redemption Rate    Change in Redemption Rate

 Aluminum                0.2%                2.2%                    -0.1%                              -1.1%
 Glass                  -3.4%               -1.4%                    -1.4%                              -2.4%
 Plastic                 1.7%                3.7%                    -0.3%                              -1.3%

Economic Downturn (Aggressive) Scenario
Crowe developed a fourth scenario to project the DBC Special Fund’s condition should economic
downturn trends continue through FY25. The DOH provided Crowe with estimated FY21 beverage
container sales data through December 2020 and estimated FY21 beverage container redemption data
through February 2021. Crowe averaged monthly sales data from July 2020 to December 2020 to project
sales for the remainder of FY21 (i.e., from January to June) and average monthly redemption data from
July 2020 to February 2021 to project containers redeemed for the remainder of FY21 (i.e., from March to
June). In FY22 through FY25, we then project a 1 percent decrease in beverage container sales each year
and a 2 percent increase in redemption each year (this is consistent with the moderate economic downturn
scenario) based on estimated FY21 beverage container sales and redemption rates.

Exhibit 2-6 provides a snapshot of the sales and projection model under the baseline scenario. The color
green represents the historical average sales growth (from FY08 to FY21), red is the historical average of
the redemption growth rate (from FY08 to FY21), and blue represents the step percentage that influences
how much sales and redemption rate increase. One can change the step percentages to reflect different
scenarios to represent shifting future sales and redemption rates.

 © 2021 Crowe LLP                                                                       www.crowe.com
2-6 Methodology Hawaii Department of Health
Exhibit 2-5
Projection Model Baseline Scenario Example
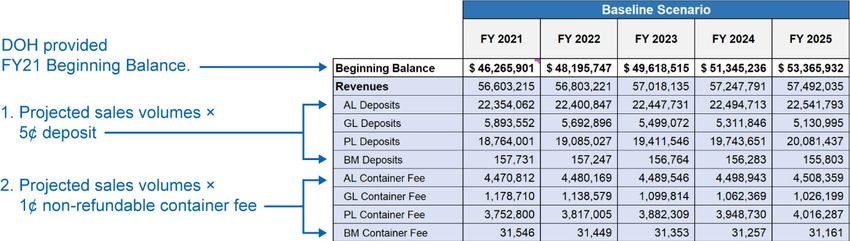
2. Fiscal Impacts Model
The fiscal impacts model projects the DBC Special Fund’s revenues, expenditures, and beginning and ending
balances through FY25. We utilized projected beverage container sales and redemption volumes developed
in the sales and redemption projection model to project anticipated revenues and expenditures with the
recommended handling fees. We used the following key factors to project annual revenue and expenditures:
• Revenues
o Annual beverage container sales projections
o 5 cent beverage container deposit by material type
o 1 cent container fee by material type
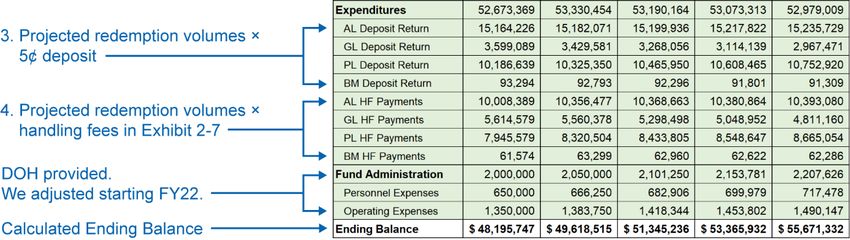
• Expenditures
o Annual beverage container redemption projections
o 5 cent beverage container deposit return by material type
o Current and recommended handling fee payments by material type
o DBC program’s administrative expenses
Exhibit 2-7 provides the current handling fees utilized to project expenditures in FY21 and the recommended
handling fees used to project expenditures in FY22 through FY25.
© 2021 Crowe LLP www.crowe.comEvaluation of the Current Handling Fees Paid to Certified Redemption Centers 2-7 Exhibit 2-6 Current and Recommended per Container Handling Fees DBC Material Type Current HF Recommended HF Aluminum 3.3 cents 3.4 cents Glass 7.8 cents 8.1 cents Plastic 3.9 cents 4.0 cents Bi-Metal 3.3 cents 3.4 cents DBC Program Budget The DOH provided the DBC Program’s FY20 and FY21 budget data, which included personnel and operational costs. utilized personnel expenditures of approximately $2M in FY21, representing estimated program administration and personnel expenditures. Exhibit 2-8 illustrates how we incorporated the different factors into the fiscal impact model. Exhibit 2-7 Example Fiscal Impact Model for Baseline Scenario © 2021 Crowe LLP www.crowe.com
2-8       Methodology                                           Hawaii Department of Health

                        [This page intentionally left blank.]

 © 2021 Crowe LLP                                                     www.crowe.com
Section 3 Recommended Handling Fees
Evaluation of the Current Handling Fees Paid to Certified Redemption Centers                        3-1

3. Recommended Handling Fees
Crowe’s evaluation of the current handling fees paid to Certified Redemption Centers (CRCs) indicates the
Department of Health (DOH) should implement new per container statewide handling fees effective July 1,
2021, Fiscal Year 2022 (FY22). Crowe utilized the Handling Fee Adjustment Model (Adjustment Model)
described in Section 2 to evaluate current handling fees paid to CRCs and to determine recommended
handling fees effective FY22. This section is organized as follows:
      A. Explanation of Recommended Handling Fees
      B. Comparison to Current Handling Fee Payments
      C. Justification for Recommended Handling Fees.

A. Explanation of Recommended Handling Fees
Crowe’s recommended handling fees are based on adjustments to CRCs’ weighted recycling costs
for each DBC material type: aluminum/bi-metal, glass, and combined plastics (PET #1 and HDPE #2).
It is important to note that “base” recycling costs for each DBC material are based on FY16 and FY17
CRC costs, which Crowe obtained through the last study of the DBC Program’s handling fees. Our
recommended handling fees for each DBC material type are based on adjustments to these “base”
recycling costs. Crowe utilized the Adjustment Model to calculate adjustment factors derived from key
economic adjustment indicators, which provided a basis to quantify changes in CRCs’ weighted recycling
costs. Overall, CRCs’ weighted recycling costs increased for all DBC material types due to the following:
1. Increase to the wage index indicator of 5 percent due average weekly wages increasing between 2019
   and 2020. The increase in the wage index increased the direct labor adjustment for all material types.
2. Increase of approximately 6 percent to off-island shipping rates from FY19 to FY20, which increased
   off-island transportation costs for all materials; this increase in off-island shipping rates had the
   greatest impact on glass costs since approximately 24 percent of the material’s “base” cost is made
   up of off-island shipping
3. Minimal increase to other costs, inter and on-island transportation, and indirect labor from 2019 to
   2020 based on a 1.6 percent increase to cost of living adjustment.

Exhibit 3-1 provides a comparison of the recommended and current statewide per container handling fee
rates by DBC material type. The “current handling fee” column provides the per container statewide
handling fee results from Crowe’s initial cost survey based on FY20 CRC weighted recycling costs. The
“adjustment” column provides the results from the overall adjustments to CRCs’ weighted recycling costs
based on the economic adjustment indicators (i.e. – for aluminum, CRCs’ costs increased by 3.36
percent). The “recommended handling fee” column represents the results of the “current handling fee”
multiplied by the “adjustment”.

 © 2021 Crowe LLP                                                                  www.crowe.com
3-2 Recommended Handling Fees Hawaii Department of Health
Exhibit 3-1
Comparison of Recommended and Current per Container Handling Fees by DBC Material Type
DBC Material Type Current Handling Fee Adjustment Recommended Handling Fee
Aluminum $0.033 103.36% $0.034
Glass $0.078 103.93% $0.081
Plastic $0.039 103.31% $0.040
Bi-metal $0.033 103.36% $0.034
Exhibit 3-2 summarizes CRCs’ adjusted recycling costs for each DBC material type, which are based on
the key adjustment indicators described in Exhibit 3-3. Direct labor costs increased the most out of all of
the cost categories due to an increase in the wage index between 2019 and 2020. The increase to direct
labor costs reflects approximately 45 percent of the increase to CRCs’ costs to recycle aluminum/bi-metal
and plastic and approximately a third of the increase to CRCs costs to recycle glass. Overall transportation
costs (off/intra/on island transportation) increased for all DBC materials but had the biggest impact on
overall glass costs. Glass off-island transportation represent a third of the increase in the total adjustment
to glass costs.
In Exhibit 3-3, we provide a summary of the adjustment factors resulting from the annual change (in
percentage) for each of the key adjustment indicators. This summary also provides context and rationale
for each adjustment factor. We provide descriptions and sources for each of these adjustment indicators in
Appendix A.
Exhibit 3-2
Adjusted Recycling Costs by DBC Material Type
Aluminum / Bi-Metal Glass Plastic
Recycling Costs
Base Adjusted Base Adjusted Base Adjusted
Direct Labor 42.08% 44.33% 32.90% 34.66% 43.21% 45.52%
Indirect Labor 12.20% 12.39% 9.65% 9.80% 12.64% 12.84%
Off-Island Transportation 4.02% 4.28% 22.88% 24.36% 2.65% 2.82%
Intra & On Island Transportation 6.42% 6.52% 5.69% 5.78% 6.28% 6.38%
All Other Costs 35.28% 35.83% 28.88% 29.33% 35.20% 35.75%
Total Base / Total Adjusted 100.00% 103.36% 100.00% 103.93% 100.00% 103.31%
© 2021 Crowe LLP www.crowe.comEvaluation of the Current Handling Fees Paid to Certified Redemption Centers 3-3
Exhibit 3-3
Key Adjustment Indicators and Adjustment Rationale
Adjustment Indicators Adjustment Adjustment Rationale
Wage Index 5.3% • Average weekly wages in Hawaii from 2019 to 2020 increased by roughly 5
Source: Bureau of percent, resulting in an adjustment to CRC direct labor costs for all material
Labor Statistics types.
(BLS), Average • This indicator is higher than the minimum wage and was used to adjust
Weekly Wages in CRC direct labor costs.
Hawaii
Minimum Wage 0.0% • Recent legislation to increase minimum wage from $10.10 to $11 did not
Source: Minimum- pass; as a result, there is no change to the minimum wage factor. There are
wage.org/Hawaii current legislative efforts to increase the minimum wage to $13.00 per hour
by 2024.
• This indicator was lower than the wage index and was not used to adjust
CRC direct labor costs.
Cost of Living 1.6% • COLA increased 1.6% from 2019 to 2020; an annual increase of 2% is
Adjustment (COLA) typical.
Source: BLS, • This indicator was lower than the wage index and was not used to adjust
Consumer Price CRC direct labor costs.
Index (CPI) All Urban
Consumers Hawaii
Health Care -10.3% • Marketplace average benchmark premiums decreased from $497 in 2019
Source: Kaiser to $446 in 2020.
Family Foundation • Premiums were analyzed using the second-lowest cost silver (benchmark)
(KFF) premium for a 40-year-old in each county.
• Healthcare spending most likely went down because of orders issued at the
start of the pandemic that limited the services providers could deliver,
including high-profit elective surgeries and non-emergent care.
• Since health care costs decreased, Crowe utilized COLA to adjust indirect
labor costs.
Shipping 6.4% • Based on survey responses from 10 recyclers, glass shipping costs
Source: Crowe’s increased by 6 percent between 2019 and 2020.
Shipping Survey • Shipping costs increased across the county in 2020 due to an increase in
Results demand for transportation and freight services.
• Crowe utilized this adjustment to adjust for CRC off-island transportation
since it was higher than both COLA and fuel adjustments.
Fuel -16.5% • According to the U.S. Energy Information Administration, cost per gallon of
Source: U.S. Energy diesel on the West Coast (excluding California) decreased from $3.05 in
Information 2019 to $2.64 in 2020, a 16% decrease.
Administration • Fuel and diesel cost per gallon decreased from 2019 to 2020 due an
increase in global supply and a decrease in demand.
• Since fuel costs decreased, Crowe utilized the COLA adjustment to adjust
for intra and on-island transportation costs.
© 2021 Crowe LLP www.crowe.com3-4 Recommended Handling Fees Hawaii Department of Health B. Comparison to Current Handling Fee Payments As a first step in understanding the impact of the recommended handling fees paid to CRCs, we compared current handling fee payments to recommended handling fee payments using FY20 redemption data. In total, CRCs would receive between 3 to 4 percent ($700 thousand) more in handling fees payments with the recommended handling fees in Exhibit 3-1. In the next section of this report, we provide our fiscal impacts analysis of the recommended handling fee on the DBC fund under varying projections of beverage container sales and recycling over the next several years. Exhibit 3-4 illustrates the increase in handling fee payments by DBC material type from FY21 to FY22 based on FY20 redemption data. Aluminum and plastics (PET #1 and HDPE #2 combined) handling fee payments are projected to increase by approximately 3 percent from FY21 to FY22, whereas, glass handling fee payments are projected to increase approximately 4 percent from FY21 to FY22. Exhibit 3-4 Change in Handling Fee Payments by DBC Material Type (Based on FY20 Redemption Data) © 2021 Crowe LLP www.crowe.com
Evaluation of the Current Handling Fees Paid to Certified Redemption Centers                            3-5

C. Justification for Recommended Handling Fees
Without performing a comprehensive survey of CRCs’ costs similar to our first study of the DBC Program’s
handling fees, we relied on the Adjustment Model to evaluate and to determine our recommended
handling fees effective FY22, July 1, 2021. As mentioned throughout this report, the Adjustment Model,
including input from the shipping survey, provided a mechanism to estimate likely increases in CRCs’
costs to recycle DBC materials. This approach provided a justifiable means to recommend appropriate
handling fees reflective of these likely changes in CRC costs. We also found this method of adjusting
CRCs’ recycling costs to be further substantiated given that the status of the economy and recycling
landscape has not changed significantly since our last study of the DBC Program’s handling fees.

1.       Aluminum and Bi-Metal
CRCs’ overall aluminum and bi-metal costs increased by 3.36 percent, resulting in a tenth-cent increase to
the current per container handling fee rate for these materials. Our recommended adjustment to the
current handling fee rate for aluminum and bi-metal, from 3.3-cents to 3.4-cents per container, is based on
the 3 percent increase in CRCs’ costs to recycle these materials. Below is a breakdown and explanation of
the 3 percent increase in costs for aluminum and bi-metal:
•      Direct labor had the largest impact on CRCs’ aluminum and bi-metal overall costs with an increase of
       roughly 2 percent based on the wage index increasing 5.3 percent.
•      Off-island transportation had the second largest impact on after direct labor due to shipping costs
       increasing 6.4 percent.
•      Indirect labor inter and on-island transportation, and “All Other Costs” slightly increased due to COLA
       at 1.6 percent, but had the least impact on overall CRCs’ aluminum/bi-metal recycling costs.

2.       Glass
CRCs’ overall glass costs increased by 3.93 percent, resulting in a 0.3 cent increase to the current per
glass per container handling fee rate. Our recommended adjustment to the current handling fee rate for
glass, from 7.8-cents to 8.1 cents per container, is based on the 3.93 percent increase in CRCs’ costs to
recycle this material. Below is a breakdown and explanation of the 3.93 percent increase in glass costs:
•      Direct labor had the largest impact on CRCs’ glass overall costs with an increase of roughly 2 percent
       based on the wage index increasing 5.3 percent.
•      Off-island transportation had the second largest impact on after direct labor due to shipping costs
       increasing 6.4 percent.
•      Indirect labor, inter and on-island transportation, and “All Other Costs” slightly increased due to COLA
       at 1.6 percent, but had the least impact on overall CRCs’ glass recycling costs.

    © 2021 Crowe LLP                                                                  www.crowe.com
3-6 Recommended Handling Fees Hawaii Department of Health
3. Plastics (Combined PET #1 and HDPE #2)
CRCs’ overall plastics costs increased by 3.31 percent, resulting in an 0.1 cent increase to the current per
container handling fee rate for these materials. Our recommended adjustment to the current handling fee rate
for plastic, from 3.9-cents to 4.0-cents per container, is based on the 3.31 percent increase in CRCs’ costs to
recycle this material. Below is a breakdown and explanation of the 3.31 percent increase in plastic costs:
• Direct labor had the largest impact on CRCs’ plastic overall costs with an increase of roughly 2 percent
based on the wage index increasing 5.3 percent.
• Off-island transportation had the second largest impact on after direct labor due to shipping costs
increasing 6.4 percent.
• Indirect labor, inter and on-island transportation, and “All Other Costs” slightly increased due to COLA
at 1.6 percent, but had the least impact on overall CRCs’ plastic recycling costs.
© 2021 Crowe LLP www.crowe.comSection 4 Fiscal Impacts Analysis
Evaluation of the Current Handling Fees Paid to Certified Redemption Centers                          4-1

4. Fiscal Impacts Analysis
This section provides the results our fiscal impacts analysis through Fiscal Year 2025 (FY25). We based our
analysis on the methodology and scenarios described in Section 2. This section is organized as follows:
         A.   Overview of Results
         B.   Baseline Results
         C.   Economic Downturn (Moderate) Results
         D.   Economic Growth Results
         E.   Economic Downturn (Aggressive) Results
         F.   Uncertainty and Unknowns
         G.   Summary and Implications.

A. Overview of Results
Our fiscal impacts analysis results indicate the Deposit Beverage Container (DBC) Special Fund can
support our recommended handling fees effective July 1, 2021 (FY22) with the existing 1-cent non-
refundable container fee through FY25. The DBC Special Fund maintained a positive ending balance and
a fund coverage ratio of above 1.0 through FY25 in all scenarios, indicating the DOH would not need to
adjust the recommended handling fees or increase the non-refundable per container fee from 1-cent to
1.5-cent. Note that our analyses start with a FY21 beginning balance of roughly $46 million. Below we
provide highlights from our results:
•      The DBC Special Fund maintains an ending balance of approximately $45.5 million, an average ending
       balance across all scenarios, through FY25. This signifies the DBC Special Fund will maintain adequate
       coverage for its expenditures (deposit returns, handling fee payments, and fund administrative costs)
       through FY25 even under aggressive and moderate economic downturn conditions.
•      The DBC Special Fund maintains, on average, approximately 1.8x the amount needed to cover its
       expenditures through FY25.
•      In the baseline scenario, the DBC Special Fund’s revenues exceed expenditures through FY25 due to
       expenditures slightly decreasing and revenues increasing, even with the increase in per container
       handling fee for all DBC material types because overall redemption is projected to decrease
       approximately 0.2 percent year-over-year.
•      As expected, in both the aggressive and moderate economic downturn scenarios, the DBC Special
       Fund’s expenditures exceed revenues due to an increase in the projected redemption rate. In the
       aggressive economic downturn scenario, the DBC Special Fund’s ending balance is projected at $20.5
       million by FY25. In the moderate economic downturn scenario, the DBC Special Fund’s ending
       balance is projected at $39 million by FY25.
•      In both downturn scenarios, the DOH would not need to increase the non-refundable per container fee
       from 1-cent to 1.5-cents or adjust handling fee payments downward.
•      In the economic growth scenario, revenues exceed expenditures due to an increase in projected
       beverage container sales and a slight decrease in redemption rates.

We provide further details of our fiscal impacts analysis for each scenario and the implications to the DBC
Special Fund in the remainder of the report.

Exhibit 4-1 provides a summary comparison of projected DBC Special Fund ending balances by scenario
through FY25. The baseline and economic growth (scenario 2) show an increase in the DBC Special Fund
ending balance through FY25. The moderate economic downturn (scenario 1) and the aggressive economic
downturn scenario (scenario 3) show a decrease in the DBC Special Fund ending balance through FY25.

    © 2021 Crowe LLP                                                                 www.crowe.com
4-2 Fiscal Impacts Analysis Hawaii Department of Health
Exhibit 4-1
Comparison of Projected DBC Fund Ending Balances by Scenario
In Exhibit 4-2, we highlight in bold when the DBC Special Fund begins to utilize its excess funds due to
expenditures exceeding revenues. In the aggressive economic downturn scenario, the DBC Special Fund
will begin to utilize its excess funds in FY21. In the moderate economic downturn scenario, the DBC
Special Fund will begin to utilize its excess funds in FY22. The DBC Special Fund ending balance
increases in the baseline scenario and the economic growth scenario.
Exhibit 4-2
Comparison of Projected DBC Fund Ending Balances
Fiscal Year 2021 through 2025
Scenario FY21 FY22 FY23 FY24 FY25
1. Baseline $48,195,747 $49,618,515 $51,345,236 $53,365,932 $55,671,332
2. Economic Downturn
$47,114,256 $46,357,585 $44,813,548 $42,469,562 $39,312,641
(Moderate)
3. Economic Growth $49,043,698 $51,947,334 $55,825,442 $60,698,512 $66,588,720
4. Economic Downturn
$45,026,883 $41,458,432 $36,193,576 $29,214,280 $20,501,978
(Aggressive)
Average $47,345,146 $47,345,466 $47,044,450 $46,437,072 $45,518,668
Note: The bolded dollars indicate when DBC expenditures exceed revenues.
© 2021 Crowe LLP www.crowe.comEvaluation of the Current Handling Fees Paid to Certified Redemption Centers 4-3
Fund Coverage Ratio
The fund coverage ratio is a comparative metric to determine if the DBC Special Fund can cover its
expenditures under each scenario. The fund coverage ratio provides an assurance that the DBC Special
Fund has the necessary funds on hand to weather any short-term economic volatility. For example, if the
DBC Special Fund has a fund coverage ratio of 1.5, then this means the fund has 150 percent of the
necessary funds to cover its expenditures. Conversely, if the DBC Special Fund has a fund coverage
ratio of 0.9, then this means the fund has only 90 percent of the necessary funds to cover its expenditures.
The fund coverage ratio is calculated as follows:
Fund Beginning Balance + Revenues
Fund Coverage Ratio =
Expenditures
Exhibit 4-3 provides a summary comparison of the DBC Special Fund projected coverage ratio under
each scenario. If the fund coverage ratio is above 1.0, then this signifies the DBC Special Fund can cover
its expenditures. If the fund coverage ratio is below 1.0, then this signifies the DBC special Fund cannot
cover its expenditures.
In all scenarios, the DBC Special Fund coverage ratio is above the 1.0 threshold through FY25. This
indicates the DBC Special Fund has more than 100 percent of the necessary funds to cover its
expenditures even under “stressed” conditions through FY25. In the event that the DBC Special Fund’s
coverage ratio nears 1.0, the DOH should consider either increasing the existing 1-cent non-refundable
container fee or decreasing the handling fee payments.
Exhibit 4-3
Comparison of Projected DBC Fund Coverage Ratios
© 2021 Crowe LLP www.crowe.com4-4 Fiscal Impacts Analysis Hawaii Department of Health
B. Baseline Results
In the baseline scenario, the recommended handling fees implemented in FY22 would increase the DBC
Special Fund expenditures by approximately $700 thousand as compared to FY21. The baseline scenario
results indicate the DBC Special Fund will maintain adequate funds to cover the recommended handling
fees through FY25.
Exhibit 4-4 summarizes the DBC Special Fund projected revenue and expenditure activity through FY25.
The DBC Special Fund would continue to increase since revenues will increase more than expenditures
are predicted to. Exhibit 4-5 illustrates the DBC Special Fund projected revenue and expenditure activity
and corresponding projected redemption rates through FY25.
Exhibit 4-4
Projected DBC Fund Activity – Baseline Results
FY 2021 FY 2022 FY 2023 FY 2024 FY 2025
Beginning Balance $46,265,901 $48,195,747 $49,618,515 $51,345,236 $53,365,932
Revenues $56,603,215 $56,803,221 $57,018,135 $57,247,791 $57,492,035
Deposits 47,169,346 47,336,018 47,515,113 47,706,493 47,910,029
Container Fees 9,433,869 9,467,204 9,503,023 9,541,299 9,582,006
Expenditures $54,673,369 $55,380,454 $55,291,414 $55,227,095 $55,186,635
Deposit Returns 29,043,248 29,029,795 29,026,238 29,032,227 29,047,429
HF Payments 23,630,121 24,300,658 24,163,926 24,041,086 23,931,580
Fund Administration 2,000,000 2,050,000 2,101,250 2,153,781 2,207,626
Net $1,929,846 $1,422,768 $1,726,721 $2,020,697 $2,305,400
Ending Balance $48,195,747 $49,618,515 $51,345,236 $53,365,932 $55,671,332
Exhibit 4-5
Projected DBC Fund Activity and Redemption Rates – Baseline Results
© 2021 Crowe LLP www.crowe.comEvaluation of the Current Handling Fees Paid to Certified Redemption Centers 4-5
C. Economic Downturn (Moderate) Results
In the economic downturn (moderate) scenario, the recommended handling fees implemented in FY22
would increase the DBC Special Fund’s expenditures by approximately $1.2 million as compared to FY21.
The economic downturn (moderate) results indicate the DBC Special Fund will maintain adequate funds to
cover the recommended handling fees through FY25.
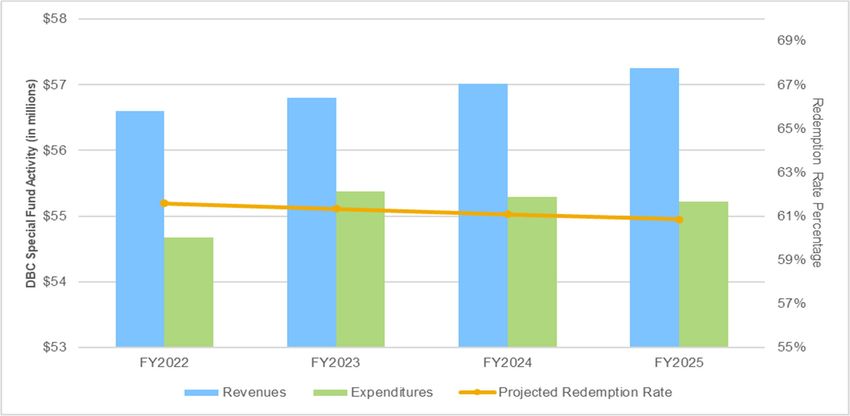
Exhibit 4-6 summarizes the DBC Special Fund projected revenue and expenditure activity through FY25
under the economic downturn scenario. The DBC Special Fund would begin to utilize its excess funds in
FY22 with expenditures exceeding revenues by approximately $750 thousand. This trend will continue into
FY25. Exhibit 4-7 illustrates the DBC Special Fund projected revenue and expenditure activity and
corresponding projected redemption rates through FY25 under the economic downturn (moderate) scenario.
Exhibit 4-6
Projected DBC Fund Activity – Economic Downturn Results
FY 2021 FY 2022 FY 2023 FY 2024 FY 2025
Beginning Balance $46,265,901 $47,114,256 $46,357,585 $44,813,548 $42,469,562
Revenues $56,040,931 $55,680,565 $55,336,567 $55,008,334 $54,695,289
Deposits 46,700,776 46,400,471 46,113,806 45,840,278 45,579,407
Container Fees 9,340,155 9,280,094 9,222,761 9,168,056 9,115,881
Expenditures $55,192,576 $56,437,237 $56,880,604 $57,352,320 $57,852,209
Deposit Returns 29,329,680 29,605,337 29,893,888 30,195,296 30,509,533
HF Payments 23,862,896 24,781,900 24,885,466 25,003,243 25,135,051
Fund Administration 2,000,000 2,050,000 2,101,250 2,153,781 2,207,626
Net $848,355 $(756,671) $(1,544,037) $(2,343,986) $(3,156,921)
Ending Balance $47,114,256 $46,357,585 $44,813,548 $42,469,562 $39,312,641
Exhibit 4-7
Projected DBC Fund Activity and Redemption Rates – Economic Downturn Results
© 2021 Crowe LLP www.crowe.com4-6 Fiscal Impacts Analysis Hawaii Department of Health
D. Economic Growth Results
In the economic growth scenario, the recommended handling fees implemented in FY22 would increase
the DBC Special Fund’s expenditures by approximately $1.2 million as compared to FY21. The economic
growth scenario results indicate the DBC Special Fund will maintain adequate funds to cover the
recommended handling fees through FY25.
Exhibit 4-8 summarizes the DBC Special Fund projected revenue and expenditure activity through FY25
under the economic growth scenario. The DBC Special Fund would not utilize its excess funds through
FY25. Exhibit 4-9 illustrates the DBC Special Fund projected revenue and expenditure activity and
corresponding projected redemption rates through FY25 under the economic growth scenario.
Exhibit 4-8
Projected DBC Fund Activity – Economic Growth Results
FY 2021 FY 2021 FY 2022 FY 2023 FY 2025
Beginning Balance $46,265,901 $49,043,698 $51,947,334 $55,825,442 $60,698,512
Revenues $57,727,784 $59,082,270 $60,483,153 $61,931,882 $63,429,954
Deposits 48,106,487 49,235,225 50,402,628 51,609,901 52,858,295
Container Fees 9,621,297 9,847,045 10,080,526 10,321,980 10,571,659
Expenditures $54,949,987 $56,178,633 $56,605,046 $57,058,811 $57,539,747
Deposit Returns 29,089,194 29,351,572 29,626,387 29,913,588 30,213,133
HF Payments 23,860,793 24,777,061 24,877,409 24,991,442 25,118,988
Fund Administration 2,000,000 2,050,000 2,101,250 2,153,781 2,207,626
Net $2,777,797 $2,903,637 $3,878,107 $4,873,070 $5,890,208
Ending Balance $49,043,698 $51,947,334 $55,825,442 $60,698,512 $66,588,720
Exhibit 4-9
Projected DBC Fund Activity and Redemption Rates – Economic Growth Results
© 2021 Crowe LLP www.crowe.comEvaluation of the Current Handling Fees Paid to Certified Redemption Centers 4-7
E. Economic Downturn (Aggressive) Results
In the economic downturn (aggressive) scenario, the recommended handling fees implemented in FY22 would
increase the DBC Special Fund’s expenditures by approximately $1.8 million as compared to FY21. The
economic downturn (aggressive) scenario results indicate the DBC Special Fund will maintain adequate funds
to cover the recommended handling fees through FY25 should overall redemption rates, based on estimated
FY21 data, continue to reflect a decrease in beverage container sales and an increase in containers redeemed.
Exhibit 4-10 summarizes the DBC Special Fund projected revenue and expenditure activity through FY25
under the economic downturn (aggressive) scenario. The DBC Special Fund would not utilize its excess
funds through FY25, but would most likely need to closely monitor DBC inflows and outflows in order to
maintain a fund balance of at least $20 million by the end of FY25. Exhibit 4-11 illustrates the DBC Special
Fund projected revenue and expenditure activity and corresponding projected redemption rates through
FY25 under the economic growth scenario.
Exhibit 4-10
Projected DBC Fund Activity – Economic Downturn (Aggressive) Results
FY 2021 FY 2021 FY 2022 FY 2023 FY 2025
Beginning Balance $46,265,901 $45,026,883 $41,458,432 $36,193,576 $29,214,280
Revenues $54,369,868 $53,826,169 $53,287,907 $52,755,028 $52,227,478
Deposits 45,308,223 44,855,141 44,406,590 43,962,524 43,522,898
Container Fees 9,061,645 8,971,028 8,881,318 8,792,505 8,704,580
Expenditures $55,608,886 $57,394,620 $58,552,763 $59,734,324 $60,939,780
Deposit Returns 29,828,092 30,424,654 31,033,147 31,653,810 32,286,886
HF Payments 23,780,794 24,919,967 25,418,366 25,926,734 26,445,268
Fund Administration 2,000,000 2,050,000 2,101,250 2,153,781 2,207,626
Net $(1,239,018) $(3,568,451) $(5,264,855) $(6,979,296) $(8,712,302)
Ending Balance $45,026,883 $41,458,432 $36,193,576 $29,214,280 $20,501,978
Exhibit 4-11
Projected DBC Fund Activity and Redemption Rates – Economic Downturn Results
© 2021 Crowe LLP www.crowe.comYou can also read