Land Use Assumptions, Infrastructure Improvements Plan and Development Fees
←
→
Page content transcription
If your browser does not render page correctly, please read the page content below
Land Use Assumptions, IIP, and Development Fees                Town of Wellton, Arizona

         Land Use Assumptions, Infrastructure
    Improvements Plan and Development Fees
                                                                       Prepared for:

                                                  Town of Wellton, Arizona

                                                                  May 15, 2014

                                                   4701 Sangamore Road, Suite S240
                                                                    Bethesda, MD
                                                                    301.320.6900
                                                             www.tischlerbise.com

i
Land Use Assumptions, IIP, and Development Fees                                                                                          Town of Wellton, Arizona

                                                                 TABLE OF CONTENTS
EXECUTIVE SUMMARY ...................................................................................................... 1
 ARIZONA DEVELOPMENT FEE ENABLING LEGISLATION ............................................................................ 1
   Necessary Public Services ..................................................................................................................... 2
   Infrastructure Improvements Plan ........................................................................................................ 2
   Qualified Professionals .......................................................................................................................... 3
   Conceptual Development Fee Calculation ............................................................................................. 3
   Evaluation of Credits ............................................................................................................................. 3
 DEVELOPMENT FEE METHODOLOGY ........................................................................................................ 4
           Figure 1: Recommended Calculation Methodologies .................................................................................................. 4
     PROPOSED DEVELOPMENT FEES ............................................................................................................... 5
           Figure 2: Proposed Non-Utility Development Fees ..................................................................................................... 5
           Figure 3: Proposed Utility Development Fees .............................................................................................................. 5
     CURRENT DEVELOPMENT FEES ................................................................................................................. 6
           Figure 4: Current Non-Utility Development Fees ........................................................................................................ 6
           Figure 5: Current Utility Development Fees ................................................................................................................. 6
     DIFFERENCE BETWEEN PROPOSED AND CURRENT DEVELOPMENT FEES................................................. 7
           Figure 6: Difference Between Proposed and Current Non-Utility Development Fees ............................................ 7
           Figure 7: Difference Between Proposed and Current Utility Development Fees ..................................................... 7
           Figure 8: Current and Proposed Total Fees for a Single Unit .................................................................................... 7
PARKS AND RECREATIONAL FACILITIES IIP ................................................................ 8
           Figure PR1: Residents and Inflow Commuters in 2011 ............................................................................................... 8
     EXISTING FACILITIES .................................................................................................................................. 9
           Figure PR2: Incremental Expansion - Parks .................................................................................................................. 9
           Figure PR3: Incremental Expansion – Community Centers...................................................................................... 10
           Figure PR4: Incremental Expansion – Trails ............................................................................................................... 11
       Excluded Costs .................................................................................................................................... 11
       Current Use and Available Capacity................................................................................................... 11
     INFRASTRUCTURE NEEDS ANALYSIS ........................................................................................................ 12
       Projected Service Units ....................................................................................................................... 12
       Demand for Facility Expansions and Costs ........................................................................................ 12
           Figure PR5: Projected Demand for Parks and Recreational Facilities...................................................................... 13
     PARKS AND RECREATIONAL FACILITIES IIP .............................................................................................. 14
           Figure PR6: Necessary Parks and Recreational Facilities Expansions .................................................................... 14
     PROPOSED PARKS AND RECREATIONAL FACILITIES DEVELOPMENT FEES .............................................. 14
           Figure PR7: Proposed Parks and Recreational Facilities Development Fees .......................................................... 15
     FORECAST OF REVENUES......................................................................................................................... 16
       Parks and Recreational Facilities Development Fee Revenue ............................................................. 16
           Figure PR8: Projected Parks and Recreational Facilities Development Fee Revenue ............................................ 16
PUBLIC SAFETY FACILITIES IIP .......................................................................................17
           Figure PS1: Proportionate Share .................................................................................................................................. 18
     EXISTING FACILITIES ................................................................................................................................ 19
           Figure PS2: Incremental Expansion – Public Safety Buildings ................................................................................. 19
           Figure PS3: Incremental Expansion – Vehicles and Officer Equipment .................................................................. 20
       Excluded Costs .................................................................................................................................... 20
       Current Use and Available Capacity................................................................................................... 21
     INFRASTRUCTURE NEEDS ANALYSIS ........................................................................................................ 21

ii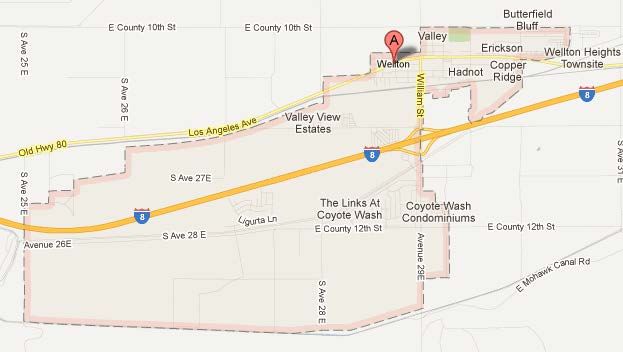
Land Use Assumptions, IIP, and Development Fees                                                                                                Town of Wellton, Arizona

         Projected Service Units ....................................................................................................................... 21
         Demand for Facility Expansions and Costs ........................................................................................ 21
            Figure PS4: Projected Demand for Public Safety Facilities....................................................................................... 22
      PUBLIC SAFETY FACILITIES IIP .................................................................................................................. 23
            Figure PS5: Necessary Public Safety Facilities and Expansions .............................................................................. 23
      PROPOSED PUBLIC SAFETY FACILITIES DEVELOPMENT FEE .................................................................... 23
            Figure PS6: Proposed Public Safety Facilities Development Fees ............................................................................ 25
      FORECAST OF REVENUES......................................................................................................................... 26
        Public Safety Facilities Development Fee Revenue ............................................................................. 26
            Figure PS7: Projected Public Safety Facilities Development Fee Revenue .............................................................. 26
STREET FACILITIES IIP ......................................................................................................27
 EXISTING FACILITIES ................................................................................................................................ 27
            Figure S1: Lane Miles of Capacity ................................................................................................................................ 27
         Current Use and Available Capacity................................................................................................... 27
            Figure S2: Daily Capacity .............................................................................................................................................. 28
            Figure S3: Cost per Lane Mile ....................................................................................................................................... 28
        Excluded Costs .................................................................................................................................... 28
      INFRASTRUCTURE NEEDS ANALYSIS ........................................................................................................ 29
            Figure S4: Residential Trip Generation Rates by Type of Housing .......................................................................... 29
            Figure S5: OnTheMap Inflow/ Outflow Analysis ....................................................................................................... 30
            Figure S6: Travel Demand Model Inputs .................................................................................................................... 31
         Projected Services Units ...................................................................................................................... 32
         Demand for Facility Expansions and Costs ........................................................................................ 32
            Figure S7: Projected Travel Demand ............................................................................................................................ 33
      STREET FACILITIES IIP .............................................................................................................................. 33
            Figure S8: Potential Streets Improvements and Expansions ..................................................................................... 33
      PROPOSED STREET FACILITIES DEVELOPMENT FEE ................................................................................ 34
            Figure S9: Proposed Street Facilities Development Fees ........................................................................................... 35
      FORECAST OF REVENUES......................................................................................................................... 36
        Street Facilities Development Fee Revenue ......................................................................................... 36
            Figure S10: Projected Street Facilities Development Fee Revenue ........................................................................... 36
WATER FACILITIES IIP ......................................................................................................37
 WATER CONNECTIONS AND FLOW ......................................................................................................... 38
            Figure W1: Water Level of Service .............................................................................................................................. 38
         Projected Service Units ....................................................................................................................... 39
            Figure W2: Projected Water Customers and Usage ................................................................................................... 39
      WATER FACILITIES IMPROVEMENTS AND COSTS .................................................................................... 40
       Current Use and Available Capacity................................................................................................... 40
            Figure W3: Water Plant Capacity ................................................................................................................................. 40
         Infrastructure Improvement Plan for Production and Treatment ...................................................... 41
            Figure W4: Necessary Water Improvements and Expansions ................................................................................. 41
      MAJOR LINES ........................................................................................................................................... 42
       Description .......................................................................................................................................... 42
            Figure W5: Water Main Level of Service .................................................................................................................... 42
         Excluded Costs .................................................................................................................................... 42
         Current Use and Available Capacity................................................................................................... 43
         Projected Service Units ....................................................................................................................... 43
         Demand for Facility Expansions and Costs ........................................................................................ 43

iii
Land Use Assumptions, IIP, and Development Fees Town of Wellton, Arizona
Figure W6: Projected Demand for Water Mains ......................................................................................................... 44
WATER FACILITIES IIP .............................................................................................................................. 45
Figure W7: Water IIP ...................................................................................................................................................... 45
PROPOSED WATER FACILITIES DEVELOPMENT FEES .............................................................................. 46
Figure W8: Proposed Water Facilities Development Fees........................................................................................ 47
FORECAST OF REVENUES......................................................................................................................... 48
Development Fee Revenue ................................................................................................................... 48
Figure W9: Projected Water Facilities Development Fee Revenue .......................................................................... 48
APPENDIX A: FORECAST OF REVENUES OTHER THAN FEES.....................................49
Figure A1: Projected Revenue ....................................................................................................................................... 50
Figure A2: General Fund Revenues ............................................................................................................................. 51
Figure A3: HURF Revenue per Person and Job .......................................................................................................... 52
Figure A4: HURF Revenue per Person and Job .......................................................................................................... 52
APPENDIX B: COST OF PROFESSIONAL SERVICES ......................................................53
Figure B1: Professional Services Costs ......................................................................................................................... 53
APPENDIX C: LAND USE ASSUMPTIONS .......................................................................54
Figure C1: Map of Town of Wellton Service Area ..................................................................................................... 54
Figure C2: Development Projections and Growth Rates .......................................................................................... 55
RESIDENTIAL DEVELOPMENT .................................................................................................................. 56
Figure C3: Person per Housing Unit by Type of Housing Unit .............................................................................. 57
Figure C4: Housing Units by Decade ........................................................................................................................... 58
Figure C5: Town of Wellton Population Share ........................................................................................................... 59
NON-RESIDENTIAL DEVELOPMENT ......................................................................................................... 60
Figure C6: Town of Wellton Job Share ......................................................................................................................... 60
Figure C7: Jobs and Floor Area Estimate ..................................................................................................................... 61
Figure C8: Employee and Building Area Ratios ......................................................................................................... 62
DETAILED DEVELOPMENT PROJECTIONS ................................................................................................ 63
Figure C9: Annual Demographic Data ........................................................................................................................ 63
ivLand Use Assumptions, IIP, and Development Fees Town of Wellton, Arizona
EXECUTIVE SUMMARY
The Town of Wellton hired TischlerBise to document land use assumptions, prepare an Infrastructure
Improvements Plan (IIP), and update development fees pursuant to Arizona Revised Statutes 9-436.05.
Municipalities in Arizona may assess development fees to offset infrastructure costs to a municipality for
necessary public services. The development fees must be based on an Infrastructure Improvements Plan
and Land Use Assumptions.
The IIP for each type of infrastructure is in the middle section of this document and the Land Use
Assumptions may be found in Appendix C. The proposed development fees are displayed in the
beginning of this document, shown in Figures 2 and 3.
Development fees are one-time payments used to construct system improvements needed to
accommodate new development. The fee represents future development’s proportionate share of
infrastructure costs. Development fees may be used for infrastructure improvements or debt service for
growth related infrastructure. In contrast to general taxes, development fees may not be used for
operations, maintenance, replacement, or correcting existing deficiencies.
This update of the Town’s Infrastructure Improvements Plan and associated update to its development
fees includes the following necessary public services:
• Parks and Recreational Facilities
• Public Safety Facilities (Police and Fire)
• Streets Facilities
• Water Facilities
This plan also includes all necessary elements required to be in full compliance with SB 1525.
ARIZONA DEVELOPMENT FEE ENABLING LEGISLATION
Arizona Revised Statutes 9-463.05 (hereafter referred to as “development fee enabling legislation”)
governs how development fees are calculated for municipalities in Arizona. During the state legislative
session of 2011, Senate Bill 1525 (SB 1525) was introduced which significantly amended the
development fee enabling legislation. The changes included:
• Amending existing development fee programs by January 1, 2012.
• Abandoning existing development fee programs by August 1, 2014.
• New development fee program structure revolving around a unified Land Use Assumptions
document and Infrastructure Improvements Plan.
• New adoption procedures for the Land Use Assumptions, Infrastructure Improvements Plan, and
development fees.
• New definitions, including “necessary public services” which defines what categories and types
of infrastructure may be funded with development fees.
• Time limitations in development fee collections and expenditures.
• New requirements for credits, “grandfathering” rules, and refunds.
This update of the Town’s development fees will be in compliance with all of the new requirements of
SB 1525.
1Land Use Assumptions, IIP, and Development Fees Town of Wellton, Arizona
Necessary Public Services
Under the new requirements of the development fee enabling legislation, development fees may be
only used for construction, acquisition or expansion of public facilities that are necessary public services.
“Necessary public service” means any of the following categories of facilities that have a life expectancy
of three or more years and that are owned and operated on behalf of the municipality: water,
wastewater, storm water, drainage, flood control, library, streets, fire and police, and neighborhood
parks and recreation. Additionally, a necessary public service includes any facility that was financed
before June 1, 2011 and that meets the following requirements:
1. Development fees were pledged to repay debt service obligations related to the construction of
the facility.
2. After August 1, 2014, any development fees collected are used solely for the payment of
principal and interest on the portion of the bonds, notes, or other debt service obligations
issued before June 1, 2011 to finance construction of the facility.
Infrastructure Improvements Plan
Development fees must be calculated pursuant to an Infrastructure Improvements Plan (hereafter
referred to as the “IIP”). For each necessary public service that is the subject of a development fee, by
law, the infrastructure improvements plan shall include the following seven elements:
• A description of the existing necessary public services in the service area and the cost to update,
improve, expand, correct or replace those necessary public services to meet existing needs and
usage and stricter safety, efficiency, environmental or regulatory standards, which shall be
prepared by qualified professionals licensed on this state, as applicable.
• An analysis of the total capacity, the level of current usage and commitments for usage of
capacity of the existing necessary public services, which shall be prepared by qualified
professionals licensed in this state, as applicable.
• A description of all or the parts of the necessary public services or facility expansion and their
costs necessitated by and attributable to development in the service area based on the
approved Land Use Assumptions, including a forecast of the costs of infrastructure,
improvements, real property, financing, engineering and architectural services, which shall be
prepared by qualified professionals licensed in the state, as applicable.
• A table establishing the specific level or quantity of use, consumption, generation or discharge
of a service unit for each category of necessary public services or facility expansions and an
equivalency or conversion table establishing the ratio of a service unit to various types of land
uses, including residential, commercial and industrial.
• The total number of projected service units necessitated by and attributable to new
development in the service area based on the approved Land Use Assumptions and calculated
pursuant to generally accepted engineering and planning criteria.
• The projected demand for necessary public services or facility expansions required by new
service units for a period not to exceed ten years.
• A forecast of revenues generated by new service units other than development fees, which shall
include estimated state-shared revenue, highway users revenue, federal revenue, ad valorem
property taxes, construction contracting or similar excise taxes and the capital recovery portion
of utility fees attributable to development based on the approved Land Use Assumptions and a
plan to include these contributions in determining the extent of the burden imposed by the
development.
2Land Use Assumptions, IIP, and Development Fees Town of Wellton, Arizona Qualified Professionals The IIP must be developed by qualified professionals using general accepted engineering and planning practices. A qualified professional is defined as “a professional engineer, surveyor, financial analyst or planner providing services within the scope of the person’s license, education, or experience.” TischlerBise is a fiscal, economic, and planning consulting firm specializing in the cost of growth services. Our services include development fees, fiscal impact analysis, infrastructure financing analyses, user fee/cost of service studies, capital improvement plans, and fiscal software. TischlerBise has prepared over 800 development fee studies over the past 30 years for local governments across the United States. Conceptual Development Fee Calculation In contrast to project-level improvements, development fees fund growth-related infrastructure that will benefit multiple development projects, or the entire service area (usually referred to as system improvements). The first step is to determine an appropriate demand indicator for the particular type of infrastructure. The demand indicator measures the number of service units for each unit of development. For example, an appropriate indicator of the demand for parks is population growth and the increase in population can be estimated from the average number of persons per housing unit. The second step in the development fee formula is to determine infrastructure improvement units per service unit, typically called level of service (LOS) standards. In keeping with the park example, a common LOS standard is improved park acres per thousand people. The third step in the development fee formula is the cost of various infrastructure units. To complete the park example, this part of the formula would establish a cost per acre for land acquisition and/ or park improvements. Evaluation of Credits Regardless of the methodology, a consideration of “credits” is integral to the development of a legally defensible development fee. There are two types of “credits” that should be addressed in development fee studies and ordinances. The first is a revenue credit due to possible double payment situations, which could occur when other revenues may contribute to the capital costs of infrastructure covered by the development fee. This type of credit is integrated into the fee calculation, thus reducing the fee amount. The second is a site specific credit or developer reimbursement for dedication of land or construction of system improvements. This type of credit is addressed in the administration and implementation of the development fee program. For ease of administration, TischlerBise normally recommends developer reimbursements for system improvements. 3
Land Use Assumptions, IIP, and Development Fees                                      Town of Wellton, Arizona

DEVELOPMENT FEE METHODOLOGY

Development fees for the necessary public services made necessary by new development must be based
on the same level of service provided to existing development in the service area. There are three basic
methodologies used to calculate development fees. They examine the past, present, and future status of
infrastructure. The objective of evaluating these different methodologies is to determine the best
measure of the demand created by new development for additional infrastructure capacity.

    •   Cost recovery (past) is used in instances when a community has oversized a facility or asset in
        anticipation of future development. This methodology is based on the rationale that new
        development is repaying the community for its share of the remaining unused capacity.
    •   Incremental expansion method (present) documents the current level of service for each type
        of public facility. The intent is to use revenue collected to expand or provide additional facilities,
        as needed to accommodate new development, based on the current cost to provide capital
        improvements.
    •   Plan-based method (future) utilizes a community’s capital improvement plan and/or other
        adopted plans or engineering studies to guide capital improvements needed to serve new
        development.

A summary is provided in Figure 1 showing the methodologies, components and allocations used to
calculate the development fees.

Figure 1: Recommended Calculation Methodologies

                            Cost Recovery         Incremental Expansion            Plan-Based
           Type of Fee
                                (past)                  (present)                   (future)

         1. Parks                           Improved Park Land

         2. Public Safety                   Vehicles and Officer Equip.

         3. Streets                         Lane Miles of Collectors

                                                                              Water Production
         4. Water                                                             and Treatment
                                                                              Improvements

4
Land Use Assumptions, IIP, and Development Fees Town of Wellton, Arizona
PROPOSED DEVELOPMENT FEES
Based on the data, assumptions, and calculation methodologies in the Land Use Assumptions and
Infrastructure Improvements Plans, the maximum supportable development fees are presented in the
Parks and Recreational Facilities Infrastructure Improvements Plan, Public Safety Infrastructure
Improvements Plan, Street Facilities Infrastructure Improvements Plan, and Water Facilities
Infrastructure Improvements Plan, respectively.
Based on discussions with Town Officials and staff since the adoption of the IIP on March 4, 2014, the
development fees proposed for adoption, as shown in Figures 2 and 3, reflect policy decisions
regarding the Town’s Development Fee Study.
The Town will remove:
1. The community centers and trails components from the Parks and Recreational Facilities
development fee.
2. The public safety buildings component from the Public Safety Facilities development fee.
3. The water main component from the Water Facilities development fee.
The Town will also:
1. Reduce the Street Facilities development fee to 29% of the maximum supportable amount.
2. Reduce the Water Facilities development fee to 40% of the maximum supportable amount.
Proposed non-utility development fees are displayed in Figure 2.
Figure 2: Proposed Non-Utility Development Fees
Proposed Non-Utility Development Fees
Land Use Parks Public Safety Streets Total
Residential (per Housing Unit)
Single Unit $735 $428 $473 $1,636
2+ Units $606 $352 $403 $1,361
Nonresidential (per 1000 sq ft of floor area)
Industrial $462 $678 $259 $1,399
Commercial $515 $2,740 $947 $4,203
Institutional $252 $990 $379 $1,621
Office & Other Services $855 $1,073 $410 $2,337
Proposed utility development fees are shown in Figure 3.
Figure 3: Proposed Utility Development Fees
Proposed Utility Development Fees
Per Meter Water
0.75 $1,243
1.00 $1,307
1.50 $1,464
2.00 $1,653
5Land Use Assumptions, IIP, and Development Fees Town of Wellton, Arizona
CURRENT DEVELOPMENT FEES
Wellton’s current non-utility development fees are shown in Figure 4. All the fees are listed at zero
because the Town does not have development fees for these categories and relied on developer
agreements for much of the infrastructure necessitated by new development.
Figure 4: Current Non-Utility Development Fees
Current Non-Utility Development Fees
Land Use Parks Public Safety Streets Total
Residential (per Housing Unit)
Single Unit $0 $0 $0 $0
2+ Units $0 $0 $0 $0
Nonresidential (per 1000 sq ft of floor area)
Industrial $0 $0 $0 $0
Commercial $0 $0 $0 $0
Institutional $0 $0 $0 $0
Office & Other Services $0 $0 $0 $0
Wellton’s current utility development fees are shown in Figure 5.
Figure 5: Current Utility Development Fees
Current Utility Development Fees
Per Meter Water
0.75 $800
1.00 $1,443
1.50 $7,766
2.00 $9,650
6Land Use Assumptions, IIP, and Development Fees Town of Wellton, Arizona
DIFFERENCE BETWEEN PROPOSED AND CURRENT DEVELOPMENT FEES
The differences between the proposed and current non-utility development fees are displayed in Figure
6.
Figure 6: Difference Between Proposed and Current Non-Utility Development Fees
Increase or Decrease
Land Use Parks Public Safety Streets Total
Residential (per Housing Unit)
Single Unit $735 $428 $473 $1,636
2+ Units $606 $352 $403 $1,361
Nonresidential (per 1000 sq ft of floor area)
Industrial $462 $678 $259 $1,399
Commercial $515 $2,740 $947 $4,203
Institutional $252 $990 $379 $1,621
Office & Other Services $855 $1,073 $410 $2,337
The differences between the proposed and current utility development fees are displayed in Figure 7.
Figure 7: Difference Between Proposed and Current Utility Development Fees
Increase or Decrease
Per Meter Water % Change
0.75 $443 55%
1.00 ($136) -9%
1.50 ($6,302) -81%
2.00 ($7,997) -83%
To obtain the total development fee for a residential unit, utility fees must be added to non-utility fees.
Assuming a 0.75 meter for a single residential unit, current and proposed total development fees are
shown in Figure 8.
Figure 8: Current and Proposed Total Fees for a Single Unit
Total Fees for Single Unit Residential
Current Proposed $ Change
$800 $2,879 $2,079
7Land Use Assumptions, IIP, and Development Fees Town of Wellton, Arizona
PARKS AND RECREATIONAL FACILITIES IIP
ARS 9-463.05 (T)(7)(g) defines the facilities and assets which can be included in the Parks and
Recreational Facilities IIP:
“Neighborhood parks and recreational facilities on real property up to thirty acres in area, or
parks and recreational facilities larger than thirty acres if the facilities provide a direct benefit to
the development. Park and recreational facilities do not include vehicles, equipment or that
portion of any facility that is used for amusement parks, aquariums, aquatic centers,
auditoriums, arenas, arts and cultural facilities, bandstand and orchestra facilities, bathhouses,
boathouses, clubhouses, community centers greater than three thousand square feet in floor
area, environmental education centers, equestrian facilities, golf course facilities, greenhouses,
lakes, museums, theme parks, water reclamation or riparian areas, wetlands, zoo facilities or
similar recreational facilities, but may include swimming pools.”
The Parks and Recreational Facilities IIP includes components for parks, community centers, trails, and
professional services costs for preparing the Parks and Recreational Facilities IIP and development fees.
The incremental expansion methodology is used to calculate the Parks and Recreational Facilities IIP.
Service Area
The Town of Wellton plans to provide a uniform level-of-service and equal service for parks and
recreational facilities throughout the Town. As a result, the service area for the Parks and Recreational
Facilities IIP is townwide.
Proportionate Share
The development fee for Parks and Recreational Facilities is calculated on a per capita basis for
residential development. For nonresidential development, the fee methodology allocates the capital
cost of infrastructure on a per employee basis.
ARS 9-463.05 (B)(3) states that the development fee shall not exceed a proportionate share of the cost
of necessary public services needed to accommodate new development. In Wellton, Parks and
Recreational Facilities development fees are based on both residential and nonresidential development.
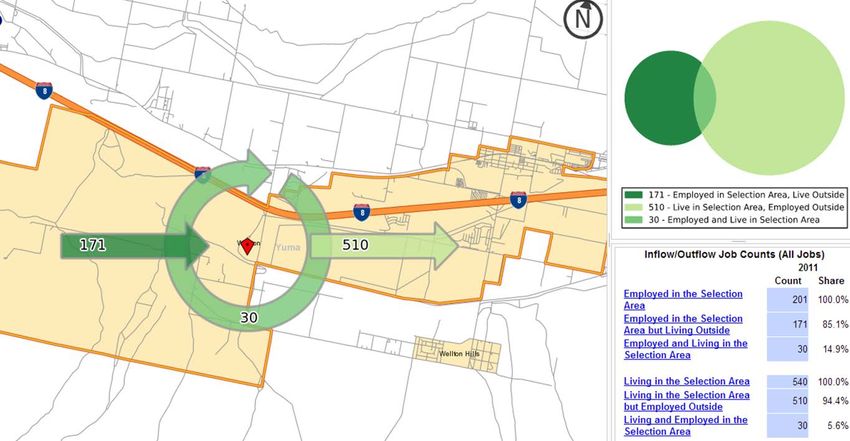
To determine the proportionate share for Parks and Recreational Facilities, the number of residents in
2011 (2,930) is multiplied by the number of days per year (365), and the number of inflow commuters
(171) is multiplied by an average number of work days per year (5 days per week for 50 weeks a year.)
The shares of this total (96% for residential and 4% for nonresidential) are used to allocate the costs of
Parks and Recreational Facilities by land use type.
Figure PR1: Residents and Inflow Commuters in 2011
Cumulative Impact Days per Year Cost Allocation for Parks
Inflow
Residents Residential* Nonresidential** Total Residential Nonresidential
Commuters
2,930 171 1,069,450 42,750 1,112,200 96% 4%
* Days per Year = 365
** 5 Days per Week x 50 Weeks per Year = 250
Source: Infl ow/ Outfl ow Ana l ys i s , OnTheMa p web a ppl i ca ti on, U.S. Cens us Burea u.
8Land Use Assumptions, IIP, and Development Fees Town of Wellton, Arizona
EXISTING FACILITIES
Parks
ARS 9-463.05(E)(1) requires a description of the existing necessary public services and the costs to
upgrade or replace these services to meet existing needs and usage. The Town currently has 9.9 acres of
parks. The residential level-of-service for parks is 3.1 acres per thousand persons, which is found by
multiplying the number of park acres (9.9) by the residential proportionate share (96%), dividing this
total by the 2013 population (3,072 persons) and multiplying this total by 1,000. The nonresidential level
of service is 1.6 acres per 1,000 jobs, which is found by multiplying the number of park acres (9.9) by the
nonresidential proportionate share (4%), dividing this total by the number of jobs in 2013 (254) and
multiplying this total by 1,000.
The improvement cost per acre of a park in Wellton is $90,600 and the land purchase cost per acre is
$75,000, totaling $165,600 in park costs per acre. The land cost purchase is the expected cost to
purchase park land in Wellton, provided by Town staff. The improvement cost per acre was the cost to
develop Butterfield Park. The cost per person for the park component is determined to be $512.27 per
person, which is found by multiplying the residential level of service (3.1 acres per 1,000 persons) by the
total parks cost ($165,600) and dividing by 1,000. The cost per job is $258.53, which is found by
multiplying the nonresidential level of service (1.6 acres per 1,000 jobs) by the total parks cost per acre
($165,000) and dividing by 1,000. The inventory, level of service, and cost analysis are shown in Figure
PR2.
Figure PR2: Incremental Expansion - Parks
Park Total Acres
Butterfield Park 8.8
West Side Park 1.1
Total 9.9
Improvement Cost per Acre1 $90,600
Land Purchase Cost per Acre2 $75,000
Total Cost per Acre $165,600
1. Cos t of i mprovements / a meni ti es to upgra de Butterfi el d Pa rk.
2. Cos t of l a nd for 5 a cre pa rk a ccordi ng to Town of Wel l ton.
Level of Service (LOS) Standards Residential Nonresidential
Total Acres 9.9
Proportionate Share 96% 4%
2013 Service Units (Persons/ Jobs) 3,072 254
LOS: Acres per 1,000 Persons/ Jobs 3.1 1.6
Cost Analysis Residential Nonresidential
Average Cost per Acre $165,600
LOS: Acres per 1,000 Persons/ Jobs 3.1 1.6
Cost Per Person/ Job $512.27 $258.53
9Land Use Assumptions, IIP, and Development Fees Town of Wellton, Arizona
Community Centers
ARS 9-463.05(E)(1) requires a description of the existing necessary public services and the costs to
upgrade or replace these services to meet existing needs and usage. The inventory of includes Wellton’s
Community Center, which is 7,569 square feet. The residential level of service is 2.4 square feet per
person, which is found by multiplying the total square footage (7,569) by the residential proportionate
share (96%) and dividing this by the 2013 population (3,072). The nonresidential level of service is 1.2
square feet per job, which is found by multiplying the total square footage (7,569) by the nonresidential
proportionate share (4%) and dividing this by the number of jobs in 2013 (254).
The average cost per square foot of a community center is $139 based on Marshall Valuation Service.
This cost per square foot multiplied by the levels of service results in a community center cost per
person of $328.74 and a cost per job of $165.91.
Figure PR3: Incremental Expansion – Community Centers
Facility Square Feet
Community Center 7,569
Cost per Square Foot 1 $139
1. Ma rs ha l l Va l ua ti on Servi ce, 2010. Upda ted to current dol l a rs us i ng
CPI.
Level of Service (LOS) Standards Residential Nonresidential
Total Square Feet 7,569
Proportionate Share 96% 4%
2013 Service Units (Persons/ Jobs) 3,072 254
LOS: Square Feet per Person/ Job 2.4 1.2
Cost Analysis Residential Nonresidential
Cost per Square Foot $139
LOS: Square Feet per Person/ Job 2.4 1.2
Cost Per Person/ Job $328.74 $165.91
10Land Use Assumptions, IIP, and Development Fees Town of Wellton, Arizona
Trails
ARS 9-463.05(E)(1) requires a description of the existing necessary public services and the costs to
upgrade or replace these services to meet existing needs and usage. Wellton has a downtown
pedestrian network of 7,559 linear feet which includes pathways through the Town. The residential level
of service is 2.4 linear feet per person which is found by multiplying the total linear feet (7,559) by the
residential proportionate share (96%) and dividing this total by the 2013 population (3,072). The
nonresidential level of service is 1.2 linear feet per job, which is found by multiplying the total linear feet
(7,559) by the nonresidential proportionate share (4%) and dividing this total by the number of jobs in
2013 (254). The total cost of the network is $427,043, which is equal to a cost per linear foot of $56. This
cost multiplied by the levels of service yields a trails cost per person of $132.27 and a cost per job of
$66.75.
Figure PR4: Incremental Expansion – Trails
Cost per
Trail Linear Feet Cost 1 Linear Ft
Downtown Pedestrian Network 7,559 $427,043 $56
1. Town of Wel l ton.
Level of Service (LOS) Standards Residential Nonresidential
Linear Feet 7,559
Proportionate Share 96% 4%
2013 Service Units (Persons/ Jobs) 3,072 254
LOS: Linear Feet per Person/ Job 2.4 1.2
Cost Analysis Residential Nonresidential
Cost per Linear Foot $56
LOS: Linear Feet per Person/ Job 2.4 1.2
Cost Per Person/ Job $132.27 $66.75
Excluded Costs
Development fees in Wellton exclude costs of to upgrade, update, improve, expand, correct or replace
those necessary public services to meet existing needs and usage and stricter safety, efficiency,
environmental or regulatory standards. Parks and Recreational Facilities development fees will only pay
for additional park land and improvements, community centers, and trails to accommodate new
development, based on the same level-of-service provided to existing residents and jobs.
Current Use and Available Capacity
ARS 9-463.05(E)(2) requires an analysis of the total capacity, the level of current usage and
commitments for usage of capacity of the existing necessary public services. The levels of service
established above for improved parks, community centers, and trails are the standards the Town wishes
to maintain using the incremental expansion method for new development. Thus, there is no available
11Land Use Assumptions, IIP, and Development Fees Town of Wellton, Arizona capacity for new development based on the current inventory. New development will be served by Parks and Recreational Facilities improvement capital projects. INFRASTRUCTURE NEEDS ANALYSIS Projected Service Units ARS 9-463.05(E)(5) requires the total number of service units necessitated by and attributable to new development. As shown in Figure PR5 and determined in the Land Use Assumptions, it is estimated there will be 822 additional persons and 279 jobs over the next ten years. Demand for Facility Expansions and Costs ARS 9-463.05(E)(6) requires the projected demand for necessary public services or facility expansions required by service units for the next ten years. The projected service units (822 persons for residential development and 279 jobs for nonresidential development) are multiplied by their respective residential and nonresidential levels of service for each IIP component. This new development will demand an additional 3 acres of parks, 2,278 square feet of community centers, and 2,275 linear feet of trails. ARS 9-463.05(E)(3) requires a description the necessary public services and their costs necessitated by and attributable to development including a forecast of the costs. The ten-year totals of the projected demand for each existing public service category are multiplied by their respective costs to determine the total cost of each to accommodate the projected demand over the next ten years. For example, the projected development requires 3 additional acres of parks. This is multiplied by the park cost per acre of $165,600 to determine the total cost of parks improvements to be $496,800. This calculation was repeated to determine a 10 year cost of $316,600 for community centers and $127,400 for trails. These components total $940,800. 12
Land Use Assumptions, IIP, and Development Fees                                            Town of Wellton, Arizona

Figure PR5: Projected Demand for Parks and Recreational Facilities

               Park Improvements and Land       Community Centers                          Trails
                           acres per 1,000                   square feet                     linear feet per
     Res LOS        3.1                           2.4                             2.4
                           persons                           per person                      person
     Nonres                acres per 1,000                   square feet                     linear feet per
                    1.6                           1.2                             1.2
     LOS                   jobs                              per job                         job
                                                             per square
     Cost      $165,600    per acre             $139                              $56        per linear foot
                                                             foot

                                                             Projected Demand
                                                                            Recreational
                             Service Unit:   Service Unit:       Parks                                Trails
                                                                              Facilities
                               Persons           Jobs           (acres)                             (linear ft)
                                                                             (square ft)
      Base       FY2013           3,072           254             10             7,569                7,559
        1           2014          3,146           273             10             7,767                7,757
        2           2015          3,222           294             11             7,970                7,960
        3           2016          3,299           317             11             8,180                8,170
        4           2017          3,378           341             11             8,397                8,386
        5           2018          3,459           368             11             8,620                8,609
        6           2019          3,542           396             12             8,850                8,838
        7           2020          3,627           427             12             9,088                9,076
        8           2021          3,714           459             12             9,333                9,320
        9           2022          3,803           495             13             9,586                9,573
       10           2023          3,895           533             13             9,847                9,834
     Ten-Yr Total                 822             279              3             2,278                2,275
     Cost of Park Land and Improvements                        $496,800
     Cost of Community Center Improvements                                      $316,600
     Cost of Trail Improvements                                                                     $127,400

     Total Cost of Improvements and Expansions to Accommodate New Development                          $940,800

13
Land Use Assumptions, IIP, and Development Fees Town of Wellton, Arizona
PARKS AND RECREATIONAL FACILITIES IIP
Figure PR6 displays identified Parks and Recreational Facilities projects that will accommodate new
development in the Town over the next ten years. The Town of Wellton is planning to build a Multi-
Sport Complex for $500,000. Improvements include fields, bleachers, a snack bar, and lights. The land
for the complex is expected to cost $375,000. Additionally, the Town is planning to fund a new
community center, and only the first 3,000 square feet can be funded through development fees, as
required by the Act. (The cost of $417,000 represents the approximate cost of a 3,000 square foot
community center.) The Town also plans to construct additional linear feet to its downtown pedestrian
network. These improvements and expansions total $1,075,000.
Figure PR6: Necessary Parks and Recreational Facilities Expansions
Project 10-Yr Total
Land and Improvements
Land for Complex $375,000
Multi-Sport Complex (includes improvements) $500,000
Community Centers
Community Center (3,000 square feet) $417,000
Trails
Downtown Pedestrian Network $125,000
Total $1,042,000
Source: Town of Wel l ton
PROPOSED PARKS AND RECREATIONAL FACILITIES DEVELOPMENT FEES
Based on policy decisions by the Town of Wellton since the adoption of the IIP on March 4, 2014, the
Town is removing the community centers and trails component from the proposed Parks and
Recreational Facilities development fee. The proposed fee below just lists the Parks component.
Ratio of Service Unit to Development Unit
ARS 9-463.05(E)(4) requires a conversion table establishing the ratio of a service unit to various types of
land uses, including residential, commercial and industrial. For residential development, average
number of persons per housing unit provides the necessary conversion. Nonresidential development
uses employees per KSF as the conversion from service unit to development unit. This ratio is shown in
Figure PR7.
Revenue Credit
Included in the maximum supportable development fees is a Revenue Credit of 1% percent. The
unadjusted Parks and Recreational Facilities development fees per service unit would generate more
revenue over the next ten years, based on the approved Land Use Assumptions, than the identified
growth cost of improved parkland of $501,000. To ensure that no more fee revenue is collected than the
Town plans to spend, the potential gross cost per service unit is reduced by the revenue credit to
calculate the net capital cost per service unit. Based on the gross capital costs per service unit, the
projected development fee revenue would equal $502,000. To formula to calculate the Revenue Credit is
as follows: ($502,000 – $501,000) / $501,000 = 1.5 percent (rounded).
14Land Use Assumptions, IIP, and Development Fees Town of Wellton, Arizona
Proposed Parks and Recreational Facilities Development Fees
Infrastructure standards and cost factors for Parks and Recreational Facilities are summarized in the
upper portion of Figure PR7. Updated development fees for Parks and Recreational Facilities are shown
in the column with green shading.
Figure PR7: Proposed Parks and Recreational Facilities Development Fees
Cost per Person
Park Land and Improvements $512.27
Professional Services $10.84
Revenue Credit ($5.23) 1.0%
Net Cost per Service Unit $517.88
Residential Development Fees per Housing Unit
Development Persons per Proposed Current Increase
Type Housing Unit Fee Fee (Decrease)
Single Unit 1.42 $735 $0 $735
2+ Units 1.17 $606 $0 $606
Cost per Job
Park Land and Improvements $258.53
Professional Services $1.53
Revenue Credit ($2.60) 1.0%
Net Cost per Service Unit $257.46
Nonresidential Development Fees per 1,000 Square Feet of Floor Area
Development Employees per Proposed Current Increase
Type KSF Fee Fee (Decrease)
Industrial 1.79 $462 $0 $462
Commercial 2.00 $515 $0 $515
Institutional 0.98 $252 $0 $252
Office & Other Services 3.32 $855 $0 $855
15Land Use Assumptions, IIP, and Development Fees Town of Wellton, Arizona
FORECAST OF REVENUES
Appendix A contains the forecast of revenues required by Arizona’s enabling legislation (ARS 9-
463.05(E)(7)).
Parks and Recreational Facilities Development Fee Revenue
The top of Figure PR8 summarizes the growth related cost of infrastructure in Wellton over the next ten
years (approximately $501,000 for Parks and Recreational Facilities.) Wellton should receive
approximately $498,000 in parks and recreational facility fee revenue over the next ten years, if actual
development matches the Land Use Assumptions documented in Appendix C.
Figure PR8: Projected Parks and Recreational Facilities Development Fee Revenue
Ten-Year Growth-Related Costs for Parks and Recreational Facilities
Park Land and Improvements $496,800
Professional Services $4,367
Total (rounded) $501,000
Office & Other
Single Unit 2+ Units Industrial Commercial Institutional
Services
$735 $606 $462 $515 $252 $855
per housing unit per housing unit per 1000 Sq Ft per 1000 Sq Ft per 1000 Sq Ft per 1000 Sq Ft
Year Hsg Units Hsg Units KSF KSF KSF KSF
Base 2013 1,996 222 28 45 20 22
1 2014 2,045 227 30 49 21 24
2 2015 2,093 233 33 52 23 26
3 2016 2,144 238 35 56 25 28
4 2017 2,195 244 38 61 27 30
5 2018 2,248 250 41 66 29 33
6 2019 2,302 256 44 71 31 35
7 2020 2,357 262 48 76 34 38
8 2021 2,414 268 51 82 36 41
9 2022 2,471 275 55 88 39 44
10 2023 2,531 281 60 95 42 48
Ten-Yr Increase 535 59 32 50 22 26
Projected Fees => $393,000 $36,000 $15,000 $26,000 $6,000 $22,000
Total Projected Revenues $498,000
16Land Use Assumptions, IIP, and Development Fees Town of Wellton, Arizona
PUBLIC SAFETY FACILITIES IIP
ARS 9-463.05 (T)(7)(f) defines the facilities and assets which can be included in the Public Safety
Facilities IIP:
“Fire and police facilities, including all appurtenances, equipment and vehicles. Fire and police
facilities do not include a facility or portion of a facility that is used to replace services that were
once provided elsewhere in the municipality, vehicles and equipment used to provide
administrative services, helicopters or airplanes or a facility that is used for training firefighters
from more than one station or substation.”
The Public Safety Facilities IIP includes components for fire and police stations, vehicles and officer
equipment, and the cost of professional services for preparing the Public Safety IIP and development
fees. Incremental expansion is used to calculate each element of the Public Safety Facilities IIP.
Service Area
The service area for the Public Safety Facilities IIP is Townwide.
Proportionate Share
The development fee for Public Safety is calculated on a per capita basis for residential development.
For nonresidential development, the fee methodology allocates the capital cost of infrastructure on a
per trip basis.
ARS 9-463.05 (B)(3) states that the development fee shall not exceed a proportionate share of the cost
of necessary public services needed to accommodate new development. In Wellton, Public Safety
Facilities development fees are based on both residential and nonresidential development. As shown in
Figure PS1, functional population was used to allocate Public Safety Facilities costs to residential and
nonresidential development. Functional population is similar to what the U.S. Census Bureau calls
“daytime population” by accounting for people living and working in a jurisdiction. Residents that don’t
work are assigned 20 hours per day to residential development and four hours per day to nonresidential
development (annualized averages). Residents that work in Wellton are assigned 14 hours to residential
development. Inflow commuters are assigned 10 hours to nonresidential development. Based on 2011
functional population data for Wellton, the cost allocation for residential development is 83% while
nonresidential development accounts for 17% of the demand for Public Safety Facilities infrastructure.
17Land Use Assumptions, IIP, and Development Fees Town of Wellton, Arizona
Figure PS1: Proportionate Share
Service Units in 2011 Demand Person
Hours/Day Hours
Residential
Population* 2,930
82% Residents Not Working 2,390 20 47,800
18% Resident Workers** 540
6% Worked in Town** 30 14 420
94% Worked Outside Town** 510 14 7,140
Residential Subtotal 55,360
Residential Share => 83%
Nonresidential
Non-working Residents 2,390 4 9,560
Jobs Located in Town** 201
Residents Working in Town** 30 10 300
Non-Resident Workers (inflow commuters) 171 10 1,710
Nonresidential Subtotal 11,570
Nonresidential Share => 17%
* 2011 count, U.S. Census Bureau.
** Inflow/Outflow Analysis, OnTheMap web application, U.S. Census TOTAL 66,930
Bureau data for all jobs.
The development fee for Public Safety Facilities is calculated on a per capita basis for residential
development. Nonresidential development fees are calculated using trips as the service unit.
TischlerBise recommends using nonresidential vehicle trips as the best demand indicator for public
safety facilities and equipment. Trip generation rates are used for nonresidential development because
vehicle trips are highest for commercial developments, such as shopping centers, and lowest for
industrial development. Office and institutional trip rates fall between the other two categories. This
ranking of trip rates is consistent with the relative demand for public safety from nonresidential
development.
18You can also read