Remote Sensing & Classified Land Cover Essential Land Use Decision Support Tools Using Moderate-Resolution Imagery
←
→
Page content transcription
If your browser does not render page correctly, please read the page content below
GLOBAL ECOSYSTEM CENTER                  www.systemecology.org

Remote Sensing & Classified Land Cover
Essential Land Use Decision Support Tools Using
Moderate-Resolution Imagery

                                                     MARCH 2012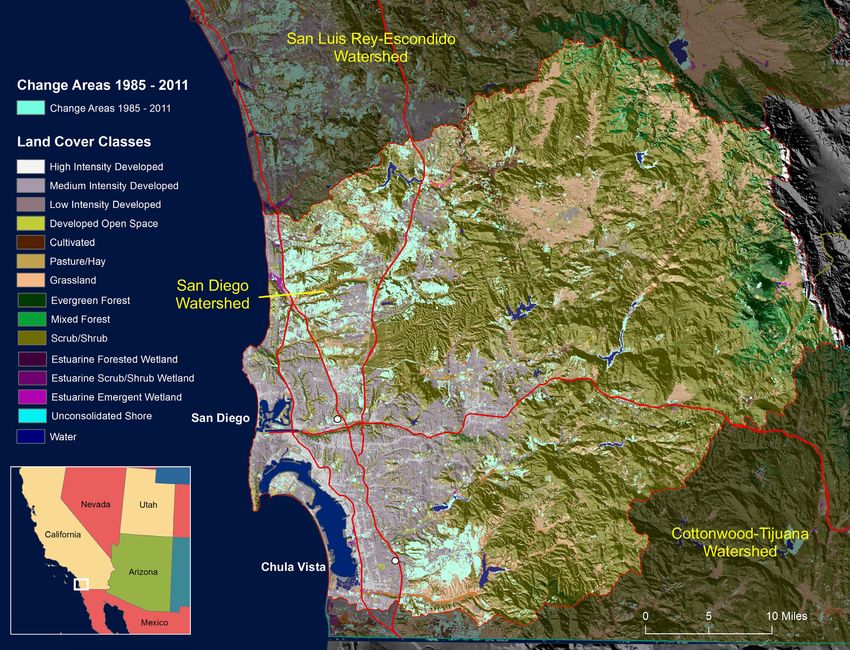
Remote Sensing & Classified Land Cover: Essential Land Use Decision Support Tools

                   “Give me a lever long enough and a fulcrum on which to place it, and I shall move the world.”

                   										                                                                      -Archimedes

                   T
                              here has been a long history of conflict between humans and nature related
                              to land use. Historic records document catastrophic flooding, fire, disease and
                              drought. As these events occurred, they were often perceived as “acts of God”
                   and beyond our control; however, people have become aware that many of these epi-
                   sodes were triggered by human actions. The powerful influences of humans on natu-
                   ral landscapes are too often minimized as cities and towns are rebuilt after disasters.
                   Future disasters are assured as settlements are reestablished without changing devel-
                   opment patterns or making essential adjustments in land use policies. While ignorance
                   may be a valid excuse for past mismanagement, it is not a valid excuse today.

                        For the past half century, satellites have been providing information regarding Earth’s sur-
                   face. And, just as the satellite data collection technology has evolved, so has the ability to ac-
                   curately interpret and analyze the imagery. Currently, data collected by Earth-observing satellites
                   can be classified into discrete land cover categories, allowing for the documentation and analysis
                   of the landscape. Additional information regarding landscape structure and functions of the land-
                   scape can be determined using a Geographic Information Systems (GIS). The combination of land
                   cover metrics and engineering/scientific models permit accurate calculations of human-induced
                   impacts on the landscape.
                        While conflicts between humans and nature are becoming more complex, larger in scale,
                   and potentially leading to more severe consequences, information technology provides an un-
                   precedented ability to gather and assess information. The challenge is to better utilize available
                   resources when land use decisions are formulated and avoid potentially disastrous conflicts.
                        Natural disasters triggered by hurricanes are an example of the value of remote sensing and
                   GIS. The effectiveness of barrier islands in reducing hurricane strength and protecting the main-
                   land is well understood. Through landscape modeling, scientists are able to calculate buffering
                   effects of these islands. Satellite imagery has documented their condition for over 30 years, and
                   in New Orleans, decision makers were aware of the decline of the barrier islands. Unfortunately,
                   land use policies were not established to rebuild or protect these islands and the city suffered
                   irrevocable consequences and will likely never fully recover.
                        This document identifies data and analysis opportunities available to improve land use deci-
                   sion making and to avoid the disastrous consequences. It is divided into the following sections:

2   GLOBAL ECOSYSTEM CENTER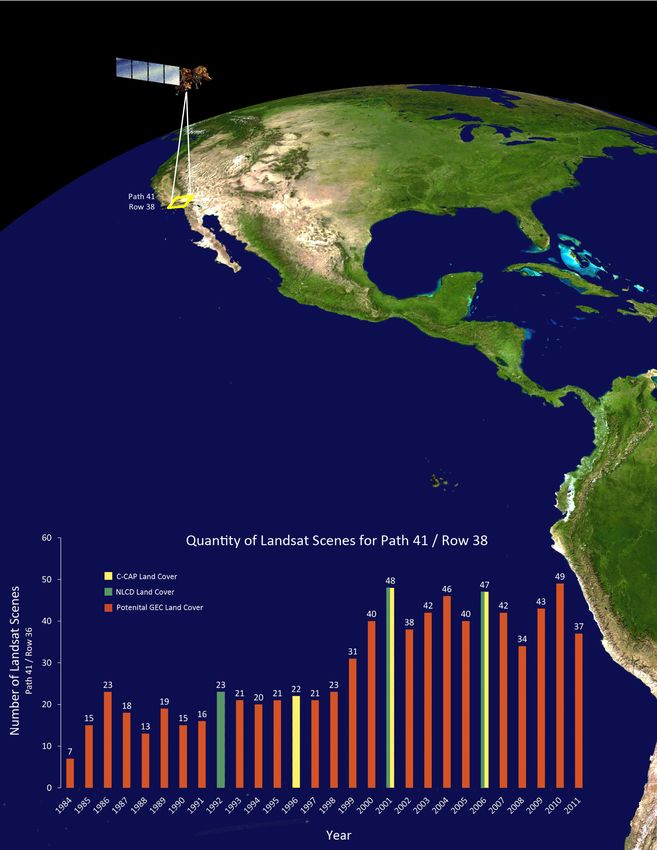
1. Land Cover Metrics - Data for Land Use
     Strategies
  2. Landsat Imagery - The Pre-Eminent Source for
		 Moderate-Resolution Land Cover
  3. Land Cover Classification Targeted to Local
		 Needs
  4. Coastal Southern California Case Study
  5. Landsat imagery - A Logical Choice for
     Standardized Global Land Cover
                                                                                                                         A

1. Land Cover Metrics - Data for Land Use
    Strategies

     Land cover metrics are measurements of Earth’s
land surface, including vegetation, geology, hydrology,
or anthropogenic features. Land cover data is capable
of providing direct and objective indications of land use
impacts on natural conditions. These measurements
are among the most significant and detectable indica-
tors of global ecological change (Figure 1).123 Land cover
directly impacts biological diversity4 while contributing
to local, regional, and global climate change.5
     Land cover measurements are acquired through                                                                        B
land surveys or remote sensing (RS). Historically, land
surveys were the primary source of data, however
remotely sensed data has become ascendant for land-
scape analysis. In the United States, the most ambitious
and comprehensive land survey efforts have been the
Natural Resource Inventory (NRI) conducted by the Nat-
ural Resource Conservation Service.6 This comprehen-
sive effort has provided excellent land cover statistics
for over 80 years, but it uses labor-intensive methods
for field data collection and it is inefficient compared to
remote sensing options. Additionally, remote sensing
provides information for the entire landscape, unlike
statistical sampling techniques used in field collection
for the NRI.                                                                                                             C
     In the United States, remote sensing has become          Figure 1 - Landsat imagery and classification. A) Visible spec-
the most practical, indispensable and timely method for       trum, B) Near and Mid-infrared (bands 4,5,3), and C) Land
producing land cover classifications. The USGS National       cover classification (generalized categories include: 3 urban
                                                              categories (white/gray), natural vegetation (shades of greens),
                                                              other landscape features such as water, open space, agricul-
                                                              ture, pasture, wetlands, etc.

                                                                                                                  MARCH 2012    3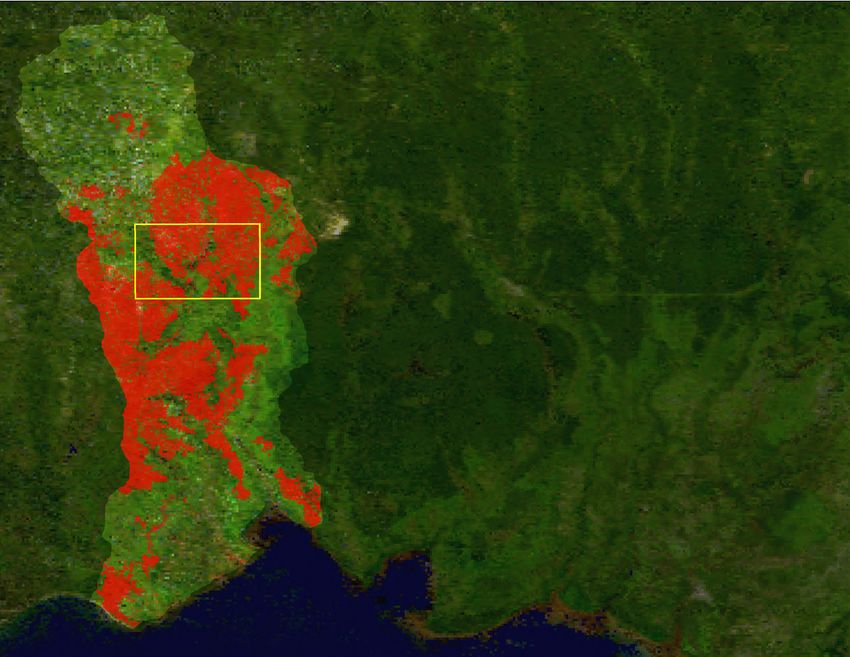
Remote Sensing & Classified Land Cover: Essential Land Use Decision Support Tools
Figure 4 GEC specializes in creating (updating or
backdating) classified land cover datasets from any
archived Landsat image.
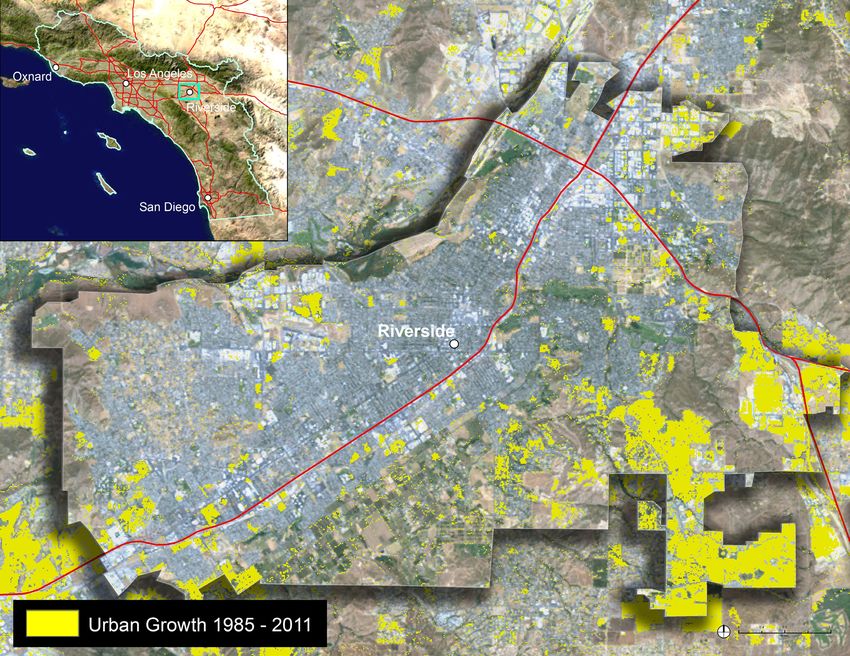
Figure 2 - By obtaining archived imag- Land Cover Database (NLCD) and NOAA Coastal Change Analysis Program
ery available from the the EROS Data (C-CAP) land cover classifications provide standardized land cover products
Center for 1985 and 2011 and conduct-
(Figure 2). These land cover classifications from remote sensing-derived
ing a change detection analysis, urban
grown can be visually displayed and metrics may be used as a proxy for biological indicators, allow real-time per-
calculated. The land cover classification spectives to follow the rate of landscape change and establish base line data
for 1985 and 2011 were standardized to for “change detection” and growth scenarios.7
the official C-CAP data set.
While remote sensing allows the production of land cover classifications
far more efficiently than land surveys, classification schemes require stan-
dardization for appropriate analysis and comparisons. The establishment
of a standardized scheme for an area as large as the United States requires
massive efforts involving the expertise from many agencies and institutions
and the commitment to a larger purpose. In the United States, this has
been completed by the formation of the Federal Geospatial Data Commit-
tee (FGDC) to coordinate the effort. Subsequently two Federal Agencies,
the USGS and NOAA have undertaken the production of land cover products
4 GLOBAL ECOSYSTEM CENTER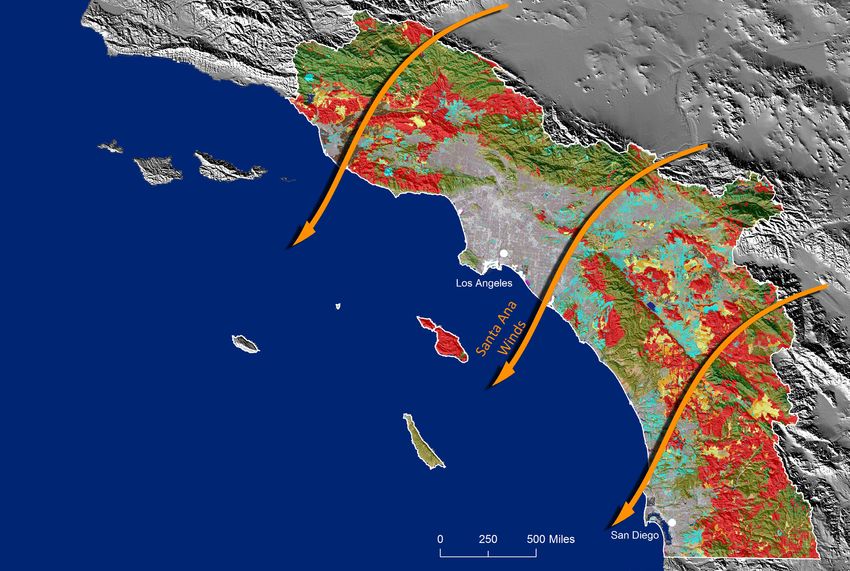
(NLCD and C-CAP). The products are now produced every five years and are
available to the public free of charge. These products not only provide plan-
ning agencies with high quality data, but also provide venerable data sourc-
es for the production of the intermediate land cover classifications needed
to fill the time spans between the production of the official data sets.

                                                                                 Figure 3 - The EROS Data Center uses a
2. Landsat imagery, The Pre-Eminent Source of Moderate-Resolution Land           convenient path/row system to archive
                                                                                 Landsat imagery. The satellites have a
Cover                                                                            consistent orbit which allows imagery
                                                                                 collection of any landmass on Earth
    Satellite imagery is generally grouped into three categories: high, mod-     every 16 days. The Landat series has
erate and low-resolution. The resolution of the image is determined by its       been obtaining 30-meter imagery since
                                                                                 1984 and has an archive of over 2.5
pixel size, generally ranging from less than a meter to more than a kilometer.   million images. The path/row system is
The focus of this paper is on moderate-resolution Landsat imagery which is       illustrated below.

                                                                                                            MARCH 2012    5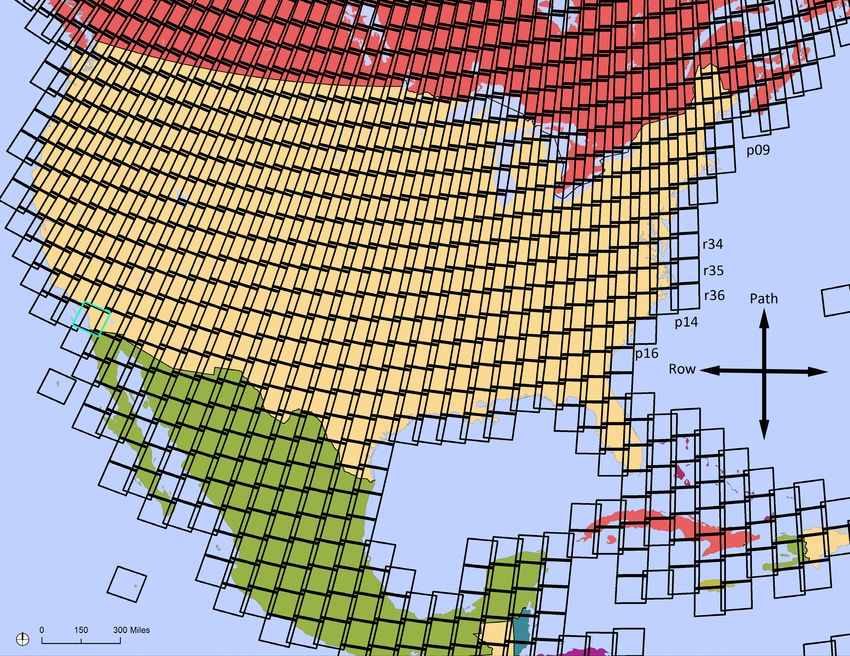
Remote Sensing & Classified Land Cover: Essential Land Use Decision Support Tools

      Extending National Land Cover Classifications

      Satellite imagery has permanently changed our
      understanding of Earth. The data collectors on the
      Landsat satellite’s are designed to identify relevant land cover
      objects collecting and archiving imagery since 1984. Unfortunately only
      about 1% of archived Landsat imagery of the United States has ever been classified
      into land cover categories. The historical data holds tremendous potential for under-
      standing and guiding future land use decisions.

      Figure 4 illustrates the immense imagery archive available by exhibiting the 790 images
      available for one location in Southern California (Path 41, Row 36) as of October, 2011.
      The imagery is especially valuable in the United States where standardized land cover
      classifications have been produced by NOAA and the USGS so private organizations like
      the GEC can utilize the archive to extend land cover analysis to cover 1984 to present.

6   GLOBAL ECOSYSTEM CENTER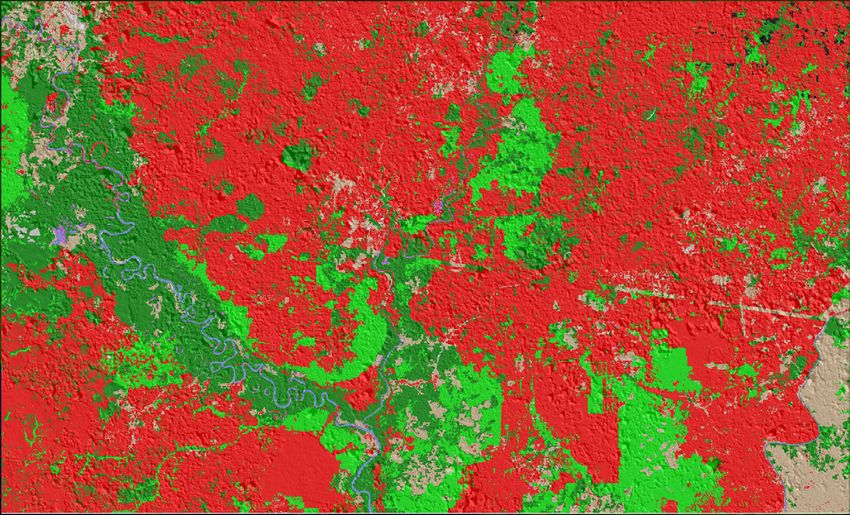
considered a pre-eminent data source for land cover      task of developing and maintaining land cover data
classification.                                          sets under the FGDC system. The USGS has produced
     Landsat satellites have acquired multi-band         National Land Cover Database (NLCD) classifications for
digital imagery of Earth’s surface for over three de-    1992, 2001, 2006 (technical issues exist with the 1992
cades, enabling the examination of changes caused        data) and NOAA has produced Coastal Change Analysis
by both natural processes and human practices.8          Program (C-CAP) classifications for 1996, 2001, 2006,
The specifications for data collection were devel-       and 2011. While both data sets use the same classifi-
oped by experts in land cover analysis, and in the       cation standard, C-CAP is primarily limited to coastal
case of Landsat, the goal was the documentation          areas and provides more detailed wetland categories.
of significant land cover objects. Landsat imagery is    These federally created data sets provide valuable and
collected in seven spectral bands at a 30-meter pixel    essential land use planning data. However, updates are
resolution, and it is designed to capture major land     periodic; the most recent land cover classifications are
features such as roads, bridges and buildings includ-    generally between 5 to 10 years old. Additional local
ing larger natural features.                             and regional land cover classifications are needed for
     While the Landsat satellite series has been         most land use decisions and local agencies can procure
providing continuous coverage of the Earth’s surface     necessary land cover classifications from private com-
since 1972, the collection system was upgraded with      panies with remote sensing expertise.
Landsat 4 in 1982 to provide the 30-meter resolu-
tion imagery. The data is now widely used to create
moderate-resolution land cover classifications.          3. Land Cover Classification Targeted to Local Needs
Imagery collected by the satellites is downloaded to
the Earth Resources Observation and Science (EROS)           The Global Ecosystem Center (GEC) specializes in
data center in Sioux Falls, South Dakota where it is     creating land cover classifications in accordance to
archived and available for use free of charge. The       FGDC standards. In the United States, these classifica-
image archive uses a path/row cataloging system          tions can be built upon existing national land cover
that allows easy navigation and acquisition (Figure      classifications provided by the USGS or NOAA. The
3). The extensive image library allows temporal          effort of the federal agencies is analogues to opening
comparison through the analysis of imagery during        the door to a huge library archive so that scholars can
different time periods. There is almost limitless po-    research the data, interpret and communicate find-
tential value of this data for documenting land cover    ings.
change and assisting land use decision-making.               With imagery available in the USGS archives, land
     While Landsat satellites collect data over land     cover classifications can be developed for any area in
masses globally, the potential for assisting land use    the United States and for any period between 1984 and
planning is most evident in the United States where      present. This data are especially valuable in the United
standardized land cover classification systems have      States where base classification schemes have been
been established by the Federal Geographic Data          developed. Additionally, the GEC has developed techni-
Committee (FGDC). This committee includes repre-         cal methods for connecting relevant ancillary data (soil
sentatives from relevant federal agencies in addition    type, rain fall, air quality etc.) to land cover classifica-
to experts from academia and private companies.          tions, allowing for ecosystem service calculations and
This standardized classification system provides         better decision-making. The calculations use models
technical guidelines for distinguishing land cover       that have been peer-reviewed and are widely used by
types as well as documenting critical land cover clas-   the scientific and engineering communities. Details
sification procedural steps.                             about the Global Ecosystem Center and the services it
     The USGS and NOAA are charged with the              provides are available at www.systemecology.org.

                                                                                                           MARCH 2012   7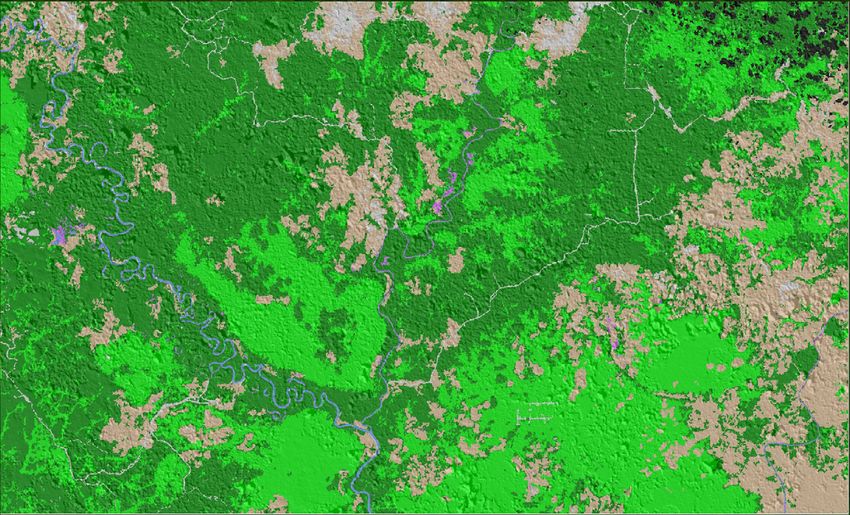
Remote Sensing & Classified Land Cover: Essential Land Use Decision Support Tools

    Featured Case Study - Coastal Southern California

         Coastal Southern California is a large, highly populated region of Califor-
    nia in the United States. The two largest cities and metropolitan areas are
    Los Angeles and San Diego. The urban area stretches along the coast from
    the northern suburbs of Los Angeles to the border with Mexico. Coastal
    Southern California is a major economic center for the state of California
    and the nation.
         The landscape of this area has undergone considerable change over the
    last quartercentury; much of the original natural system has been replaced
    by a human network. Data collected by Landsat satellites has recorded these
    changes and archived the imagery for evaluation.
         The GEC obtained archived imagery from 1984 and 2011 and the result-
    ing classification extended the analysis period from 10 years to 27 years.
    Standardized land cover classifications have numerous practical implications
    when extended over longer time frames. Some of the specific applications
    of the data for land use planning, natural resource management, and vulner-
    ability assessments is outlined in the sidebar that follows this one page case
    study overview.

                                  Figure 5 - Land cover change
                                  and fire hazard areas super-
                                  imposed on a land cover base
                                  map. Generally, most urban
                                  developments (turquoise) are
                                  near high fire risk areas. Santa
                                  Ana winds often make it very
                                  difficult to control fires.

8   GLOBAL ECOSYSTEM CENTER                                                             MARCH 2012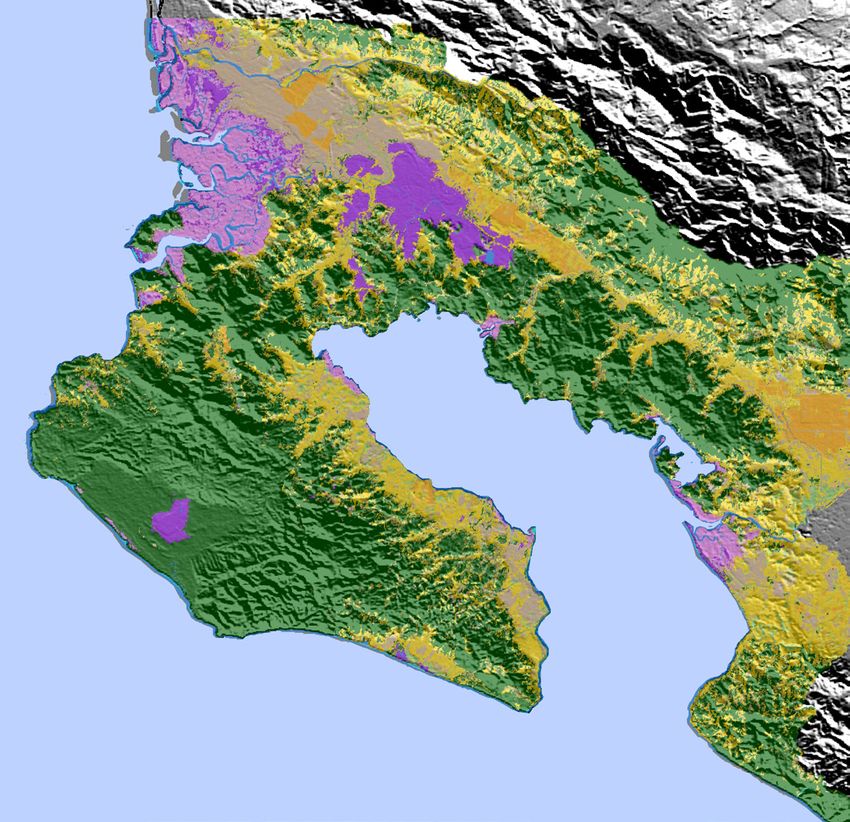
Water                                                  experienced the highest rates urban growth and
     Water is a valuable and scarce resource           that most of these new developments are now in
in the Southern California region and natural          areas of significant wildfire risk.
vegetation affects water supply. The land cover
this region was accurately measured using              Growth Models and Projections (Scenario Model-
archived Landsat imagery and the official land         ing)
cover terminology developed by the FGDC. The                California is expected to grow from 35 million
analysis showed there has been a considerable          to approximately 45 million residents by 2020.
increase in impervious surfaces and consider-          Since 1990, the population of the Southern Califor-
able loss in vegetation. Apart from precipitation,     nia region has expanded from 14.6 million to 16.5
evapotranspiration is one of the largest outflow       million – an increase of 12.8%.
components of the hydrologic cycle, particularly            A scenario modeling algorithm in the Urban
in arid areas.9                                        Ecosystem Analysis methodology calculates the
     As natural vegetation decreases relative to       impact of land cover change on natural systems.
impervious surfaces, evapotranspiration rates          The impact of past growth can be determined using
are acceler-ated increasing the water needs for        archived imagery from 1985, 1996, 2001, 2005,
the remaining plants. Impervious surfaces cou-         and 2011. Using this historical data a trend analysis
pled with urban drainage systems alter natural         can be constructed and future land cover and the
hydrology by increasing stormwater runoff and          associated ecosystem services calculated for 2020
reducing groundwater recharge. The negative            (Table 1).
results are more frequent flooding, higher flood            The trend data shows that the scrub area (sage
peakflow, lower base flow in streams, and lower        and chaparral) will decrease by over 2.% between
water table levels.10                                  2011 and 2020. An Urban Ecosystem Analysis of
                                                       the area estimates stormwater flow will increase
Fire Hazards                                           by over 3.5 billion cubic ft2 during this time, and
     While wild land fires are part of the natural     conversely water infiltration will decrease by the
system in this region, the expansion of man-           same amount. Increasing stormwater and decreas-
made developments into fire-prone lands has            ing infiltration is a critical water conservation issue
dramatically increased the number of fires and         for the arid Southwest United States now and the
the risk of serious damage. Most of Southern           conditions are expected to intensify over the next
California is at risk of damage from wild fire         decade.
in the native chaparral and sage and that risk              Detailed information on specific watersheds
is increasing due to the enduring drought and          can be obtained by selecting 12 digit watersheds
residential encroachment into wild land. Wildfire      for analysis and using high-resolution imagery as
risk will increase in southern California as well as   the land cover data source.
in the western United States in the coming years.
This risk can be reduced by using land cover
imagery to identify the least hazardous areas for
urban expansion and preventing fragmentation
of large blocks of natural areas. Figure 5 shows
fire hazard areas and their proximity to urban de-
velopments.
     Trend analysis over 27 years demonstrates
the region between Los Angeles and San Diego

                                                                                                    MARCH 2012   9
Remote Sensing & Classified Land Cover: Essential Land Use Decision Support Tools

     Figure 6 - San Diego sub-basin has experienced growth
     in urbanized areas over past two decades as new homes
     are scattered into scrubland chaparral fragmenting the
     natural, fire-prone landscape.

     Table 1 - San Deigo Watershed - An Urban Ecosystem Analysis demonstrates the impact of increasing impervious surfaces
     stormwater.
              Air Pollution        Air Pollution     Carbon            Carbon       Stormwater Runoff       Stormwater Benefits
       Year    Removal            Removal Value       Stored         Sequestered        Reduction*             @ $2 per cu.ft
                (lbs/yr)                ($)           (tons)            (tons)            (cu.ft)                   ($)
       1985   79,519,452          221,908,930       31,724,659         246,985         2,451,805,525           4,903,611,050
       1996   83,217,494          232,228,778       33,200,010         258,471         2,686,347,533           5,372,695,066
       2001   82,989,740          231,593,201       33,109,147         257,764         2,692,532,618           5,385,065,235
       2005   82,704,033          230,795,901       32,995,163         256,876         2,719,732,078           5,439,464,155
       2011   79,461,572          221,747,405       31,701,567         246,805         2,548,924,655           5,097,849,310
       2020** 82,165,608          229,293,360       32,780,356         255,204         6,007,815,263          12,015,630,526

       * Stormwater Runoff Reduction = If existing land cover replaced to Impervious Surfaces: Buildings/Structures
       ** Scenario of -2% Shrub to Urban Residential, rest of the categories remain that of 2011

10   GLOBAL ECOSYSTEM CENTER
Case Study - Kalimantan, Indonesia
Indonesian, Kalimantan and Malaysian, and Borneo comprise the third
largest island in the world. It’s geographic location is in the South China Sea
and ecologically it houses rich tropical forest, peatlands, and extensive biodi-
versity including threatened animal species like orangutans, elephants, and
tigers.
Extensive illegal logging has removed over half of the island’s forest cover
which often grows over peatlands 10 to 12 meter deep. Once the forests are
removed, the land is drained for farming and the peatland is burned releasing
massive amounts of CO2 into the air causing Indonesia to be the third largest
emitter of CO2.
Below classified land cover images processed by the Global Ecosystem
Center reveal the extent of forest and peatland loss between 1985 and 2010.
The source of the imagery is the Landsat satellite series.
1989
2010
MARCH 2012 11Remote Sensing & Classified Land Cover: Essential Land Use Decision Support Tools
Case Study - Goiânia, Brazil
Goiânia is a planned city founded in 1933 and was designed for a
population of 50,000 inhabitants. Currently, it has a metropolitan area over
1.5 million people. Illegal or informal settlements have recently appeared,
with 7,000 housing units located in environmentally hazardous areas.16
These include river banks and places subject to periodic flooding. Slum
settlements have been overwhelmingly built in these sensitive watershed
areas.
An analysis of Landsat satellite images between 1985 and 2011
reveal the extensive growth and development of the Goiânia metropolitan
area. The raw data was obtained from archived Landsat imagery available
through the USGS, and processed into eight land cover categories.
The land cover data was used by GeoAdaptive to assist land use
planners in the city with growth and development planning.
1985 Spectral (4,5,3) 1985 Classified 2011 Spectral (4,5,3) 2011 Classified
12 GLOBAL ECOSYSTEM CENTERCase Study - Osa Peninsula, Costa Rica
The Osa Peninsula is located in southwestern Costa Rica surrounded by the
Pacific Ocean. It is one of the most biologically diverse places on Earth and
home to at least half of the species found in Costa Rica. Most of the area is
undeveloped tropical forests and wetlands, although a portion of the natural
wetlands has been converted to rice production.
The Global Ecosystem Center used the Landsat archive to obtain imagery
from 1985, 2000 and 2011. The imagery was processed by the image ana-
lysts. Electronic bands were combined to form a spectral image. These
non-visible wavelengths (near infrared, thermal etc) allow the landscape
to be classified into discrete land cover using spectrometry. This land cover
classification revealed 14 discrete land cover categories following guidelines
provided by the local government. Below are the land cover classes identi-
fied from the imagery in 2011.
This classification was conducted by image analysts at the Global Ecosystem
Center using Erdas Imagine and See5.
2011 Spectral 2011 Classified
MARCH 2012 13Remote Sensing & Classified Land Cover: Essential Land Use Decision Support Tools
4. Conclusion: conditions and identify trend lines that foresee the
future. The data available from moderate resolution
Land cover change may be the most significant satellites can provide decision-makers with the data
agent of global change; it has a significant influence they need to make good decisions today that can
on climate, hydrology, and global bio-geochemical improve the future.
cycles. Arguably, over the next 20 to 50 years, land Remotely sensed land cover data provides deci-
cover change will have a more direct influence on sion makers with a complete set of facts allowing
human habitability than climate change. In ad- them to accurately analyze growth and develop-
dition to its importance as an input variable to ment. With the use of engineering algorithms, eco-
other areas of global change research, it is also an logical services can be calculated and future trends
important area of study in its own right. Land cover forecast. Putting dollar values to ecosystem services
is an issue with far-reaching policy implications on helps make technical data relevant to public policy
international, national, national and local scales. makers.
Land cover change is inextricably linked to policy, Remotely sensed land cover produces data that
sustainable development, and a wide range of allow us to accurately remember the past, evalu-
research. ate present, and predict the future. It allows view-
Remote Sensing technology and land cover ing land cover changes and trends at various scales
data are an essential part of land use decisions. from sections of a county, to entire continents or
Data derived from moderate resolution satellite even to global scales. The Global Ecosystem Center
imagery, collected by the Landsat satellite series, specializes in land cover classification from remotely
provides extensive data describing the landscape sensed imagery and has the capacity to translate
(land cover) over the last 30 years. Furthermore, an the archived Landsat images to highly accurate land
extensive archive of moderate resolution Landsat cover data and even help decision makers quantify
satellite data is available from the USGS at no cost. the ecosystem services provided by the land.
It can be obtained over the internet and converted
into standardized land cover categories for use in
geo-graphic information systems. Unfortunately,
the potential of this data to improve land use deci-
sions has barely been tapped. Two problems seem
to exist 1) decision makers are unaware of the data
and 2) lack of expertise in processing the imagery.
Over the past 27 years, the Landsat satel-
lite series has scanned hundreds of images over
every part of the world and over two and a half
million images are available for public use in the
archives. The Landsat satellite completes a cycle
of the entire globe every 22 days and downloads
digital files to facilities on the ground. These data
have tremendous potential for helping people ad-
dress some of the world’s greatest ecological and
environmental challenges. These data allow us to
accurately measure conditions in the past as well
as the present. With this data it is possible to quan-
tify ecological changes between past and present
14 GLOBAL ECOSYSTEM CENTER1 Turner, M.G., 1990. Landscape changes in nine rural counties in Georgia,
ENDNOTES Photogrammetric Engineering and Remote Sensing 56(3): 379-386
2 Lambin EF, Baulies X, Bockstael N, Fischer G, Krug T, Leemans R, Moran
EF, Rindfuss RR, Sato Y, Skole D, Turner II BL, Vogel C. 1999. IGBP Report
No 48 and IHDP Report No 10: Land-use and Land-cover Change (LUCC):
Implementation Strategy. Stockholm, Sweden: International Geosphere-
Biosphere Programme (IGBP); Bonn, Germany: International Human
Dimensions Programme on Global Environmental Change (IHDP).
3 Di Gregorio A. 2005. Land Cover Classification System (LCCS), Version
2:Classification Concepts and User Manual. FAO Environment and
Natural Resources Service Series, No 8. Rome, Italy: Food and Agriculture
Organization
4 Sala OE, Vitousek PM. 1994. Beyond global warming: Ecology and global
change. Ecology 75:1861–1876.
5 Brovkin, V.; Claussen, M.; Driesschaert, E.; Fichefet, T.; Kicklighter, D.;
Loutre, M. F.; Matthews, H. D.; Ramankutty, N.; Schaeffer, M.; Sokolo. 2006
Biogeophysical effects of historical land cover changes simulated by six Earth
system models of intermediate complexity. Climate Dynamics, 6.
6 Harlow, J., 1994. History of Soil Conservation Service National Resource
Inventories Resources, Natural Resource Conservation Service.
7 Landscape and Urban Planning 94 (2010) 158–165
8 landsat.gsfc.nasa.gov
9 Hanson, R.L, 1991, Evapotranspiration and Droughts, in Paulson, R.W., Chase,
E.B, Roberts, R.S., and Moody, D.W, Compilers, National Water Summary
1988-1989—Hydrologic Events and Floods and Droughts: U.S. Geological
Survey Water-Supply Paper 2375, p 99-104
10 The Impacts of Impervious Surfaces on Water Resources. The New Hampshire
Estuaries Project, University of New Hampshire, Hewitt Annex 2007
11 Technical Background Report to the 2003 Safety Element, City of Glendale,
California, Earth Consultants International
12 California Fire Hazard Severity Zone Map Update Project. California
Department of Forestry and Fire Protection. http://www.fire.ca.gov/fire_
prevention/fire_prevention_wildland_statewide.php
13 California 2020 Projected Urban Growth 2010. http://koordinates.com/
layer/670-california-2020-projected-urban-growth/
14 Census Data. Southern California Association of Governments. http://
koordinates.com/layer/670-california-2020-projected-urban-growth/
15 Skole, D.L., Justice, C.Townshend, J.R.G.Janetos, A. 1997. A Land Cover
Change Monitoring Program: Strategy for an International Effort. Mitigation
and Adaptation Strategies for Global Change. Vol 2. Issue 2.
16 http://www.citiesalliance.org/ca/sites/citiesalliance.org/files/CA_Docs/
resources/cds/liveable/goiania.pdf
MARCH 2012 15Remote Sensing & Classified Land Cover: Essential Land Use Decision Support Tools
Also available:
GLOBAL ECOSYSTEM CENTER www.systemecology.org
Essential Land Use Decision
Support Tools Using High-Resolution Remote Sensing & Classified Land Cover
Imagery Essential Land Use Decision Support Tools Using
High-Resolution Imagery
MARCH 2012
Gary Moll, President
Kenneth Kay, Geospatial Specialist
Binesh Maharjan, Geospatial Specialist
1607 22nd St. NW, Washington, DC 20008
Phone: 202.290.3530
Fax: 202.683.6729
http://www.systemecology.org
16 GLOBAL ECOSYSTEM CENTERYou can also read