Application of Drone and WorldView-4 Satellite Data in Mapping and Monitoring Grazing Land Cover and Pasture Quality: Pre- and Post-Flooding - MDPI
←
→
Page content transcription
If your browser does not render page correctly, please read the page content below
land
Article
Application of Drone and WorldView-4 Satellite Data in
Mapping and Monitoring Grazing Land Cover and Pasture
Quality: Pre- and Post-Flooding
Clement E. Akumu *, Eze O. Amadi and Samuel Dennis

                                          Department of Agricultural and Environmental Sciences, College of Agriculture, Tennessee State University,
                                          Nashville, TN 37209, USA; eemadi@tnstate.edu (E.O.A.); sdennis@tnstate.edu (S.D.)
                                          * Correspondence: aclemen1@tnstate.edu; Tel.: +1-615-963-5616; Fax: +1-615-963-7798

                                          Abstract: Frequent flooding worldwide, especially in grazing environments, requires mapping and
                                          monitoring grazing land cover and pasture quality to support land management. Although drones,
                                          satellite, and machine learning technologies can be used to map land cover and pasture quality,
                                          there have been limited applications in grazing land environments, especially monitoring land
                                          cover change and pasture quality pre- and post-flood events. The use of high spatial resolution
                                          drone and satellite data such as WorldView-4 can provide effective mapping and monitoring in
                                          grazing land environments. The aim of this study was to utilize high spatial resolution drone and
                                          WorldView-4 satellite data to map and monitor grazing land cover change and pasture quality pre-
                                          and post-flooding. The grazing land cover was mapped pre-flooding using WorldView-4 satellite data
                                          and post-flooding using real-time drone data. The machine learning Random Forest classification

                                   algorithm was used to delineate land cover types and the normalized difference vegetation index
                                          (NDVI) was used to monitor pasture quality. This study found a seven percent (7%) increase in
Citation: Akumu, C.E.; Amadi, E.O.;
                                          pasture cover and a one hundred percent (100%) increase in pasture quality post-flooding. The drone
Dennis, S. Application of Drone and
WorldView-4 Satellite Data in
                                          and WorldView-4 satellite data were useful to detect grazing land cover change at a finer scale.
Mapping and Monitoring Grazing
Land Cover and Pasture Quality: Pre-      Keywords: drone and satellite data; mapping grazing land cover change; flood event
and Post-Flooding. Land 2021, 10,
321. https://doi.org/10.3390/
land10030321
                                          1. Introduction
Academic Editor: Kirsten de Beurs              Flooding is becoming a frequent event in grazing land environments, especially with
                                          the changing climate. The response of grazing land cover to flooding events is complex
Received: 18 February 2021
                                          and could be depended on several factors such as duration of flooding, plant species
Accepted: 17 March 2021
                                          present, stand age, pasture vigor, stage of plant species development, and temperature [1,2].
Published: 20 March 2021
                                          For example, flooding that consists of standing water can be more harmful to grazing land
                                          cover such as pasture than flood moving water. This is because oxygen uptake during
Publisher’s Note: MDPI stays neutral
                                          flood events by plant roots is severely restricted in standing water relative to moving water.
with regard to jurisdictional claims in
                                          Furthermore, standing water can also reduce the nutrient uptake of plants thereby affecting
published maps and institutional affil-
                                          pasture quality [3]. In addition, during a standing flood event, sediment deposit increases,
iations.
                                          and this can suffocate plants thereby leading to a substantial loss in grazing land cover [2].
                                          High-velocity flood water can also cause erosion, uproot trees, destroy natural levees, and
                                          affect vegetation cover thereby being a driving force of land cover and land-use change [4].
                                               The use of high spatial resolution remotely sensed data from drones and satellites
Copyright: © 2021 by the authors.
                                          such as WorldView-4 can provide effective mapping and monitoring of grazing land
Licensee MDPI, Basel, Switzerland.
                                          environments. This is because high-resolution drones and satellites have the capability
This article is an open access article
                                          of capturing images at a finer scale. Furthermore, real-time drone images can be easily
distributed under the terms and
                                          acquired over grazing land areas in less time. In addition, drones and satellite data are
conditions of the Creative Commons
Attribution (CC BY) license (https://
                                          increasingly becoming less costly relative to field surveys for the mapping and monitoring
creativecommons.org/licenses/by/
                                          of grazing land cover and pasture quality. Moreover, a plant’s vigor and health in grazing
4.0/).
                                          land environment can be easily monitored using drones and satellite vegetation indices

Land 2021, 10, 321. https://doi.org/10.3390/land10030321                                                        https://www.mdpi.com/journal/land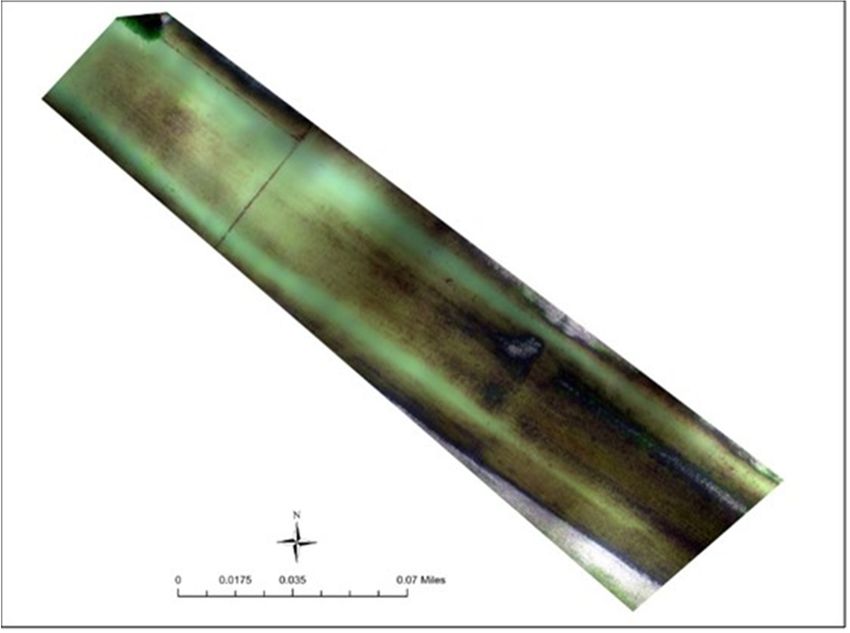
Land 2021, 10, 321                                                                                           2 of 13

                     including the normalized difference vegetation index (NDVI). The NDVI is a widely used
                     vegetation quality index that is computed as the difference between near-infrared (NIR)
                     and red reflectance divided by their sum [5,6]. The plant chlorophyll, which is a vital health
                     indicator, strongly absorbs the visible red light of the electromagnetic spectrum, and the
                     cellular structure of the leaves strongly reflects the near-infrared light. When the plant
                     becomes stress through dehydration, lack of nutrients, and afflicted with diseases, the leaf
                     structure deteriorates and the plant absorbs more of the near-infrared light rather than
                     reflecting it. Therefore, examining how the near-infrared light changes relative to red light
                     from plants in a multispectral remotely sensed image provides a better indication of the
                     presence of chlorophyll which correlates with plant health and quality [6].
                          Some recent studies have used drones and WorldView series satellite data in mapping
                     and monitoring grazing land environments [7–11]. Wiesmair et al. [9] used multispec-
                     tral WorldView-2 satellite data to monitor vegetation cover in pasture grassland. Their
                     vegetation cover map using WorldView-2 satellite data showed large areas of grassland
                     degradation. Furthermore, Romoelo et al. [11] monitored pasture nutrients as indicators
                     of rangeland quality using WorldView-2 satellite data. They found WorldView-2 spectral
                     vegetation indices as useful variables in monitoring vegetation nutrients in grazing land
                     environments. In addition, Michez et al. [8] mapped and monitored biomass in grazing
                     land environments using drones. They found drones to be useful in grazing land cover
                     mapping and characterizing pasture conditions.
                          Other studies have used NDVI as a measure of pasture quality and health [12–14].
                     Falldorf et al. [12] used NDVI and other vegetation indices to predict the quality of winter
                     pastures for reindeer and caribou in the circumpolar region. They found NDVI useful to
                     improve species’ management and conservation. Furthermore, Ndungu et al. [14] utilized
                     NDVI as a measure in monitoring the quality and changes in vegetation and evaluating
                     proxies for drought conditions in Kenyan rangelands. In addition, NDVI has also been
                     used to estimate above-ground biomass in pastures [15–18]. For example, Theau et al. [15]
                     used green NDVI in a regression prediction model to estimate the biomass of a pasture.
                     Furthermore, Meshesha et al. [16] developed a relationship between NDVI and field plot
                     datasets of above-ground biomass in pastures to estimate spatial aboveground rangeland
                     biomass. They found NDVI useful in the estimation of aboveground forage biomass.
                          In addition to remotely sensed data and derived indices in pasture monitoring, machine
                     learning technology applications for unmanned aerial vehicles (UAVs) in land cover and
                     pasture quality mapping have also been utilized [19–23]. For example, Sandino et al. [20]
                     used machine learning algorithms and drones to monitor invasive grasses and vegetation
                     in remote arid lands. They detected and generated a pixel-wise segmentation of invasive
                     grasses, using buffel grass (Cenchrus ciliaris) and spinifex (Triodia sp.) as examples. They
                     found an individual detection rate of 97% for buffel grass and 96% for spinifex, with a
                     global multiclass pixel-wise detection rate of 97%. However, this study did not monitor the
                     quality of invasive grasses. Furthermore, Barnetson et al. [23] used drones and machine
                     learning-based predictive models to map pasture quantity (biomass) and quality as the
                     proportions of key pasture nutrients, across a selected range of field sites throughout the
                     rangelands of Queensland. They found machine learning techniques useful to efficiently
                     and accurately map pasture yield and quality at the field site scale.
                          Although drones, WorldView series satellite data, NDVI, and machine learning tech-
                     nology applications have been used in land cover and pasture quality mapping, there
                     has been limited application in monitoring grazing land cover types and pasture quality
                     pre-and post-flooding, especially in Tennessee. For example, do grazing land cover types
                     and pasture quality change pre- and post-flooding events? This study aims to map and
                     monitor grazing land cover and pasture quality pre- and post-flooding that occurred from
                     21st to the 26th of February, 2019, in Middle Tennessee, United States.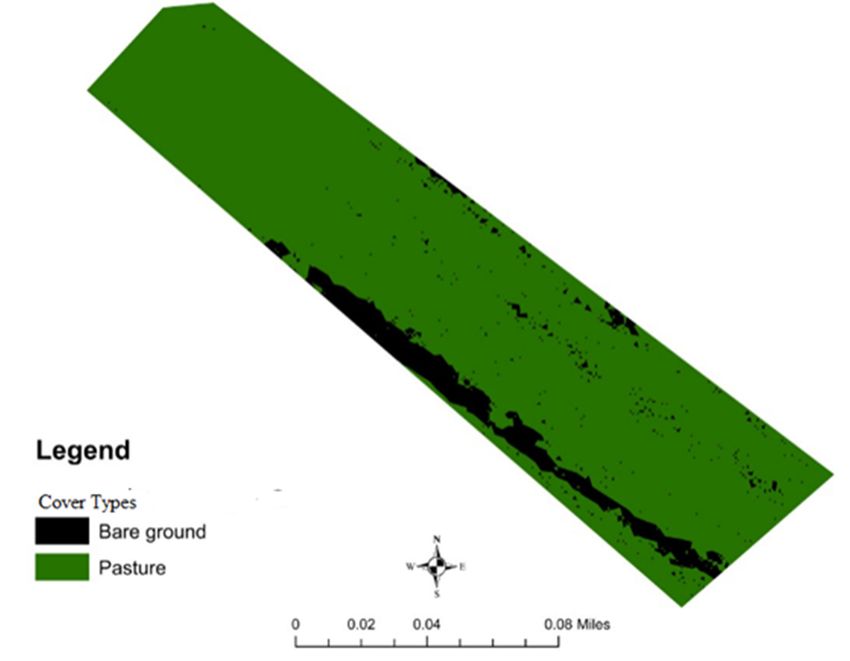
Land 2021, 10, 321                                                                                            3 of 13

                     2. Materials and Methods
                     2.1. Study Area
                          This study area is located in Cheatham County, middle Tennessee (Figure 1). The
                     county seat is Ashland City and is part of the Nashville-Davidson-Murfreesboro-Franklin,
                     Tennessee Metropolitan Statistical area [24]. The grazing land location is close to the
                     Cumberland River and is prone to flooding with an elevation of about 120 m above sea
                     level. It is one of Tennessee State University’s farmland and beef cattle research stations
                     with more than 10 dexter cattle grazing on the land. The cattle grazing pattern on the land
                     is non-rotational.

                     2.2. Climate
                          The middle Tennessee region has a modest climatic condition with cool winter and
                     warm summers [25]. The mean annual temperature in the region is 78 ◦ F (26 ◦ C) in summer
                     and around 41 ◦ F (5 ◦ C) in winter. The yearly precipitation is about 51 inches (1300 mm)
                     and is generally distributed evenly throughout the seasons [25]. The maximum monthly
                     average precipitation (approximately 5.51 inches) usually occurs in the month of May
                     and the minimum monthly average precipitation (about 3.03 inches) generally occurs in
                     October [26]. Middle Tennessee generally experiences flooding from excessive rainfall that
                     forces the Cumberland River and several others to go over their banks.

                     2.3. Geology, Soil, and Hydrology
                           The study area consists of a combination of gentle and highland terrains [25]. The
                     highlands usually have acidic soils that are heavily leached, whereas the surrounding
                     central basin is underlain by Ordovician limestone and has alkaline soils [27]. The gentle
                     terrain and highlands are occasionally cut across by major rivers such as the Cumberland
                     River which flows southwards [27]. The soil type in the grazing land environment is
                     Melvin silt loam, which is frequently flooded [28]. It is a very deep, nearly level, and poorly
                     drained soil along the Cumberland River. The soil surface layer (0–10 inches) is brown
                     silt loam that has reddish-brown and grayish brown mottles. The soil has a moderate
                     permeability and high available water capacity. Many of the streams in the region have
                     been channelized to enhance drainage of adjacent wetlands for agricultural purposes.
                     This has led to increasing downstream deposition of sediment thereby contributing to
                     downstream flooding [29]. For example, in 2019, excessive rainfall occurred in Middle
                     Tennessee that caused flooding and standing water that covered on average about 75%
                     of the study area from 21st to the 26th of February 2019 (Figure 2). The standing water
                     occupied about 100% of the area on 21st and 24th of February 2019; around 50% of the area
                     on 25th of February and approximately 20% of the area on 26th of February 2019.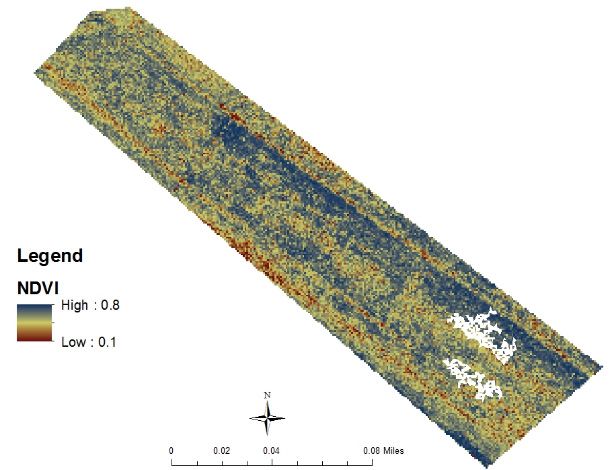
Land 2021, 10, 321                                                                                                                 4 of 13
  Land 2021, 10, x FOR PEER REVIEW                                                                                                4 of 15

                                  Figure1.1.The
                                 Figure      Thelocation
                                                 locationof
                                                         ofthe
                                                            the study
                                                                 study area
                                                                       area showing
                                                                            showing aa drone
                                                                                       drone aerial
                                                                                             aerial image
                                                                                                    image of
                                                                                                          of the
                                                                                                             the grazing
                                                                                                                 grazing land
                                                                                                                          land area.
                                                                                                                               area.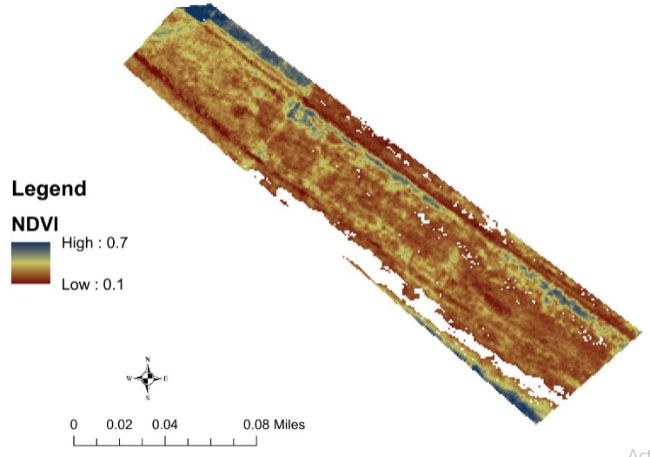
channelized to enhance drainage of adjacent wetlands for agricultural purposes. This has
led to increasing downstream deposition of sediment thereby contributing to downstream
flooding [29]. For example, in 2019, excessive rainfall occurred in Middle Tennessee that
caused flooding and standing water that covered on average about 75% of the study area
Land 2021, 10, 321 from 21st to the 26th of February 2019 (Figure 2). The standing water occupied about 100% 5 of 13
of the area on 21st and 24th of February 2019; around 50% of the area on 25th of February
and approximately 20% of the area on 26th of February 2019.
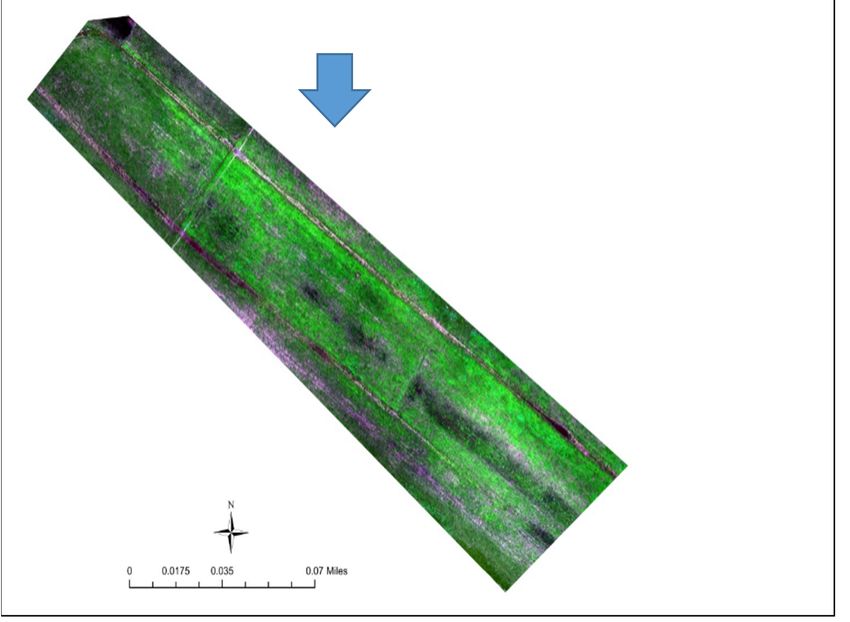
Figure
Figure 2. Drone 2. Drone
image imageflood
of standing of standing flood wateronoccupying
water occupying on average
average about 75% ofabout 75% area
the study of thefrom
study area
21st to the 26th of
from 21st to the 26th of February 2019.
February 2019.
3. Methodology
3.1. Mapping and Monitoring of Grazing Land Cover and Pasture Quality
The approach of mapping and monitoring grazing land cover pre- and post-flooding
mainly involved the pre-processing, classification, and mapping of grazing land cover
types using WorldView-4 satellite and drone data (Figure 3). The monitoring of pasture
quality pre-and post-flooding was carried out using NDVI.
3.2. WorldView-4 Satellite Data
A scene of WorldView-4 satellite data covering the study area acquired on 17th
November 2018 was used to map grazing land cover types pre-flooding. The WorldView-4
satellite data has a multispectral spatial resolution of 1.24 m and four spectral bands (blue,
green, red, near-infrared), and a panchromatic band. The pre-processing of the WorldView-
4 satellite data involved radiometric correction, geometric correction, resampling, and
co-registration with drone aerial images. The radiometric calibration requires the correction
of image pixel values for sun elevation angle variation and image calibration to account for
sensor degradation over time. The changes in sensor calibration factors will obscure real
changes on the ground [30]. The radiometric calibration was carried out by the conversion
of digital number (DN) to at-surface reflectance using Equations (1) and (2) [31]. The
geometric correction was carried out using greater than 50 ground control points and a root
mean square (RMS) value of lower than 1 pixel. Furthermore, the 1.24 m spatial resolution
WorldView-4 satellite imagery was resampled to an 8 cm image and co-registered to the
8 cm spatial resolution drone image.
3.3. Conversion of DN to Radiance
The top-of-atmosphere radiance, L, in units of W µm−1 m−2 sr−1 , is generated by
converting from DN using Equation (1) [31].
L = GAIN * DN (abscalefactor/effectivebandwidth) + OFFSET (1)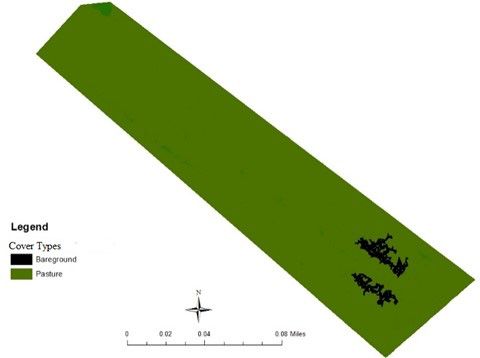
Land 2021, 10, x FOR PEER REVIEW                                                                                          6 of 15
Land 2021, 10, 321                                                                                                       6 of 13

                                 3. Methodology
                                where;
                                 3.1. Mapping and Monitoring of Grazing Land Cover and Pasture Quality
                                      the DN is the pixel value found in the imagery,
                                       The approach of mapping and monitoring grazing land cover pre- and post-flooding
                                      the abscalefactor and effectivebandwidth are delivered in the imagery metadata for
                                 mainly involved the pre-processing, classification, and mapping of grazing land cover
                                each band,
                                 types using WorldView-4 satellite and drone data (Figure 3). The monitoring of pasture
                                      the GAIN = 1, and OFFSET = 0, represented the absolute radiometric calibration band
                                 quality pre-and post-flooding was carried out using NDVI.
                                dependent adjustment factors [31].

                                     Figure3.3.AAschematic
                                    Figure        schematicrepresentation
                                                            representationofofthe
                                                                               themethodology.
                                                                                   methodology.

                                 3.2.Conversion
                                3.4.  WorldView-4  Satellite Data
                                                of Radiance  to Top-of-Atmosphere Reflectance
                                      A scene
                                     The         of WorldView-4
                                          top-of-atmosphere      satellite
                                                             radiance      data covering
                                                                       is transformed     the study area acquired
                                                                                       to top-of-atmosphere          on 17th
                                                                                                              reflectance    No-
                                                                                                                          using
                                 vember 2018
                                Equation         was used to map grazing land cover types pre-flooding. The WorldView-4
                                           (2) [31].
                                 satellite data has a multispectral
                                                          RTOA = (π   ×L×
                                                                    spatial   d2 )/(ESUN
                                                                            resolution    i × cos
                                                                                       of 1.24 m and
                                                                                                  (z)) four spectral bands (blue,
                                                                                                                             (2)
                                 green, red, near-infrared), and a panchromatic band. The pre-processing of the
                                where;
                                 WorldView-4 satellite data involved radiometric correction, geometric correction,
                                     RTOA = top-of-atmosphere reflectance
                                 resampling, and co-registration with drone aerial images. The radiometric calibration re-
                                     L = top-of-atmosphere radiance
                                 quires the correction of image pixel values for sun elevation angle variation and image
                                     π = ≈3.14159
Land 2021, 10, 321 7 of 13
ESUNi = the mean solar exoatmospheric irradiance for each band
d = the earth-sun distance, in astronomical units,
z = solar zenith angle (zenith angle = 90—solar elevation angle from IMD file).
3.5. Drone Data
The drone aerial images were acquired post-flooding on 23rd of April 2019 using a
Phantom 4-Pro drone with MicaSense RedEdge-M multispectral camera system onboard.
The drone was flown at 100 m altitude and with a speed of 3 m/s using the Drone Deploy
application. The MicaSense RedEdge-M multispectral camera system captures images in
the five spectral bands i.e., blue, green, red, near-infrared, and RedEdge. The MicaSense
RedEdge-M camera was triggered to take an image every 2 s and more than a thousand
images with a spatial resolution of 8 cm were acquired. The camera was connected
to a global positioning system (GPS) data and a downwelling light sensor (DLS). The
GPS data was made available to the camera to allow the RedEdge-M camera system to
properly geotag images and self-trigger. The downwelling light sensor is a 5-band incident
light sensor that measures the ambient light during a flight for each of the five bands of
the camera and records the information to the metadata of the Tag Image File Format
(TIFF)F images captured by the camera. This information can be used to correct global
lighting changes during flights such as clouds covering the sun. The captured drone
images were pre-processed by mosaicking, geometric correction, radiometric correction,
and co-registration. The drone images were geotagged and automatically mosaicked in
Pix4d mapper version 4.5. The radiometric correction was performed by using calibrated
reflectance panel images acquired before and after each flight to generate reflectance drone
images. Furthermore, geometric correction was carried out using greater than 50 ground
control points and an RMS value of lower than 1 pixel. The mosaicked drone imagery was
co-registered with the resampled 8 cm WorldView-4 satellite image.
3.6. Grazing Land Cover Classification and Pasture Quality Monitoring
The top-of-atmosphere reflectance images of the WorldView-4 satellite and drone
data were used to generate pasture NDVI as an indicator of pasture quality pre- and
post-flooding. The NDVI was generated using Equation (3) [30].
NDVI = (Near-Infrared − Red)/(Near-Infrared + Red) (3)
The grazing land cover was classified and mapped using the top-of-atmosphere re-
flectance images of WorldView-4 satellite and drone platforms. The spectral bands 1–4
of WorldView-4 and spectral bands 1–5 of the MicaSense RedEdge-M camera onboard
Phantom 4-Pro drone were used in the classification and mapping of grazing land cover.
Supervised classification was performed using the machine learning Random Forest clas-
sification algorithm with digitized polygons (training data) of grazing land cover types.
The default number of training samples was set at 5000 and the number of trees was
set at 10. This algorithm was selected because the Random Forest classifier consists of a
combination of tree classifiers where each classifier is generated using a random vector
sampled independently from the input vector, and each tree casts a unit vote for the most
popular class to classify an input vector [32]. Furthermore, the machine learning Ran-
dom Forest classification algorithm has been found to outperform other machine learning
classification algorithms such as support vector machines in land cover mapping [33,34].
The minimum mapping unit of the grazing land cover map was 1 m2 . The grazing land
cover map generated post-flooding was validated to examine how well the classified map
represented grazing land cover on the ground. This was carried out by randomly selecting
about 50-points of classes on the generated map and comparing them to classes on the
ground and Google Earth Pro. The acquisition date of Google Earth Pro images was in
May of 2019 and was relevant for accuracy assessment. This is because it was of the same
season as the post-flooding drone images used in this study. The overall accuracy was
computed by dividing the sum of the correct diagonal values in the error matrix table withLand 2021, 10, 321 8 of 13
the sum of all pixels in the error matrix table [30]. The kappa value was also computed
using the method described by Mather and Koch [30]. Furthermore, using the confusion
matrix values (Table 1), the widely used metrics of precision, recall, and F-score [35] were
calculated to evaluate the performance of the Random Forest classification algorithm in
mapping grazing land cover. The precision was calculated using Equation (4); recall using
Equation (5); and F-score using Equation (6) [35,36].
TP
Precision = (4)
TP + FP
TP
Recall = (5)
TP + FN
where;
Table 1. Error matrix table of post-flooding grazing land cover classes.
Classes
Pasture Bare Ground Total
Reference
Pasture 40 0 40
Bare ground 2 8 10
Total 42 8 50
User Producer Overall
Kappa F-Acore
Accuracy (%) Accuracy (%) Accuracy (%)
Pasture 100 95
Bare ground 80 100
Overall, kappa,
and 96 0.86 0.97
F-score
TP = True Positive
FP = False Positive
FN = False Negative.
2 × Precision × Recall
F − Score = (6)
Precision + Recall
The grazing land cover maps were converted from raster to vector in Geographic
Information System (GIS)for further analyses.
4. Results and Discussion
4.1. Grazing Land Cover Mapping
The grazing land cover consisted of pasture and bare ground (Figures 4 and 5). The
bare land represented exposed land with silt loam soil that consisted of less than 5% of
the vegetation. In contrast, pasture represented vegetated areas covered by more than
5% of the vegetation. The pasture was dominated by tall fescue grass and covered an
area of about 3 hectares pre-flooding. This represented about 90% of the study area. The
bare ground covered an area of about 0.3 hectares pre-flooding and represented about
10% of the study area. The area covered by pasture was approximately 3.2 hectares post-
flooding. The area covered by bare ground was about 0.1 hectares post-flooding. The
pasture area increased by about 7% post-flooding whereas the bare ground area decreased
by about 65% post-flooding. The increase in pasture post-flooding implies the vegetation
was tolerant to flooding and the flood event likely stimulated vegetation growth and
expansion. Furthermore, the pasture was dominated by tall fescue plants and has been
found to be resilient to flooding [37,38]. In addition, the drone images were taken moreLand 2021, 10, 321 9 of 13
than 3 weeks after flooding occurred and that likely provided recovery time for the pasture
vegetation to expand. The increase in pasture cover post-flooding is similar to the findings
of Mansour [39]. The decrease in bare ground post-flooding occurred predominantly
south of the study area as detected by the drone data. The high spatial resolution drone
and WorldView-4 satellite data successfully detected changes in grazing land cover that
Land 2021, 10, x FOR PEER REVIEW 1010ofof1515
Land 2021, 10, x FOR PEER REVIEW will likely not detected using moderate resolution remotely sensed data such as Landsat
Operational Land Imager (OLI).
Figure
Figure
Figure4.4.4. Pre-flooding
Pre-flooding
Pre-flooding grazing
grazing
grazing land
land
land cover.
cover.
cover.
Figure
Figure5.5.5.
Figure Post-flooding
Post-floodinggrazing
Post-floodinggrazingland
grazinglandcover.
landcover.
cover.
The
Theoverall
The overallaccuracy
overall accuracyofof
accuracy ofthe
thegrazing
the grazingland
grazing landcover
land covermap
cover mapderived
map derivedusing
derived usingaaadrone
using dronewas
drone wasabout
was about
about
96%
96%
96% (Table
(Table
(Table 1). The
1).
1).The
Thekappa
kappa
kappastatistic
statistic was
was
statistic approximately
approximately
was approximately 0.86 and
andthere
0.860.86 there
and was
wasawas
there avery
very a good
goodcor-
very cor-
good
relation
relation between
correlation between
between the
theremotely
the remotely
remotely sensed
sensed classified
sensedclassified map
classifiedmap and
map and
and the grazing
the
the grazing
grazing landland
land cover
cover
cover on
ononthethe
the
ground.
ground.This
ground. Thisisisbecause
This becausekappa
kappavalues
kappa values 0.75
valuesofof0.75 and
0.75andand above
above
above indicate
indicate
indicate aavery
a very good
very good
good correlation
correlation
correlationand
and
and kappa
kappakappa values
valuesvalues below
below 0.4 0.4
below 0.4are
are areconsidered
considered poor
considered poor correlation,
correlation,
poor assuming
assuming
correlation, the
thedata
the data
assuming are
areran-
are randomly
data ran-
domly
sampled
domly sampled
sampled from
from afrom a multinomial
multinomial
a multinomial distribution
distribution with
with with
distribution a
a largelarge sample
sample
a large size
size size
sample [40].
[40].[40]. Similarly,
Similarly,
Similarly,the
the
theF-score
F-score that
F-score that measures
measures
that measures thethethetest
test testaccuracy
accuracy ofofclassification
of the
accuracy the
theclassification
was was
classification wasabout
about 0.97 and
about 0.97 and
0.97was was
andclosed
was
closed
to its to
closed toits
best best
bestvalue
itsvalue of 1. ofof1.1.
value
The
Themean
meanuser’s
user’saccuracy,
accuracy,which whichdemonstrates
demonstrateshow howwellwellthe
theclassified
classifiedgrazing
grazingland land
cover
cover types on the map actually represented land cover on the ground, was about8%
types on the map actually represented land cover on the ground, was about 8%
lower
lowerthanthanthethemean
meanproducer’s
producer’saccuracy,
accuracy,which
whichdetermines
determinesthe theability
abilityofofthe theRandom
Random
Forest
Forestalgorithm
algorithmtotogenerate
generategrazing
grazingland
landcover.
cover.Land 2021, 10, 321 10 of 13
The mean user’s accuracy, which demonstrates how well the classified grazing land
cover types on the map actually represented land cover on the ground, was about 8% lower
than the mean producer’s accuracy, which determines the ability of the Random Forest
algorithm to generate grazing land cover.
Land 2021, 10, x FOR PEER REVIEW 4.2. Pasture Quality 11 of 15
The NDVI values of the pasture in the study area ranged from 0.1 to 0.8 pre- and
post-flooding (Figures 6 and 7). The mean NDVI ± standard deviation (SD) of the pasture
was about 0.3 ± 0.1 pre-flooding (Figure 8). The pasture mean NDVI ± SD was about
was about 0.3 ± 0.1 pre-flooding (Figure 8). The pasture mean NDVI ± SD was about 0.6 ±
0.6 ± 0.1 post-flooding (Figure 8). The pasture mean NDVI increased by about 100%
0.1 post-flooding (Figure 8). The pasture mean NDVI increased by about 100% post-flood-
post-flooding. This implies the flooding that occurred in the study area likely improved
ing. This implies the flooding that occurred in the study area likely improved pasture
pasture plant health and vigor. This is because flooding provides soil moisture needed for
plant health and vigor. This is because flooding provides soil moisture needed for plant
plant germination and growth. This finding is similar to a recent study that found flooding
germination and growth. This finding is similar to a recent study that found flooding to
to increase plant germination and vegetation quality [39]. However, the seasons when
increase plant germination and vegetation quality [39]. However, the seasons when the
the drone and WorldView-4 satellite images were captured may have also contributed to
drone and WorldView-4 satellite images were captured may have also contributed to the
the change in pasture quality. For example, the cooler Fall condition pre-flooding likely
change in pasture quality. For example, the cooler Fall condition pre-flooding likely
caused dormancy in the pasture vegetation resulting in the lower NDVI values, whereas
caused dormancy
the warmer Springincondition
the pasture vegetation resulting
post-flooding in the lower
likely stimulated NDVI
pasture values, whereas
vegetation growth
the
and the higher NDVI values [41]. The different seasons of data collection weregrowth
warmer Spring condition post-flooding likely stimulated pasture vegetation due to
and the higher NDVI values [41]. The different seasons of data collection
a lack of cloud-free high spatial resolution remotely sensed data for the study area were due toof
a
lack of cloud-free
the same season. high
This isspatial resolution
a limitation remotely
of this study.sensed datathe
However, for remotely
the studysensed
area ofdata
the
same season. This is a limitation of this study. However, the remotely
used in this study have successfully detected the grazing land cover change and pasturesensed data used in
this study have successfully detected the grazing land cover change
quality pre- and post-flooding at a finer scale. Further study will examine this pastureand pasture quality
pre- andand
quality post-flooding at a fineryears
cover at previous scale.and
Further
of thestudy
samewill examine
seasons when this
nopasture
flooding quality and
occurred
cover at previous
to suppose if theyears and ofchange
significant the same inseasons
pasturewhen no and
quality flooding
coveroccurred to suppose
in this study if
can be
the significant
attributed change
sorely in pasture
to flooding quality and
or seasonal coverNonetheless,
effects. in this studythis
can study
be attributed sorely
has provided
to flooding
a new or seasonal
account of grazing effects. Nonetheless,
land cover change andthis pasture
study has provided
quality a new
pre- and account of
post-flooding
grazing
event in sub-tropical environment. The high post-flooding pasture NDVI valuessub-tropi-
land cover change and pasture quality pre- and post-flooding event in found in
cal
thisenvironment.
study are similarThe to high
thepost-flooding
results of Simspasture NDVI[42]
and Colloff values
that found
found ain19% thisincrease
study are
in
similar to the of
NDVI values results of Sims
vegetation and Colloff in
post-flooding [42]
thethat found afloodplain
semi-arid 19% increase
(Parooin NDVI values of
River Wetlands)
vegetation
in Australia.post-flooding in the semi-arid floodplain (Paroo River Wetlands) in Australia.
Figure 6.
Figure Pasture normalized
6. Pasture normalized difference
difference vegetation
vegetation index
index (NDVI)
(NDVI) pre-flooding.
pre-flooding.
Although high spatial resolution drone and WorldView-4 satellite data have been
used to map and monitor grazing land cover types and pasture quality in this study, there
are some limitations in using these datasets. For example, the availability of cloud-free
WorldView-4 satellite data is a limiting factor and with the recent WoldView-4 satellite
malfunction in 2019, there is likely limited acquisition of WorldView-4 satellite data globally.Land 2021, 10, 321 11 of 13
Furthermore, although real-time drone data can be easily acquired, the flying of drones has
altitude restrictions and is weather-dependent. Nonetheless, high spatial resolution drone
Land 2021, 10, x FOR PEER REVIEW 12 of 15
Land 2021, 10, x FOR PEER REVIEW and WorldView-4 satellite data can be used to map and monitor grazing land cover 12 at a
of 15
finer scale not likely detected using moderate spatial resolution remote sensing data.
Figure 7. Pasture NDVI post-flooding.
Figure 7. Pasture
Figure 7. Pasture NDVI
NDVI post-flooding.
post-flooding.
0.8
0.8
0.7
0.7
0.6
0.6
0.5
0.5
0.4
0.4
0.3
0.3
0.2
0.2
0.1
0.1
0
0
NDVI Pre-Flood NDVI Post-Flood
NDVI Pre-Flood NDVI Post-Flood
Figure 8. Mean pasture NDVI pre- and post-flooding. Error bars represented standard deviation
Figure 8.
Figure 8. Mean
Mean pasture
pastureNDVI
NDVIpre-
pre-and
andpost-flooding.
post-flooding.Error
Errorbars
bars represented
represented standard
standard deviation
deviation (SD)
(SD) of the mean.
(SD)
of theofmean.
the mean.
Although
Althoughhigh
5. Conclusions highspatial
spatialresolution
resolutiondrone droneand andWorldView-4
WorldView-4satellite satellitedata
datahave
havebeenbeen
used
usedtotomap
map and monitor grazing land
landcover types
typesand
andpasture quality in this
thisstudy, there
The highand monitor
spatial grazingdrone
resolution coverWorldView-4
and pasture
satellitequality
data in
used instudy, there
this study
are
aresome
some limitations
limitations in using these datasets. For
Forexample, the
theavailability of cloud-free
have proven successfulininusing
mapping theseand datasets.
monitoring example,
grazing land availability
cover changeofand cloud-free
pasture
WorldView-4
WorldView-4 satellite data is a limiting factor and with the recent WoldView-4 satellite
quality pre- andsatellite data is aThe
post-flooding. limiting
grazing factor
landand
coverwith the recent
classes WoldView-4
were produced with satellite
overall
malfunction
malfunction inin2019,
2019,there
there isislikely
likely limited
limited acquisition
acquisition ofofWorldView-4
WorldView-4 satellite
satellite data
data glob-
glob-
mapping accuracy of about 96%. The pasture cover and quality were found to increase
ally. Furthermore,
ally. Furthermore, although real-time
althoughrelative
real-time drone data
drone data cancan be easily
beseasonal acquired,
easily acquired, the flying
flyingofof
significantly post-flooding to pre-flooding. The changes the in remotely
drones
droneshashasaltitude
altitude restrictions
restrictions andandisisweather-dependent.
weather-dependent. Nonetheless,
Nonetheless, high
highspatial
spatial res-
res-
sensed data acquisition likely contributed to the change in grazing land cover and pasture
olution
quality drone
olution pre-
drone and
and and WorldView-4
WorldView-4
post-flooding. satellite data
satellite datathe
Furthermore, can
can be used to
be usedthat
flooding map
to map and monitor
andabout
covered monitor grazing
75%grazing
of the
land
landcover
study area at
cover ata afiner
likely alsoscale
finer scalenotnotlikely
contributed detected
to the
likely increase
detected using moderate
in pasture
using moderatecover spatial resolution
and quality
spatial in the
resolution remote
study
remote
sensing
area. data.
However,
sensing data. further study is required to examine the grazing land cover and pasture
quality in previous years when flooding did not occur to assume flooding is the main
5.contributing
5.Conclusions
Conclusions factor to the change in pasture quality and land cover change. This is an area
The
The highspatial
of further high spatialresolution
research. resolutiondrone droneand andWorldView-4
WorldView-4satellite
satellitedata
dataused
usedininthisthisstudy
study
have
haveproven
provensuccessful
successfulininmapping
mappingand andmonitoring
monitoringgrazing
grazingland landcover
coverchange
changeand andpas-pas-
ture
turequality
qualitypre-pre-andandpost-flooding.
post-flooding.The Thegrazing
grazingland
landcover
coverclasses
classeswerewereproduced
producedwith with
overall
overallmapping
mappingaccuracyaccuracyofofaboutabout96%.96%.TheThepasture
pasturecover
coverandandquality
qualitywere
werefound
foundtotoin- in-
crease
crease significantly post-flooding relative to pre-flooding. The seasonal changesininre-
significantly post-flooding relative to pre-flooding. The seasonal changes re-
motely
motelysensed
senseddata dataacquisition
acquisitionlikelylikelycontributed
contributedtotothethechange
changeiningrazing
grazingland
landcover
coverandandLand 2021, 10, 321 12 of 13
However, as high spatial resolution drone and satellite data are increasingly becoming
cheaper worldwide, it is relevant to utilize these datasets for mapping and monitoring in
grazing environments to support land management.
Author Contributions: Conceptualization, C.E.A.; methodology, C.E.A.; validation, C.E.A. and
E.O.A.; formal analysis, C.E.A.; writing—original draft preparation, C.E.A.; writing—review and
editing, C.E.A. and S.D.; visualization, C.E.A. and S.D.; supervision, C.E.A.; project administration,
C.E.A.; All authors have read and agreed to the published version of the manuscript.
Funding: This research received no external funding.
Institutional Review Board Statement: Not applicable.
Informed Consent Statement: Not applicable.
Acknowledgments: Many thanks to the United States Department of Agriculture (USDA) for sup-
porting this project through the Evans Allen Funding Program.
Conflicts of Interest: The authors declare no conflict of interest.
References
1. Imaz, J.A.; Giménez, D.O.; Grimoldi, A.A.; Striker, G.G. Ability to recover overrides the negative effects of flooding on growth of
tropical grasses Chloris gayana and Panicum coloratum. Crop Pasture Sci. 2015, 66, 100–106. [CrossRef]
2. Redfearn, D.; Beckman, B. Reclaiming Flood-Damaged Pastures and Forage Production; University of Nebraska–Lincoln, BEEF: Lincoln,
NE, USA, 2019; Available online: https://beef.unl.edu/beefwatch/reclaiming-flood-damaged-pastures-and-forage-production
(accessed on 16 November 2020).
3. Striker, G.G.; Ploschuk, R.A. Recovery from short-term complete submergence in temperate pasture grasses. Crop Pasture Sci.
2018, 69, 745–753. [CrossRef]
4. Hall, T.J. Pasture Recovery, Land Condition and Some Other Observations after the Monsoon Flooding, Chill Event in North-West
Queensland in Jan–Mar 2019; Department of Agriculture and Fisheries, Queensland Government: George St. Brisbane, Queensland,
Australia, 2020.
5. Arabameri, A.; Pourghasemi, H.R. Spatial Modeling of Gully Erosion Using Linear and Quadratic Discriminant Analyses in GIS
and R. In Spatial Modeling in GIS and R for Earth and Environmental Sciences; Pourghasemi, H.R., Gokceoglu, C., Eds.; Elsevier Inc.:
Amsterdam, The Netherlands, 2019; pp. 299–321.
6. Gessesse, A.A.; Melesse, A.M. Temporal relationships between time series CHIRPS-rainfall estimation and eMODIS-NDVI
satellite images in Amhara Region, Ethiopia. In Extreme Hydrology and Climate Variability: Monitoring, Modelling, Adaptation and
Mitigation; Melesse, A.M., Abtew, W., Senay, G., Eds.; Elsevier Inc.: Amsterdam, The Netherlands, 2019; pp. 81–92.
7. Insua, J.R.; Utsumi, S.A.; Basso, B. Estimation of spatial and temporal variability of pasture growth and digestibility in grazing
rotations coupling unmanned aerial vehicle (UAV) with crop simulation models. PLoS ONE 2019, 14, e0212773. [CrossRef]
8. Michez, A.; Lejeune, P.; Bauwens, S.; Herinaina, A.A.L.; Blaise, Y.; Muñoz, E.C.; Lebeau, F.; Bindelle, J. Mapping and Monitoring
of Biomass and Grazing in Pasture with an Unmanned Aerial System. Remote Sens. 2019, 11, 473. [CrossRef]
9. Wiesmair, M.; Feilhauer, H.; Magiera, A.; Otte, A.; Waldhardt, R. Estimating Vegetation Cover from High-Resolution Satellite
Data to Assess Grassland Degradation in the Georgian Caucasus. Mt. Res. Dev. 2016, 36, 56–65. [CrossRef]
10. Ali, I.; Cawkwell, F.; Dwyer, E.; Barrett, B.; Green, S. Satellite remote sensing of grasslands: From observation to management.
J. Plant Ecol. 2016, 9, 649–671. [CrossRef]
11. Ramoelo, A.; Cho, M.A.; Mathieu, R.; Madonsela, S.; van de Kerchove, R.; Kaszta, Z.; Wolff, E. Monitoring grass nutrients and
biomass as indicators of rangeland quality and quantity using random forest modelling and WorldView-2 data. Int. J. Appl. Earth
Obs. Geoinf. 2015, 43, 43–54. [CrossRef]
12. Falldorf, T.; Strand, O.; Panzacchi, M.; Tømmervik, H. Estimating lichen volume and reindeer winter pasture quality from Landsat
imagery. Remote Sens. Environ. 2014, 140, 573–579. [CrossRef]
13. Tsalyuk, M.; Kelly, M.; Koy, K.; Getz, W.M.; Butterfield, H.S. Monitoring the Impact of Grazing on Rangeland Conservation
Easements Using MODIS Vegetation Indices. Rangel. Ecol. Manag. 2015, 68, 173–185. [CrossRef]
14. Ndungu, L.; Oware, M.; Omondi, S.; Wahome, A.; Mugo, R.; Adams, E. Application of MODIS NDVI for Monitoring Kenyan
Rangelands Through a Web Based Decision Support Tool. Front. Environ. Sci. 2019, 7, 187. [CrossRef]
15. Theau, J.; Lauzier-Hudon, E.; Aube, L.; Devillers, N. Estimation of forage biomass and vegetation cover in grasslands using UAV
imagery. PLoS ONE 2021, 16, e0245784. [CrossRef]
16. Meshesha, D.T.; Ahmed, M.M.; Abdi, D.Y.; Haregeweyn, N. Prediction of grass biomass from satellite imagery in Somali regional
state, eastern Ethiopia. Heliyon 2020, 6, e05272. [CrossRef] [PubMed]
17. Zhang, X.; Chen, X.; Tian, M.; Fan, Y.; Ma, J.; Xing, D. An evaluation model for aboveground biomass based on hyperspectral data
from field and TM8 in Khorchin grassland, China. PLoS ONE 2020, 15, e0223934. [CrossRef] [PubMed]Land 2021, 10, 321 13 of 13
18. Liu, S.; Cheng, F.; Dong, S.; Zhao, H.; Hou, X.; Wu, X. Spatiotemporal Dynamics of Grassland Aboveground Biomass on the Qinghai-Tibet
Plateau Based on Validated MODIS NDVI; Scientific Reports; Springer Nature: Berlin/Heidelberg, Germany, 2017; Available online:
www.nature.com/scientificreports (accessed on 12 December 2020).
19. Al-Najjar, H.A.H.; Kalantar, B.; Pradhan, B.; Saeidi, V.; Halin, A.A.; Ueda, N.; Mansor, S. Land Cover Classification from fused
DSM and UAV Images Using Convolutional Neural Networks. Remote Sens. 2019, 11, 1461. [CrossRef]
20. Sandino, J.; Gonzalez, F.; Mengersen, K.; Gaston, K.J. UAVs and Machine Learning Revolutionising Invasive Grass and Vegetation
Surveys in Remote Arid Lands. Sensors 2018, 18, 605. [CrossRef] [PubMed]
21. Kawamura, K.; Lim, J.; Kurokawa, Y.; Obitsu, T.; Yayota, M.; Ogura, S. Monitoring Spatial Heterogeneity of Pasture within
Paddock Scale using a Small Unmanned Aerial Vehicle (sUAV). JIFS 2017, 14, 61–66.
22. Oliveira, R.A.; Näsi, R.; Niemeläinen, O.; Nyholm, L.; Alhonoja, K.; Kaivosoja, J.; Jauhiainen, L.; Viljanen, N.; Nezami, S.;
Markelin, L.; et al. Machine learning estimators for the quantity and quality of grass swards used for silage production using
drone-based imaging spectrometry and photogrammetry. Remote Sens. Environ. 2020, 246, 111830. [CrossRef]
23. Barnetson, J.; Phinn, S.; Scarth, S. Estimating Plant Pasture Biomass and Quality from UAV Imaging across Queensland’s
Rangelands. AgriEngineering 2020, 2, 35. [CrossRef]
24. U.S. Census Bureau. TENNESSEE—Core Based Statistical Areas (CBSAs) and Counties; U.S. Department of Commerce Economics
and Statistics Administration, U.S. Census Bureau: Jeffersonville, IN, USA, 2013. Available online: https://www2.census.gov/
geo/maps/metroarea/stcbsa_pg/Feb2013/cbsa2013_TN.pdf (accessed on 15 December 2020).
25. Hodges, J.A.; Norrell, R.J.; Sarah, M.H. Tennessee; Encyclopedia Britannica, Inc., 2018. Available online: https://www.britannica.
com/place/Tennessee/additional-info#contributors (accessed on 25 November 2020).
26. United States Climate Data. Climate Nashville Area—Tennessee; Your Weather Sevice-World Climate, 2018. Available online:
https://www.usclimatedata.com/climate/nashville/tennessee/united-states/ustn0357 (accessed on 15 December 2020).
27. Mitsch, W.J.; Gosselink, J.G.; Zhang, L.; Anderson, C.J. Wetland Ecosystems; Wiley: Hoboken, NJ, USA, 2009.
28. USDA. Published Soil Surveys for Tennessee; United States Department of Agriculture, Natural Resources Conservation Service:
Washington, DC, USA, 2021. Available online: https://www.nrcs.usda.gov/wps/portal/nrcs/surveylist/soils/survey/state/
?stateId=TN (accessed on 10 March 2021).
29. Meador, M.R. Tennessee wetland resources. In National Water Summary on Wetland Resources; Fretwell, J.D., Williams, J.S.,
Redman, P.J., Eds.; U.S. Geological Survey Water-Supply Paper 2425; 1996. Available online: https://pubs.er.usgs.gov/
publication/wsp2425 (accessed on 14 February 2021).
30. Mather, P.M.; Koch, M. Computer Processing of Remotely-Sensed Images: An Introduction, 4th ed.; John Wiley and Sons: Chichester,
UK, 2011.
31. Maxar. Absolute Radiometric Calibration: 2018v0; Maxar Technologies: Westminster, CO, USA, 2018. Available online: https:
//www.maxar.com/ (accessed on 14 October 2020).
32. Breiman, L. Random forests—Random Features; Technical Report 567; Statistics Department, University of California: Berkeley, CA,
USA, 1999; Available online: ftp//ftp.stat.berkeley.edu/pub/users/breiman (accessed on 10 January 2021).
33. Belgiu, M.; Dragut, L. Random forest in remote sensing: A review of applications and future directions. ISPRS J. Photogramm.
Remote Sens. 2016, 114, 24–31. [CrossRef]
34. Fernández-Delgado, M.; Cernadas, E.; Barro, S.; Amorim, D. Do we need hundreds of classifiers to solve real world classification
problems. J. Mach. Learn. Res. 2014, 15, 3133–3181.
35. Sokolova, M.; Lapalme, G. A systematic analysis of performance measures for classification tasks. Inf. Process. Manag. 2009, 45,
427–437. [CrossRef]
36. Shao, W.; Kawakami, R.; Yoshihashi, R.; You, S.; Kawase, H.; Naemura, T. Cattle detection and counting in UAV images based on
convolutional neural networks. Int. J. Remote Sens. 2020, 41, 31–52. [CrossRef]
37. Fan, J.; Zhang, W.; Amombo, E.; Hu, L.; Kjorven, J.O.; Chen, L. Mechanisms of Environmental Stress Tolerance in Turfgrass.
Agronomy 2020, 10, 522. [CrossRef]
38. Qiao, D.; Zhang, Y.; Xiong, X.; Li, M.; Cai, K.; Luo, H.; Zeng, B. Transcriptome analysis on responses of orchard grass (Dactylis
glomerata L.) leaves to a short term flooding. Hereditas 2020, 157, 1–16. [CrossRef]
39. Mansour, J.; Moien, J. Study effect of flood productivity on vegetation changes using field work and Landsat satellite images
(Case study: Shandak of Sistan region). J. Appl. Rs. Gis. Technol. Nat. Resour. Sci. 2020, 10, 57–73.
40. Montserud, R.A.; Leamans, R. Comparing global vegetation maps with kappa statistics. Ecol. Modeling 1992, 62, 275–293.
[CrossRef]
41. Zhou, X.; Geng, X.; Yin, G.; Hänninen, H.; Hao, F.; Zhang, X.; Fu, Y.H. Legacy effect of spring phenology on vegetation growth in
temperate China. Agric. For. Meteorol. 2020, 281, 107845. [CrossRef]
42. Sims, N.C.; Colloff, M.J. Remote sensing of vegetation responses to flooding of a semi-arid floodplain: Implications for monitoring
ecological effects of environmental flows. Ecol. Indic. 2012, 18, 387–391. [CrossRef]You can also read