Community Based Monitoring: Applicability to the Low Water Response Program - Prepared by Angela Mills March 4, 2019 - NVCA
←
→
Page content transcription
If your browser does not render page correctly, please read the page content below
Community Based Monitoring:
Applicability to the Low Water
Response Program

Prepared by Angela Mills

March 4, 2019

                  Nottawasaga Valley
                  Conservation Authority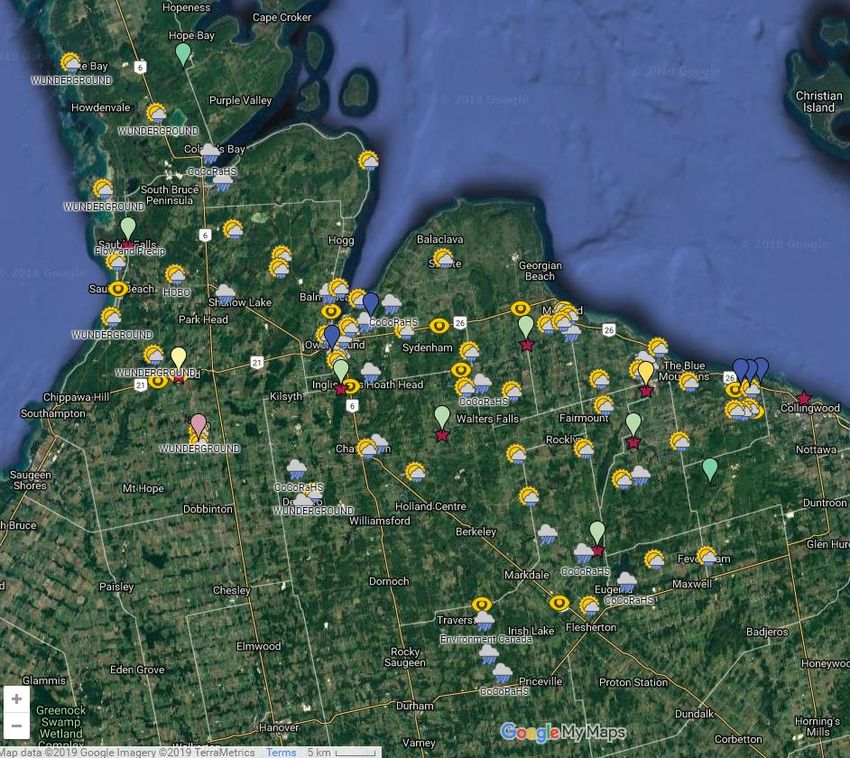
1. Introduction*

Freshwater is a natural resource that is critical to the health of both the environment
and economy of Ontario. Exceedingly dry conditions that were once occurring every
decade or so have become more frequent, putting pressure on both surface and
groundwater resources, especially when combined with the increasing human
demand (OMAFRA, 2016). The Ontario Low Water Response program assesses low
water conditions based on the state of stream flow or rainfall accumulation,
progressing through three stages as the conditions become more severe (e.g., Level
I, II, and III; OMAFRA, 2016). It is likely that current extreme low water conditions
are expected to become the new average condition under future climate change
scenarios (Matrix Solutions Inc. & Blumetric Environmental Inc., 2017).

Rain gauges can accurately measure precipitation events, however, the high
spatiotemporal variability of these events mean that the associated measurements
have limited spatial representativeness (Villarini, et al., 2008). Hubbard (1994)
found that one station every 60 km in relatively simple terrain was adequate to
capture 90% of the spatial variability in daily maximum temperature. Minimum
temperature and evapotranspiration variability would require network resolution of
30 km; soil temperature, 20 km; and daily precipitation 5 km (or 25 km2 per station).
Higher density networks, however, do not always provide better spatial
representation of meteorological variables, so a balance between representative data
and cost of installations must be obtained (Ren & Ren, 2012; Vinnikov, et al., 1999).

The large spatial scale of established meteorological networks is often inadequate to
represent smaller-scale controls (e.g., terrain or proximity to large bodies of water)
or summer convective storms (Doesken & Weaver, 2000). The sparse distribution of
established monitoring networks (e.g., Environment and Climate Change Canada
[ECCC] or Conservation Authority) therefore does not fully characterize precipitation
events. The position of monitoring stations relative to the location of storm events,
particularly smaller convective storms, may under- or over-represent the spatial
amount of precipitation accumulation. For example, Doesken and Weaver (2000)
document a storm event that brought as much as 267 mm of precipitation to parts
of Fort Collins, Colorado, yet 6.5 km away, only ~ 50 mm were reported. The detailed
review of this storm was made possible by residents who were maintaining reliable
and well-sited rain gauges.

Meteorologically-focused citizen science or community-based monitoring (CBM) can
be used to complement established gauged networks to infill data gaps with
volunteers reporting actual observed conditions such as precipitation type which may

*
    For alternative document formats contact NVCA at 705-424-1479 or admin@nvca.on.ca

NVCA | Citizen Science Precipitation Monitoring                              Page 1 of 17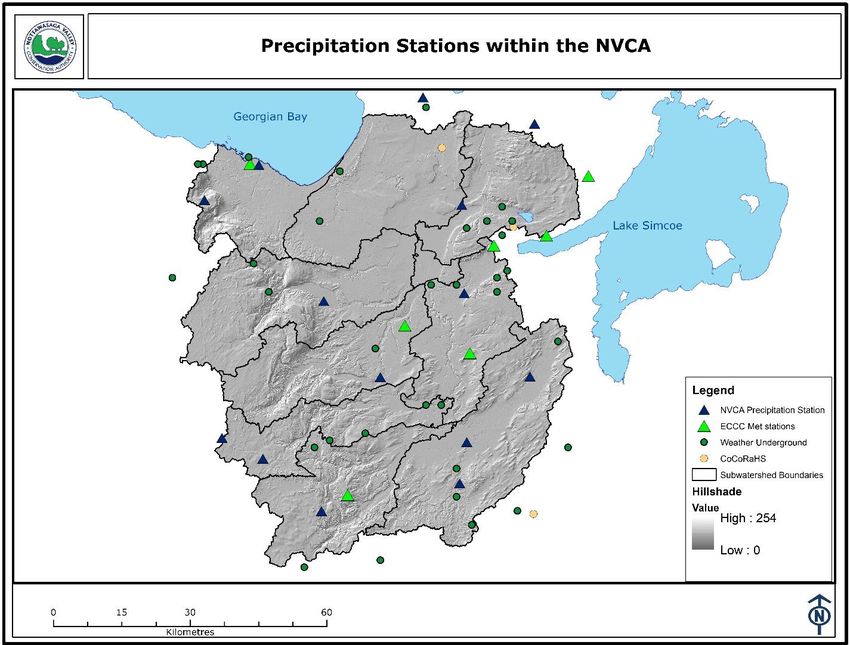
not be discernable through instrumental observations alone (Chen, et al., 2016).
Advances in the internet and geographic information system (GIS)-enabled web
applications allow large volumes of location-based data to be submitted electronically
to databases through simple online data-entry (Dickinson, et al., 2012). Participation
in citizen science programs also empowers individuals with respect to resource
management so that management decisions and the data that drive them are more
likely to be in the hands of those who will be most affected by the outcomes
(Dickinson, et al., 2012).

The Nottawasaga Valley Conservation Authority (NVCA) manages a network of 14
rain gauges, 12 of which are within the watershed to cover 3300 km2 (with the
additional sites located within the area monitored primarily by the Severn Sound
Environmental Association; see Figure 1), for an average spatial coverage of 263 km2
per station, which far exceeds the recommendations of Hubbard (1994). There are
spatial gaps in this network, particularly in the north and west, indicating that the
network may not be sufficiently capturing precipitation data to monitor the state of
the watershed. CBM programs can engage residents while also strengthening the
spatial resolution of precipitation data within the watershed. Focusing on
meteorological data collection, the objectives of this review are to:

   1) Evaluate CBM benefits and challenges,
   2) Complete an overview of existing CBM programs presently active in Ontario,
      and
   3) Review the current spatial availability of established networks and CBM data
      within the NVCA watershed in support of the Ontario Low Water Response
      (OLWR) and flood forecasting programs.

This report is supported by funding from the Ontario Low Water Response.

2. CBM Benefits and Challenges

Monitoring weather data through citizen science initiatives dates back to at least the
mid-1800s with the Smithsonian weather observing network (Doesken & Reges,
2010). Networks such as the Cooperative Network (in the USA), have become more
organized with thousands of volunteers reporting daily maximum and minimum
temperature and precipitation data (Doesken & Reges, 2010). Community-based
monitoring is defined as a process where concerned citizens, government agencies,
industry, academia, community groups and local institutions collaborate to monitor,
track, and respond to issues of common community concern (Fleener, et al., 2004).
It provides the means to work together to gather and deliver information and to adapt
to change, not as isolated communities, but as a network that learns from each other
and shares resources. It can also provide decision makers with early warnings of
environmental issues. Benefits of CBM include:

NVCA | Citizen Science Precipitation Monitoring Page 2 of 17 Allowing communities to increase knowledge about their environment by
generating locally relevant monitoring information. CBM brings to monitoring
a unique understanding of the local situation and the needs of individual
communities.
Using standardized monitoring methods will allow for the comparison and
integration of information within landscapes and among communities.
Giving local decision makers the information and tools they need to make
informed policy choices and management plans which are adaptive and
responsive.
Contributing toward building “social capital” in participating communities.
Increased social capital improves the community capacity to deal with the
many complex issues and choices associated with sustainability (Ecological
Monitoring and Assessment Network Coordinating Office & Canadian Nature
Federation, 2003).
Further, studies have shown that the experience of collecting data for use by
professional scientists is highly motivating, fosters scientific knowledge, and provides
opportunities for interacting with members of like-minded communities within local
environments (Dickinson, et al., 2012). Citizens can be highly motivated to
participate when research is closely aligned with their needs and interests (Hecker,
et al., 2018).
However, challenges with CBM are recognized and consist of:
Ensuring Credible Data - the legitimacy of CBM data is dependent on the quality
of the information produced so it is important that data is collected and analyzed in
ways that can be trusted and that respect and benefit the communities involved.
Since the public contributes data collected for citizen science programs rather than
professionals, data reliability can be of concern (Kanu, et al., 2016).
Engaging and Motivating Citizens - an effective CBM program depends on the
active engagement of motivated citizen volunteers. Catalyzing and maintaining this
level of engagement is no easy task and there are many challenges to overcome in
the process of recruiting, engaging and training citizens properly, as well as ensuring
program succession to support long term data requirements (Kanu, et al., 2016).
Informing Decision Makers - the connection between CBM and decision making
continues to present challenges. CBM programs that seek to inform decision making
must be designed to ensure that data is produced and translated in a way that can
address key threats and support the needs and questions of decision makers at
different scales, including within the community (Kanu, et al., 2016).
NVCA | Citizen Science Precipitation Monitoring Page 3 of 17Data Accessibility and Aggregation - much data that is collected continues to be
inaccessible or stored in formats that make it difficult to use. If data is not made
available and accessible in a usable format, its usefulness for informing decisions and
even local actions will be limited. Making decisions on a broader scale, such as an
entire watershed or region, requires multiple sources of information to be aggregated
and translated to have a complete picture of the health of a watershed or region
(Kanu, et al., 2016).
Site Location and Maintenance - one of the greatest challenges to data reliability
at CBM stations is the installation of the station itself. Poor siting, exposure,
ventilation, calibration, and maintenance are key factors that lead to measurement
error (Bell, et al., 2013). CBM stations are often more densely situated in population
centres; these sites may be situated in closer proximity to obstacles (e.g., trees and
structures) that can impact readings. Temporal data gaps can have a significant
impact on analysis results of precipitation data since it is summed over intervals of
time (e.g., daily, monthly, and annual).
3. Existing Community-Based Monitoring Programs
The primary weather-based citizen science programs established in Ontario are the
Community Collaborative Rain, Hail, and Snow Network (CoCoRaHS) and the
Weather Underground. Participants in both programs collect data using established
standardized methods with data uploaded to the existing databases where it can be
viewed quickly and easily. Both programs provide high quality precipitation data to
observers, decision makers, and other end-users on a timely basis; act as an
umbrella for one-stop precipitation information nationwide; increase community
awareness about weather by inspiring citizens to participate; and provide enrichment
activities to educators and the community. Data from both networks are publicly
available and used by the wider scientific community for enhanced forecasting
abilities through higher resolution networks (Bell, et al., 2013; The Weather
Company, 2019).
CoCoRaHS:
CoCoRaHS (https://www.cocorahs.org/Canada.aspx) was established in 1998 in
Colorado, after the aforementioned Fort Collins storm (Doesken & Weaver, 2000),
with eventually all 50 States and the District of Columbia, Puerto Rico, U.S. Virgin
Islands, The Bahamas, and Canada joining the network (Colorado Climate Center,
2018). The goals of CoCoRaHS include:
1) Providing accurate high-quality precipitation data for the many end users on a
timely basis;
NVCA | Citizen Science Precipitation Monitoring Page 4 of 172) Increasing the density of precipitation data available by encouraging volunteer
weather observing;
3) Encouraging citizens to have fun participating in meteorological science and
heightening their awareness about weather; and
4) Providing enrichment activities in water and weather resources for teachers,
educators and the community at large to name a few.
Sponsored principally by the National Oceanic and Atmospheric Administration
(NOAA) and the National Science Foundation (NSF), CoCoRaHS measures and maps
precipitation (rain, hail and snow). There are currently 23,872 active stations
participating in this network (Colorado Climate Center, 2018).
This manual network requires all participants to be trained, use the same
standardized low cost measurement tools, and upload daily observations (around
07:00 standard time preferred) to an interactive website where data is available in
map and tabular form within minutes (Colorado Climate Center, 2018). Training
materials are provided on the CoCoRaHS website and supplemented with videos
available on YouTube. Conservation Authority staff should also be familiar with the
content to assist with participant questions. The official CoCoRaHS rain and snow
gauge is inexpensive ($30 for registered participants) and simple to use with a mobile
app to upload data. This would only require several minutes daily and can be flexible
and report multi-day totals when daily records cannot be reported. Though snow and
hail can be monitored through this network, they are not mandatory.
Weather Underground:
The Weather Underground program (https://www.wunderground.com/) is a network
of automated personal weather stations. This network, managed by the Weather
Company and the Weather Channel, was initiated in 1993. It has now more than
250,000 weather stations worldwide collecting a variety of measurements including
rainfall, air temperature, atmospheric pressure, and wind speed, reporting this data
in real-time (The Weather Company, 2019). These stations typically involve an
outdoor sensor suite with an indoor electronic console that stores data and uploads
automatically to the online database (Bell, et al., 2013). This data is then
incorporated into Weather Underground’s localized forecasting system with higher
spatial resolution and more frequent updating than those created by other weather
models that do not incorporate personal weather stations (The Weather Company,
2019).
The Weather Underground network collects data using automated personal weather
stations which cost roughly $300 and up, and requires the participant to supply the
station with power and broadband internet. The base station would use approximately
2.5 W and the outdoor sensors require two to four AA lithium batteries which can last
NVCA | Citizen Science Precipitation Monitoring Page 5 of 17for more than 3 years. These stations require annual maintenance (cleaning) and can be expected to function for multiple years. 4. Application of Meteorological CBM at the NVCA Current NVCA weather monitoring network: The NVCA currently has a monitoring network of 12 precipitation gauges within the watershed, some of which are paired with Water Survey of Canada and NVCA stream gauges (Figure 1). There are considerable spatial gaps in Mulmur, Melancthon, Grey Highlands, Clearview and Springwater Townships, located particularly in the headwaters of the Pine and Mad Rivers above the Niagara Escarpment and in the Lower Nottawasaga River subwatershed. CBM is presently not integrated into the NVCA weather monitoring network. Figure 1: Map of the existing NVCA precipitation stations, ECCC meteorological stations, personal weather stations in the Weather Underground network, and manual rain gauges in the CoCoRaHS network. NVCA | Citizen Science Precipitation Monitoring Page 6 of 17
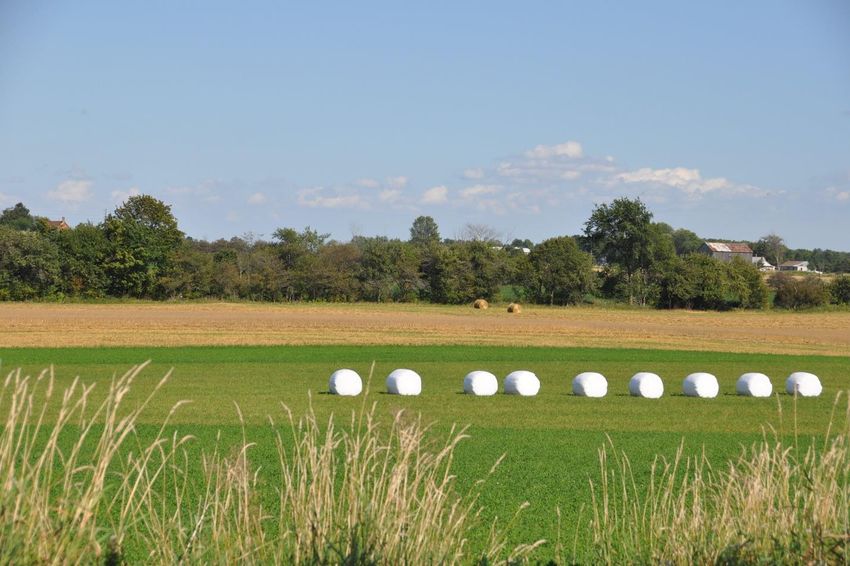
The data from the NVCA-operated network primarily informs flood forecasting and
low water response programs and is used to compare present conditions to past
events. This data is automatically transmitted, or manually retrieved if transmissions
fail, to the SQL server, where this raw data is available online and can also be
downloaded through a login which anyone can obtain. Though there is a list of created
logins, details of user activity are not tracked, and it is unknown how many of these
users remain active. The overall community interest from viewing data (login not
required) is also unknown, though this web page has not been widely advertised.
There are occasional temporal data gaps from this network and there have not been
any quality assurance nor did quality control measures apply to these precipitation
data sets.

Figure 2: Radar map from August 11, 2017, highlighting small storm events with
intense rainfall west of Barrie and Orangeville (ECCC, 2018).

NVCA | Citizen Science Precipitation Monitoring                            Page 7 of 17
The distribution of the NVCA precipitation monitoring network is quite coarse, with a
spatially averaged coverage of 263 km2 per gauge. Summer precipitation events are
important impacting Low Water status, but these events are often highly localized,
as illustrated by the historical radar image in Figure 2, with isolated high intensity
pockets west of Barrie and northwest of Brampton. The NVCA network alone is
insufficient to adequately characterize local-scale precipitation events.

Though not currently being used by the NVCA, there are three other established
networks of rain gauges operating in the area. There are 4 meteorological stations
operated by Environment and Climate Change Canada, 2 CoCoRaHS sites, and 26
Weather Underground stations (though one is currently not reporting) located within
the watershed. The spatial distribution of these networks is illustrated in Figure 1 and
detailed in Appendix A.      When these networks are combined, there remain
considerable spatial gaps in the headwaters of the Mad and Pine Rivers
subwatersheds above the Niagara Escarpment and in the lower reaches of the Mad
River and Lower Nottawasaga River Subwatersheds. However there is an
improvement on the overall network density. Table 1 outlines the number of stations
and their average spatial coverage per station, however, these sites are not evenly
distributed across the watershed (e.g., there are 3 Weather Underground stations –
appearing as one icon in Figure 1, an ECCC station, and NVCA station in the
Collingwood area). The bottom row of Table 1 accounts for clusters of gauges
(frequently found in more urbanized areas such as Collingwood, Alliston, and Barrie)
and counts them once to provide a better estimate of the spatial coverage of the
existing networks.

Table 1: Existing rain gauge coverage within the NVCA watershed.
        Network            Number of       Mean Spatial       Equivalent Mean
                            Stations     Coverage (km2)      Distance Between
                                            per Station        Stations (km)
 NVCA                          12                263                 16
 ECCC                           4                788                 28
 CoCoRaHS                       2              1, 575                40
 Weather Underground           26                121                 11
 NVCA & ECCC                   16                197                 14
 All networks combined         44                72                   8
 Gauge clusters (all)          27                117                 11

Conservation Authorities’ use of metrological CBM:

Conservation Authorities that appeared to have stations within the CoCoRaHS
network (either through the CoCoRaHS station listing or a web search of reference to
CoCoRaHS on Conservation Authority websites) were contacted for further

NVCA | Citizen Science Precipitation Monitoring                              Page 8 of 17
information about their use of the program. The Grey Sauble Conservation Authority (GSCA) incorporates data from both CoCoRaHS and Weather Underground into their monitoring programs (J. Bittorf, personal communication). Kettle Creek Conservation Authority also uses data from both networks to supplement their monitoring network, with several CoCoRaHS stations operated by the KCCA, however, there has not been any external interest from the public to add CoCoRaHS stations (J. Dow, personal communication). Mississippi Valley Conservation Authority occasionally uses data from CoCoRaHS to validate the automated gauge network, but it is not incorporated into their official programs (C. McGuire, personal communication). Figure 3: Stream flow, precipitation and weather gauges, and weather cameras used by the GSCA (2019). Weather icons denote network type (rainy icon is either CoCoRaHS or ECCC; partial sun icon is Weather Underground, WeatherLink, or HOBO stations). Yellow eye icons denote weather cameras. Red star icons denote Water Survey of Canada flow gauges and the coloured map pins summarize the type of data available from flow gauges. NVCA | Citizen Science Precipitation Monitoring Page 9 of 17
The GSCA has a well-established integrated network of professional and CBM
stations. There is a series of three maps available on their Current Watershed
Conditions webpage (http://www.greysauble.on.ca/water-management/current-
watershed-conditions/; GSCA, 2019). These include streamflow, precipitation and
weather stations and weather web cameras (e.g., Figure 3), summary monthly
precipitation, and snow data, collected through snow surveys and modelled by NOAA
for CoCoRaHS sites. Links to the raw data (i.e., to each respective station’s network
website) are easily accessible through these maps. Data from these stations can be
automatically uploaded to their database and links to near-real time graphs for some
parameters (i.e., streamflow) that are stored on Google Drive.

Proposed NVCA CBM model for consideration:

Low cost opportunities exist to enhance the current NVCA meteorological monitoring
network in order to reduce the spatial gaps in the monitoring sites. It is envisioned
that the meteorological network would integrate existing Weather Underground and
CoCoRaHS sites into the internal information management platform to enhance data
used for forecasting delivery. This includes both Low Water Response and the Flood
Forecasting programs. A hierarchical approach will be used for QAQC purposes with
the Environment Canada-NVCA gauges forming the keystone monitoring sites. This
would be complimented by the Weather Underground automated stations and lastly
supported by the manual measurements provided through the CoCoRaHS platform.
There are only 2 current participants of the CoCoRaHS network located within the
NVCA watershed, whereas there are already 26 stations participating in the Weather
Underground network. Additional infill locations are encouraged, particularly in more
rural sites, to further enhance the network density and distribution.

Limitations with CoCoRaHS network includes relying on participants to contribute
data daily (even 0 mm must be reported) and the timing of the once-daily
measurement (morning), making it subject to post-event evaporation and not
temporally compatible with other datasets which provide daily total precipitation to
midnight.

The Weather Underground network requires investing in a network of automated
personal weather stations, but will result in less human measurement error and
greater data reliability, provided they are installed following best practices guidelines.
Event characteristics such as rainfall frequency, duration, and intensity determine
rainfall effectiveness, which are not captured through the manual CoCoRaHS
measurements, directly inform local drought and low water conditions (Wilhite,
2000). Datasets from the automated personal weather stations would also be more
comparable with those of other established meteorological monitoring networks
reporting hourly and daily total precipitation (e.g., Environment and Climate Change
Canada). As this data is available in near real-time, the Weather Underground

NVCA | Citizen Science Precipitation Monitoring                              Page 10 of 17
network can also supplement the established networks to inform flood forecasting
programs.

If pursued, the NVCA would need to champion this endeavor and solicit new and
additional participants to the two platforms. Also, participants need to be distributed
across the watershed. To attain Hubbard’s (1994) recommended rain gauge every
5 km (coverage of 25 km2), 126 station locations would be required, distributed
evenly across the watershed. More realistically, a network of 50 stations would be
distributed across the watershed. This equates a rain gauge every ~8 km with
coverage of 63 km2. This would require an additional 23 monitoring locations
strategically located to infill spatial gaps. In support of this, the NVCA could aid in
the identification of potential suitors however once established let the respective
programs manage these sites and the NVCA scrapping the data for internal uses.

One sector that could assist in the infilling of the spatial monitoring gaps is the
agricultural community. A participant benefit is the access to real-time, and locally-
accurate data that can inform optimal irrigation decision making. Additionally,
members of the agricultural community may already have manual or automated
precipitation monitoring systems in place that could be connected to either of these
broader networks. An open source google earth map/platform that spatially
integrates the three platforms would beneficially be for participant buy in. This is in
line with Tredick et al. (2017) who proposed a system to evaluate citizen science
programs, covering elements of: stakeholder collaboration and program resources;
goals and objectives; design and implementation of monitoring methods; data entry,
storage, analysis and synthesis; reporting and dissemination; and outcome
assessment and program review.

Internally, staff need to be able to easily integrate, manage, analyze, and interpret
the incoming data. For the data to be included as a low water indicator, complete
temporal records at the monthly scale are required. Pairing a manual rain gauge with
an automated station (whether at the same site or in close proximity at neighbouring
properties) would provide quality assurance and quality control to ensure the real-
time data is representative, and fill gaps in the event an automated station
malfunctions. Lessons learned from the Grey Sauble Conservation Authority could be
used if the NVCA decides to implement this endeavor.

5. Conclusion

In order to enhance the understanding of state of the watershed, as relevant to OLWR
and engage members of the agricultural community whose livelihoods depend on
water resources, a network of CBM precipitation stations should be developed. These
stations can infill spatial data gaps, informing low water advisories and aiding the
agricultural community in making water management optimization decisions.

NVCA | Citizen Science Precipitation Monitoring                            Page 11 of 17
Ideally, this endeavor would aim to incorporate automated stations into the Weather
Underground network paired with manual rain gauges of CoCoRaHS for greater data
reliability and value for interpretation and analysis. The envisioned next steps are to
incorporate the existing ECCC, Weather Underground, and CoCoRaHS datasets into
the NVCA Monitoring site. There may additionally be data available from sources
such as Municipal offices with rain gauges. All sites should then have data quality
evaluated for reliability, as complete datasets are required for flood forecasting and
Low Water Response. A spatial analysis of precipitation patterns can then be
conducted to target areas that are high priority for a new rain gauge installation.
Further, an internal data management system is encouraged to be explored to which
the QA/QC’d data from the various platforms can be housed, analyzed, and
integrated via a public facing, web-based platform.

NVCA | Citizen Science Precipitation Monitoring                            Page 12 of 17
References

Bell, S., Cornford, D., & Bastin, L. (2013). The state of automated amateur weather
       observations. Weather, 68(2), 36-41. doi:10.1002/wea.1980

Chen, S., Gourley, J. J., Hong, Y., Cao, Q., Carr, N., Kirstetter, P.-E., . . . Flamig, Z.
      (2016). Using citizen science reports to evaluate estimates of surface
      precipitation type. Bulletin of the American Meteorological Society, 97(2),
      187-193. doi:10.1175/BAMS-D-13-00247.1

Colorado Climate Center. (2018). Retrieved from Community Collaborative Rain,
      Hail and Snow Network : https://www.cocorahs.org/

Dickinson, J. L., Shirk, J., Bonter, D., Bonney, R., Crain, R. L., Martin, J., . . .
      Purcell, K. (2012). The current state of citizen science as a tool for ecological
      research and public engagement. Frontiers in Ecology and the Environment,
      10(6), 291-297. doi:10.1890/110236

Doesken, N. J., & Weaver, J. F. (2000). Microscale rainfall variations as measured
     by a local volunteer network. 12th Conference on Applied Climatology (pp.
     308-311). Asheville, NC: American Meteorological Society. Retrieved from
     https://www.researchgate.net/profile/John_Weaver5/publication/268983248
     _Microscale_rainfall_variations_as_measured_by_a_local_volunteer_network
     /links/547d2a670cf285ad5b088b05/Microscale-rainfall-variations-as-
     measured-by-a-local-volunteer-network.pdf

Doesken, N., & Reges, H. (2010). The value of the citizen weather observer.
     Weatherwise, 63(6), 30-37. doi:10.1080/00431672.2010.519607

Ecological Monitoring and Assessment Network Coordinating Office & Canadian
      Nature Federation. (2003). Improving Local Decision-making through
      Community Based Monitoring: Toward a Canadian Community Monitoring
      Network. Ottawa: Environment Canada. Retrieved from
      http://publications.gc.ca/collections/collection_2014/ec/En40-883-2003-
      eng.pdf

Environment and Climate Change Canada. (2018). Canadian Historical Weather
      Radar - King City (near Toronto). Retrieved from
      http://climate.weather.gc.ca/radar/index_e.html?site=WKR&year=2017&mo
      nth=8&day=11&hour=20&minute=10&duration=2&image_type=PRECIPET_R
      AIN_WEATHEROFFICE

NVCA | Citizen Science Precipitation Monitoring                               Page 13 of 17
Fleener, C., Gofman, V., Peskov, V., Retter, G.-B., & Torikka-Gelencsér, R. (2004).
Community-based Monitoring - A Discussion Paper. CAFF International
Secretariat, Akureyri, Iceland. Retrieved from
http://library.arcticportal.org/1313/1/Community-Based-Monitoring.pdf
Grey Sauble Conservation Authority. (2019). Current Watershed Conditions.
Retrieved from http://www.greysauble.on.ca/water-management/current-
watershed-conditions/
Hecker, S., Bonney, R., Hakley, M., Hölker, F., Hofer, H., Goebel, C., . . . Bonn, A.
(2018). Innovation in Citizen Science - Perspectives on Science-Policy
Advances, 3(1), 1-14. doi:10.5334/cstp.114
Hubbard, K. G. (1994). Spatial variability of daily weather variables in the high
plains of the USA. Agriculture and Forest Meteorology, 68(1-2), 29-41.
Kanu, A., DuBois, C., Hendriks, E., Cave, K., Hartwig, K., Fresque-Baxter, J., . . .
Kelly, E. (2016). Realizing the Potential of Community Based Monitoring in
Assessing the Health of Our Waters. Our Living Waters, Pooling Water
Knowledge Working Group. Retrieved from
http://awsassets.wwf.ca/downloads/realizing_the_potential_of_community_b
ased_monitoring_in_assessing_the_health_of_our_.pdf
Matrix Solutions Inc., & Blumetric Environmental Inc. (2017). Innisfil Creek Drought
Management Plan Pilot Summary Report. Kitchener. Retrieved from
https://www.nvca.on.ca/Shared%20Documents/Innisfil_Creek_Drought_Man
agement_Pilot_Summary.pdf
Ontario Ministry of Agriculture, Food and Rural Affairs (OMAFRA). (2016). Ontario
Low Water Response - Working Together to Manage Low Water. Retrieved
from http://omafra.gov.on.ca/english/environment/facts/low_waterbr.htm
Ren, Y., & Ren, G. (2012). Representativeness of four precipitation observational
networks of China. Acta Meteorologica Sinica, 26(4), 454-466.
doi:10.1007/s13351-012-0405-8
The Weather Company. (2019). Weather Underground. Retrieved from
https://www.wunderground.com/
Tredick, C. A., Lewison, R. L., Deutschman, D. H., Ann Hunt, T., Gordon, K. L., &
Von Hendy, P. (2017). A rubric to evaluate citizen-science programs for long-
term ecological monitoring. BioScience, 67(9), 834-844.
doi:10.1093/biosci/bix090
NVCA | Citizen Science Precipitation Monitoring Page 14 of 17Villarini, G., Mandapaka, P. V., Krajewski, W. F., & Moore, R. J. (2008). Rainfall and
sampling uncertainties: A rain gauge perspective. Journal of Geophysical
Research, 113, D11102. doi:10.1029/2007JD009214
Vinnikov, K. Y., Robock, A., Qiu, S., & Entin, J. K. (1999). Optimal design of surface
networks for observation of soil moisture. Journal of Geophysical Research,
104(D16), 19,743-19,749. doi:10.1029/1999JD900060
Wilhite, D. A. (2000). Chapter 1 Drought as a natural hazard: Concepts and
definitions. In D. A. Wilhite (Ed.), Drought: A Global Assessment (Vol. I, pp.
3-18). London: Routledge. Retrieved from
http://digitalcommons.unl.edu/droughtfacpub/69
NVCA | Citizen Science Precipitation Monitoring Page 15 of 17Appendix A – Rain Gauge Network Association and Start Date
Gauge name Network Location Data
Start
Date
Bailey Creek at 10th Side Road New Tec NVCA Beeton 2007
Beeton Creek Near Tottenham NVCA Tottenham 2005
Innisfil Creek at 5 SD Inni NVCA Innisfil 2007
Mad River Below Avening NVCA Avening 2000
Melancthon Municipal Office NVCA Melancthon 2006
NVCA Admin Office NVCA East of Utopia 2006
Petun C.A. NVCA West of Nottawa 2007
Pine River Near Everett NVCA Everett 2007
Pretty River Near Collingwood NVCA Collingwood 2006
Shelburne WTP NVCA Shelburne 2015
Town of Mono Administration NVCA Mono 2007
Willow Creek Near Minesing NVCA East of Minesing 2006
Borden AWOS2 ECCC Angus 2000
Collingwood3 ECCC Collingwood 1994
Egbert CS4 ECCC Egbert 2000
Mono Centre ECCC Mono 2013
CAN-ON-130 CoCoRaHS Barrie 2014
CAN-ON-153 CoCoRaHS Phelpston 2015
IADJALAT3 Weather Underground Lisle 2017
IBARRIE5 Weather Underground Barrie 2017
ICLEARVI4 Weather Underground Glen Huron 2018
ICOLLING16 Weather Underground Collingwood 2018
ICOLLING19 Weather Underground Collingwood 2018
ICOLLING20 Weather Underground Collingwood 2018
IESSA5 Weather Underground Utopia 2018
IESSA7 Weather Underground Angus 2018
IMONO65 Weather Underground Violet Hill
INEWTECU2 Weather Underground Alliston 2008
INEWTECU3 Weather Underground Alliston 2017
2
Former stations in the immediate vicinity have data for 1926-1945 (Camp Borden A);
1960-1966 (Camp Borden); 1966-1970 (Borden A); 1985-1992 (Borden STP); and 1996-
2013 (Borden).
3
Former stations in the immediate vicinity have data from 1869-1974 (Collingwood) and
1973-1997 (Collingwood WPCP)
4
A former station has data for 1988-2007 (Egbert Care)
5
Currently not reporting data
NVCA | Citizen Science Precipitation Monitoring Page 16 of 17Gauge name Network Location Data
Start
Date
INNISFI9 Weather Underground Churchill 2019
IONALLIS2 Weather Underground Alliston 2012
IONMIDHU2 Weather Underground Snow Valley 2011
IONTARIO177 Weather Underground Stayner 2006
IONTARIO220 Weather Underground Violet Hill 2007
IONTARIO492 Weather Underground Tottenham 2012
IONTARIO598 Weather Underground Barrie 2013
IONTARIO631 Weather Underground Beeton 2015
IONTARIO1146 Weather Underground Midhurst 2016
IONTARIO1150 Weather Underground Barrie 2016
IONTARIO1155 Weather Underground Rosemont 2016
IONTARIO1181 Weather Underground North of Barrie 2016
IONTARIO1316 Weather Underground Devil's Glen 2016
IONTARIO1320 Weather Underground Tottenham Airfield 2016
IWASAGAB2 Weather Underground Wasaga Beach 2016
NVCA | Citizen Science Precipitation Monitoring Page 17 of 17You can also read