Durian Global Market Report - Growing Your Future - Plantations International
←
→
Page content transcription
If your browser does not render page correctly, please read the page content below
Durian
Global Market Report

     Growing Your Future
      www.DurianHarvests.com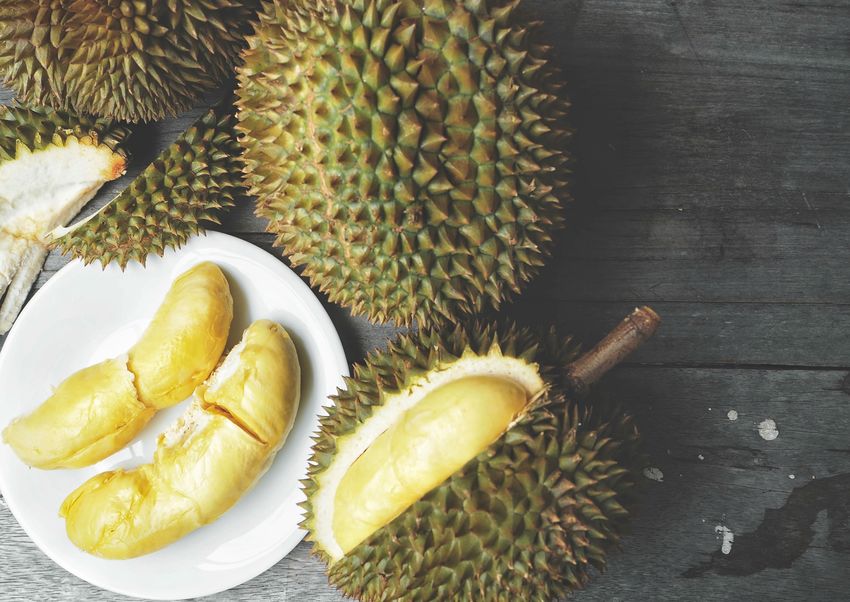
CONTENTS
Introduction                            04
UN Comtrade – Explained
Trade Map – Explained
Research Data Observations

Introduction to Durian Types & Prices   08
Durian Market Price

Global Durian Trade                     10
Introduction
Durian Exports
Durian Imports

Global Durian Demand                    17
Current Durian Demand
Domestic Consumption per Capita
China’s Rising Consumption

Global Durian Supply                    21
Current Durian Supply
Durian Production Figures

Expected Market Growth                  25
Global Durian Trade
Durian Supply Requirements
Musang King Supply Requirements
Introduction

This report quantifies the size of the Durian market in terms of volume and value for Durian fresh fruit and
related by-products by analysing recorded levels of world trade. Further, the report intends to estimate supply
levels needed to sustain current and future requirements of Durian, specifically for the Musang King variety.

The analysis indicates that the retail value of Durian consumed globally in fresh fruit form reached 15 USD
billion in 2016. The total value of the entire Durian market however is significantly higher if one takes into
account Durian end products. Durian end products include the market segments of desserts, snacks and
beverages. Durian’s share of these markets is unknown but combined in Asia are worth over 275 USD billion
annually and growing. Additionally, the analysis reveals the necessity for more plantations in order to supply
the growing needs of the global market, particularly from China.

Although a variety of data sources have been utilised in this report, the two primary sources of data for
world trade come from UN Comtrade, published by the United Nations Statistics Division and Trade Map, a
subsidiary organisation of the World Trade Organization (WTO).

4
Introduction

UN Comtrade – Explained                                Trade Map – Explained

UN Comtrade is the pseudonym for United                Trade Map is a trade statistics data portal
Nations International Trade Statistics Database.       developed by the International Trade Centre
Over 170 reporting countries/areas provide the         (ITC), (a subsidiary of the World Trade Organization
United Nations Statistics Division (UNSD) with their   (WTO)) and the United Nations Conference on
annual international trade statistics data detailed    Trade and Development (UNCTAD). Like UN
by commodities/service categories and partner          Comtrade, it categorizes data based on HS
countries. This data is subsequently transformed       Codes, with Durian fruit trade tracked by the HD
into the UNSD standard format with consistent          Code 081060.
coding and valuation using their processing
system. UN Comtrade is the largest depository of       Trade Map is similar to UN Comtrade, and in fact
international trade data, containing well over 3       uses UN Comtrade data as a key source for its
billion data records since 1962.                       own data however it does have a noteworthy
                                                       difference. Trade Map also contains additional
Data is categorized by a ‘Harmonized System’ of        data for countries that do not report their national
codes known as HS Codes. This is a standardised        trade statistics to UN Comtrade. The trade of
numbering system for classifying imported and          unreported countries is reconstructed by Trade
exported products. HS Codes are used globally by       Map on the basis of data reported by partner
countries as a basis for recording customs tariffs,    countries and is called mirror data. This Trade Map
quota controls, place of origin, and trade policy.     feature at times can provide a more thorough
The base system uses a 6 digit number (HS Code),       and complete picture of world trade relative to
with countries allowed to add up to an additional      the figures UN Comtrade provides.
4 digits for deeper product classification. In
essence, the longer the code, the more detailed
the product description.

The HS Code applicable to Durian fruit is 081060
(Fruit, edible; durians, fresh). This code records
global trade solely in fruit form.

                                                                                                         5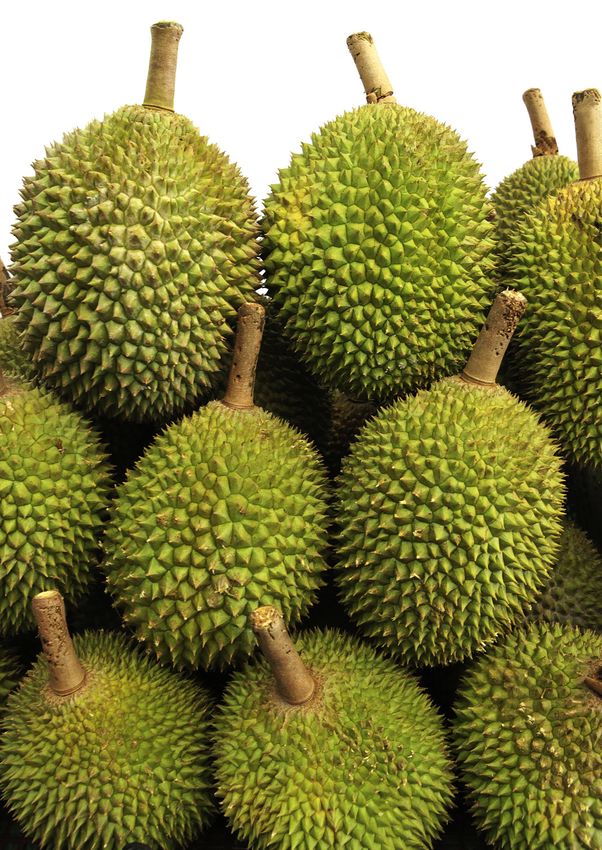
Introduction

Research Data Observations
The following are key observations and/or issues that came to light when collating data and compiling this
report:

      Reported trade data does not take into account different varieties of Durian instead combining
      them all together. Additionally, reported import and export trade values are believed to be
      undervalued due to importers and exporters likely under declaring value. This report takes the
      retail value of Durian fruit into account.

      Data reported by UN Comtrade and Trade Map are almost identical with the only key noticeable
      difference being reported trade from Vietnam. UN Comtrade reports no import and export data
      in 2016, while Trade Map reports imports of 84.88 million KG and exports of 407 thousands KG. This
      report takes Vietnam’s Trade Map trade data into account.

      Indonesian trade data sourced from Statistics Indonesia known as Badan Pusat Statistik, the
      countries statistical agency, is significantly different than data reported by Trade Map and UN
      Comtrade. For example, Trade Map and UN Comtrade report no exports in 2015 and yet Statistics
      Indonesia reports 410 million KG. This report takes 2015 Statistics Indonesia data into account
      purely for domestic consumption and production purposes. Trade Map’s 2016 Indonesian
      exports are utilized for global trade calculations since Statistics Indonesia does not report their
      export’s destination countries. Including their exports without knowing their end destination
      would create a global trade imbalance.

      Vietnam in 2016 appeared as a key Durian importer for the first time. Although experts believe
      that up to 85% of their imports are re-exported to China, trade statistics state otherwise. The
      values contained in this report are based solely on official Trade Map statistics rather than
      unsubstantiated claims.

      Hong Kong in 2016 reportedly imported 318.80 million KG of Durian yet exported 301.80 million
      KG – the majority of which likely went to China. Hong Kong is a known re-export trade hub
      throughout the region and this data has confirmed this. As a result, imports for Hong Kong in this
      report refer to net import data rather than gross, to represent trade more accurately.

      China is believed to be the destination for the majority of Hong Kong’s re-exports of Durian
      however it is not known if these are fully considered in China’s import figures. If they are not
      taken into account this may mean China may have imported up to 620 million KG in 2016. This
      figure is based on adding HK re-exports to Chinese imports. In addition, Hong Kong although
      an autonomous territory is a Special Administrative Region of China, with trade between the
      countries unreported in some cases.

      Actual trade in China is likely significantly higher than reported by Trade Map and UN Comtrade
      due to illegal and unreported trade. For example, China at the moment does not allow fresh
      whole Durian fruit imports from Malaysia although they are known to be sold in China. Additionally,
      Statistics Indonesia reports a large volume of exports which are likely destined to China but are
      not reported by Trade Map and UN Comtrade. This implies that there is some level of unreported
      trade occurring although the figure is unknown. This report does not take this into account.

6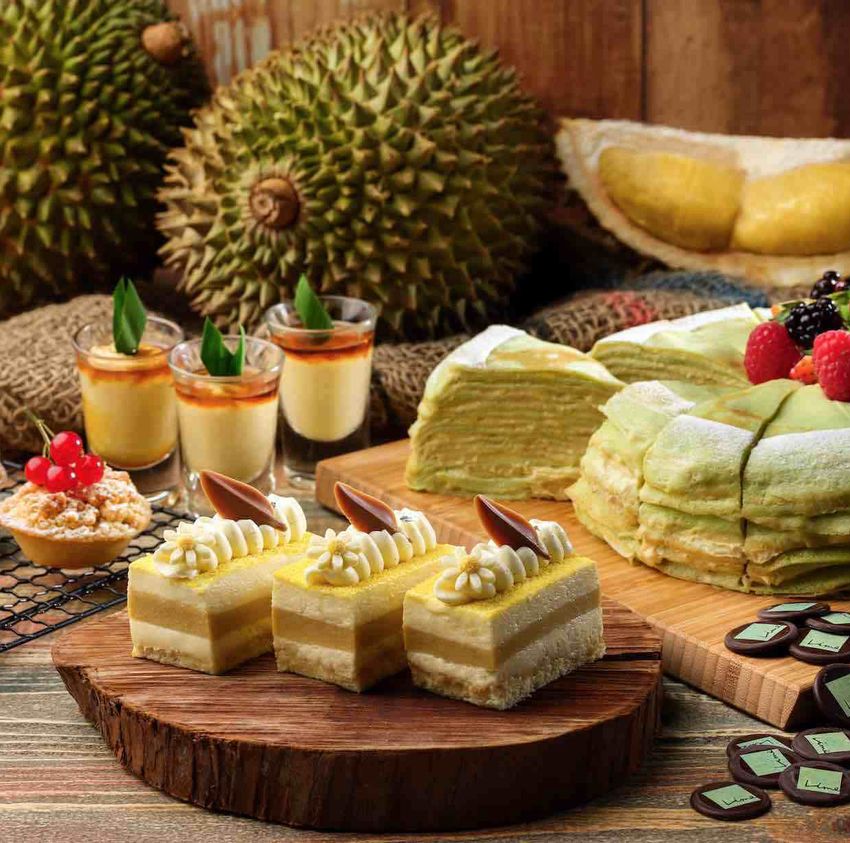
Introduction

Hong Kong Data Further Explained

Imports for Hong Kong are based on net imports rather than imports, in order to more
accurately represent trade. Hong Kong is a known re-exporter primarily to China and
utilising their import figures would distort and misrepresent the entire market. According
to Trade Map, Hong Kong imported 318.80 million KG of Durian, which would make it
the world’s largest importer. However, Trade Map also indicates Hong Kong exported
301.80 million KG of Durian. These figures indicate that Hong Kong is re-exporting the
majority of Durian, most likely to China.

Furthermore, consumption per capita was analysed and compared regionally to test
and re-confirm the rationale that Hong Kong’s imports distort market data. Trade Map
imports indicate a consumption of 43 KG per capita which is unrealistic, as Malaysia is
known to be the largest consumer of Durian and has a per capita consumption of 11 KG.
Utilizing Trade Map net imports on the other hand results in a per capita consumption
of 2.30 KG per capita which is in line with other regional consumers such as Singapore
and Taiwan.

                                                                                             7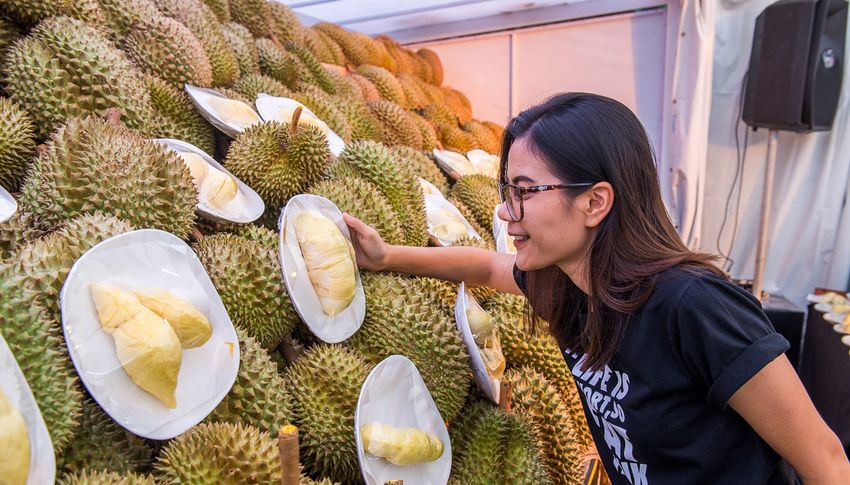
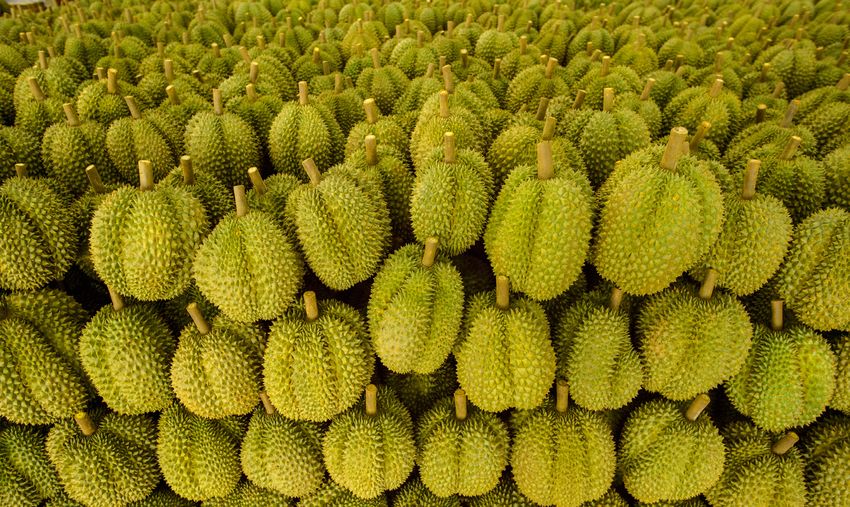
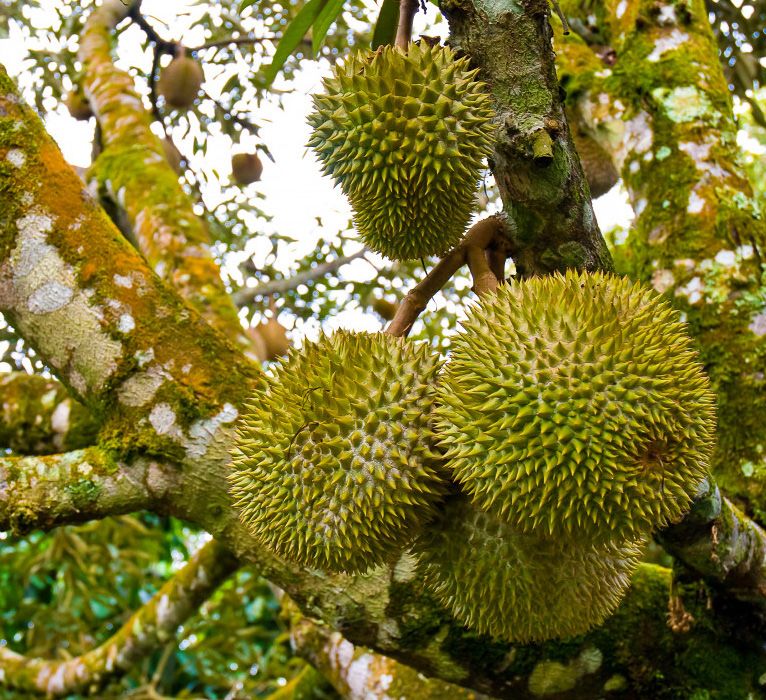
Introduction To Durian Types & Price

Durian is regarded by many people in Southeast Asia as “The King of Fruits”. The fruit is known for its thorn
covering, unique taste and distinctive aroma. The term Durian emerged from the fruit’s distinctive thorn
covering and comes from the Malay word Duri which means thorn. The Durian is believed to have originated
from the Malay Archipelago. Although the Durian tree is native to Malaysia, Brunei and Indonesia, it is also
grown in Thailand, the Philippines and Australia.

Durian is the fruit of several tree species belonging to the genus Durio. There are 30 recognized Durio species,
at least nine of which produce edible fruit. There are over 100 named varieties in Indonesia, 300 in Thailand and
100 in Malaysia. Local Durian varieties are officially registered with the government of each country. Over the
centuries, numerous Durian cultivars, propagated by clones, have arisen in Southeast Asia. A Durian cultivar
is essentially a specific variety of Durian that has been deliberately selected for desirable characteristics such
as fruit shape, size, smell, colour, texture, taste and tree characteristics. Most cultivars have a common name
and a code number starting with “D”.

Durian, once considered a niche fruit is now gaining mass appeal with Durian demand, namely for the Musang
King variety spreading throughout Asia. Demand has been driven predominantly by Chinese consumers who
have become fascinated with it due to its unique taste and health benefits. Demand for Durian fruit has
been rising due to Chinese consumer demand in terms of the fresh fruit and from F&B companies. Demand
has been growing enormously with new Durian based products continuously being developed. Major global
companies such as Nestle, F&N, McDonalds and Pizza Hut have all released Durian based products in effort
to capture this growing market. F&B products cover 3 key market segments – Desserts which include Durian
desserts such as ice cream and cakes, Snacks such as chips and candies and Beverages such as coffee and
tea.

8
Introduction To Durian Types & Price
Durian Market Prices
The following price lists are provided as a guide for some of the most popular Durian varieties. Pricing has
been collated from a variety of local based stores and converted to USD/KG. Kindly note that these prices are
for reference purposes only with Durian market prices often changing due to seasonality and other demand
and supply factors. Additionally, market prices are also a function of store location and perceived quality.
Figure 1 – Local Durian Prices
Source: Durian Harvest
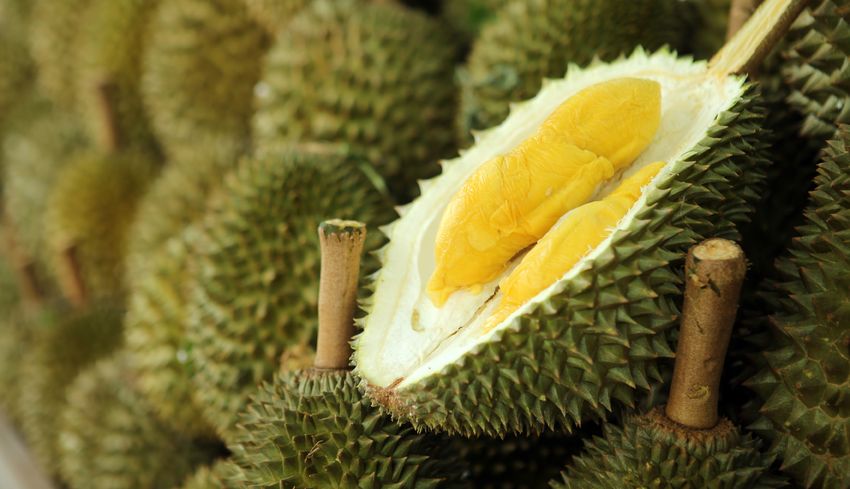
Figure 2 – Musang King Prices
Musang King Durian which is also known as Mao Shan Wang or
D197 is the most sought after and expensive Durian variety due to
its appealing flavour and texture. Prices for Musang King Durian in
the key markets of Malaysia, Singapore, Hong Kong and China are
provided below for reference purpose. The following prices are as of
late 2017.
Source: Durian Harvest
9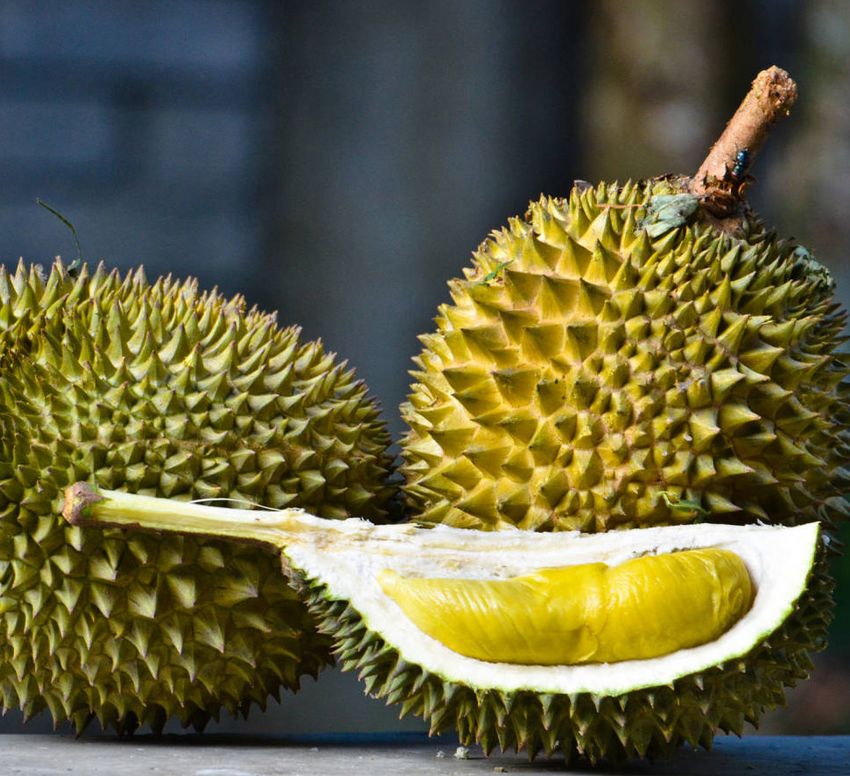
Global Durian Trade

Introduction
Global trade in Durian fruit is dominated by two countries at the moment - Thailand dominates exports
and China dominates imports. According to Trade Map, the two largest exporters of Durian fruit in 2016
were Thailand and Malaysia with 403 million KG and 18 million KG respectively. Together these two countries
accounted for 99% of global exports. It is important to note that data from Indonesia’s statistical department
indicates that Indonesia exported an average of 470 million KG of Durian over the past two years while Trade
Map reports an average of 5 thousand KG. Trade Map data is the basis of global trade in this report and was
assumed to be more accurate and reliable. This notable difference however does raise a red flag in terms
of data accuracy. If Indonesia data was confirmed reliable, Indonesia would in fact be the world’s largest
exporter. Although Thailand and Malaysia are the largest exporters of Durian, the composition of their markets
is quite different. Thailand’s production is predominately exported, while production in Malaysia is consumed
domestically.

Global trade in Durian can be quantified in two ways. Firstly via trade in raw fruit form and secondly through
trade in Durian based end products. The retail value of Durian fruit trade, domestically and internationally,
in raw fruit form (fresh, frozen, paste and pulp) was estimated to have a retail value of over 15 USD billion in
2016. Global demand by 2030 is conservatively expected to grow to more than 25 USD billion, driven primarily
by Chinese demand.

In terms of Durian end products, the global trade value is difficult to ascertain due to the limited availability
of data. Durian is still considered a relatively niche product with growth still in its infancy. Durian end products
include the market segments of desserts, snacks and beverages. Its share of these markets is unknown but
combined in Asia are worth over 275 USD billion annually and growing. Durian end products have been
growing in prominence over the past couple of years with large F&B brands such as Pizza Hut, KFC, Nestle and
Starbucks introducing products to capture customer demand.

The Durian market is in the unique position of not only being in high demand but also of being insufficiently
supplied. Specifically, the Musang King Durian variety from Malaysia is highly demanded in the region due
to its superior flavour. Existing supply levels have been insufficient to meet demand leading to rising prices for
all consumers, none more so than in China. Additional supplies will be needed to meet rising demand with
global trade expected to reach 2 billion KG by 2030. This is without taking a significant increase in Chinese
consumption per capita into account - which is highly likely. At the moment China’s only consumes 0.21 KG
of Durian per capita compared to comparable countries such as Singapore, Taiwan and Hong Kong with
approximately 3 KG per capita.

10
Global Durian Trade

Durian Exports
According to Trade Map, the largest exporter of Durian
fruit globally in 2016 was Thailand with approximately 95%         Figure 3 – Global Durian Exporters (Volume)
followed by Malaysia with 4%. In terms of volume, Thailand
and Malaysia exported 402.70 million KG and 17.75 million
KG, respectively. Thailand’s dominance over Malaysia in
the export market has existed for over a decade. It has
occurred for three inter-related reasons: domestic market
fundamentals, supply and trade regulation.

Durian is native to both Thailand and Malaysia, with over
300 named Durian fruit varieties in Thailand and over 100 in
Malaysia. Although consumption is high in both countries,
it is significantly larger in Malaysia. Both countries exhibit
different domestic market fundamentals, with Malaysian
durian consumption per capita in 2016 reaching 11 KG
while Thailand’s was 1.5 KG.

                                                                                                   Source: Trade Map

Thailand’s consumption per capita has notably changed since 2008 dropping from approximately 6 KG to
1.5 KG in 2016 driven by a lucrative export market. Durian exports have significantly increased over the years
accounting for 38% of Thailand’s total Durian production in 2008 and rising to 80% in 2016. The increase in
exports is due to rising Chinese demand rather than any sudden change in Thailand’s appetite for Durian.
This implies that Thailand may be facing a supply shortage unable to cope with both internal and external
demand and that the price increase of Durian abroad has made it substantially more profitable to export.

Malaysia has historically had a higher level of per capita consumption than Thailand and still does. This
factor combined with the limited supply of its Musang King Durian variety, which is in high demand, and
Chinese restrictions on its fresh fruit has limited its Durian exports. Malaysian Durian production has risen from
an average 300 million KG over the period 2005-2010 to approximately 370 million KG. The fact that exports
have still remained at such low levels despite production rising and Musang King being so expensive and in
high demand indicates there is insufficient supply to meet demand domestically and abroad.

The price of Malaysia’s Musang King Durian is up to 350% higher than in Malaysia, selling for over 120 USD/KG.
The high price is a combination of demand arising from its superior flavour and the lack of available supply.
China does not currently allow for fresh fruit Durian imports in whole form meaning all such Durian sold is
illegally brought in and thus commanding a high price. China currently only allows Malaysian Durian imports
in pulp, frozen and chilled form although this is expected to change in 2019.

                                                                                                                       11
Global Durian Trade
As can be seen in Figure 4, Chinese Durian imports have
Figure 4 – Chinese Imports vs. Key Exporters
risen substantially since 2002. Chinese consumption in (KG, ‘000)
the last decade has increased 13% p.a, with Thai exports
keeping pace growing 11% p.a. Malaysian exports on the
other hand have only increased negligibly by 0.41% p.a.
since 2006. Malaysian Durian, primarily of the Musang
King variety, commands substantial price premiums on
the export market. The fact that Malaysian exports have
been flat over the years indicates a fundamental issue
with their Durian market. Its growth has been limited due
to lack of supply and Chinese fresh whole fruit import
restrictions.
The Malaysian government, upon noticing the significant
loss of potential earnings due to the rise in price and
high demand for its most expensive Musang King
variety, has begun to actively make it a point of focus.
The government has made Musang King domestic
production and exports a key priority recently with both
the Ministry of Agriculture and Agro-based Industry
along with FELDA (Federal Land Development Authority)
promoting Durian globally.
Source: Trade Map
In late 2017, Malaysia held a 3 day Musang King Durian festival in Nanning, China that had over 160,000 visitors,
with many queuing up to three hours under rain and sun to try the Durian. The event was highly successful and
confirmed the marketability and demand for Musang King. The Malaysian government on the back of this
has spearheaded efforts for fresh fruit importation approval. Malaysia’s Agriculture and Agro-based Industry
Ministry is expected to receive approval to export fresh whole Musang King Durian sometime in 2019.
Unlike Malaysian Durian, Durian from Thailand faces no trade restrictions. Approximately 80-90% of Thailand’s
Durian production has been exported to China annually between 2012 and 2017. Thailand is one of China’s
largest suppliers across a variety of fruits and vegetables, in addition to Durian, due to the Free Trade Agreement
signed between the countries in June 2003. Under the agreement, tariffs for 188 types of fruits and vegetables
were cut to zero resulting in Thailand’s produce flooding the Chinese market and dominating market share.
As can be seen in Figure 6, Thailand has been supplying China with essentially all their imports of Durian.
Monthong Durian is the main variety exported due to its flavour being sweeter than other Thai varieties and
more appealing to Chinese consumers and other foreign markets. Monthong can also be kept under suitable
conditions for a longer time, around 20 days, without overly softening or spoiling. This feature allows Monthong
to be exported to more distant markets than is possible with other Thai varieties.
1213
Global Durian Trade

Durian Imports
China is the world’s largest importer of Durian            Figure 5 – Global Durian Importers

with approximately 292 million KG imported in
2016. Its imports have risen significantly over the
past decade, up 13.12% p.a. between 2006 and
2016. China accounts for 60 - 80% of global imports
depending on the source of data. UN Comtrade
data indicates the figure is 82% while Trade Map
suggests its 66%. This is due to Trade Map including
Vietnamese imports based on mirror data which
raised total global imports and reduced China’s
share.

It is important to reiterate that imports for Hong
Kong are based on net imports rather than
imports, in order to more accurately represent
trade. Hong Kong is a known re-exporter primarily
to China, thus utilising their reported import figures
would distort and misrepresent the entire market.
For example, according to Trade Map Hong Kong
imported 318.80 million KG of Durian, which would
make it the world’s largest importer. However,                                                        Source: Trade Map

Trade Map also indicates Hong Kong exported
301.80 million KG of Durian. These figures indicate
that Hong Kong is re-exporting the majority of
Durian, most likely to China.

Although China dominates imports, its fascination with Durian is only a decade old. Durian fruit is not native
to China with Chinese consumers first exposed to it in Thailand and Malaysia. Chinese imports in terms of
volume began increasing notably from 2006, rising 13% p.a. between 2006 and 2016. Though the volume
increase is substantial, it has been significantly outpaced by the increase in the value of imports in which rose
23% p.a. over the same time period. Although this rapid growth has surprised many it has not been entirely
unexpected. Durian consumption has been high for decades in regional countries with ethnic Chinese
populations. Mainland Chinese have similar taste profiles with consumption per capita logically following a
similar path. The question regarding Chinese Durian imports is a matter of when rather than if imports will rise
substantially.

Figure 6 – China: Imports of Durian (USD ‘000)             Durian from Thailand has thus far completely
                                                           dominated Chinese imports. This development is a
                                                           result available supply rather than demand driven
                                                           through a superiority of product over Malaysian Durian.
                                                           Malaysia Durian, particularly the Musang King variety,
                                                           is known to be in higher demand due to its superior
                                                           flavour profile but limited supply and Chinese import
                                                           restrictions have hindered exports. China currently
                                                           does not allow for Malaysian Durian to be imported in
                                                           whole form, requiring imports to be in frozen, pulp or
                                       Source: Trade Map
                                                           paste form.

14
Global Durian Trade
Thailand on the other hand has had open access to the entire Chinese market with no restrictions upon
the signing of a Free Trade Agreement between both countries in June 2003. It is thus no surprise to see that
Chinese imports grew significantly post the agreement and that Thailand has dominated imports entirely.
Malaysia since 2017 has actively made Musang King Durian a point of focus after realizing the significant loss
of potential earnings due to record prices and its high demand. China in 2019 is expected to approve Durian
imports from Malaysia in whole fruit form which is expected to drastically alter the Durian marketplace with
Malaysia capturing market share from Thailand.
Vietnam is the world’s second largest importer of Durian according to Trade Map data although it does not
report trade statistics. UN Comtrade excludes Vietnam but Trade Map estimates its imports based on data
reported by partner countries known as mirror data. Vietnam reportedly imported 85 million KG of Durian in
2016 accounting for 19% of global imports. Vietnam was followed by Singapore and Hong Kong with 4% each
or 17 million KG and 17.9 million KG, respectively.
Vietnam surprisingly accounts for a large share of global imports according to Trade Map. This data is
unexpected and has been noted by other experts in the field as well. Some believe that imports are being re-
exported to China rather than domestically consumed. For example, Panuwat Maikaew who is the president
of the Chanthaburi Durian and Mango Export Association in Thailand believes 80-85% of Vietnams imports
are re-exported to China. Trade statistics indicate otherwise however with Trade Map reporting a negligible
amount of exports totalling 407,000 KG in 2016.
Figure 7 – Major Durian Export Transport Routes
Source: Nikkei Asian Review (2018) Thai exports of ‘the king of fruits’ surge to
China, Available at: https://asia.nikkei.com/Business/Business-Trends/Thai-ex-
ports-of-the-king-of-fruits-surge-to-China (Accessed: 2018).
This report is based purely on reported trade data rather than unsubstantiated claims. Nonetheless, the claims
may indeed be accurate and present a concern that trade statistics are under-reporting Durian trade entirely.
Cross-border roads have been built and continue to be built. Those roads connected Vietnam, Laos, Thailand,
Myanmar and Cambodia. This has increased ground transportation and trade rapidly by connecting China
to the countries of the Mekong Basin. It is believed that Durian from Thailand is flowing through Vietnam
through these roads and not captured as exports due to tax reasons or inefficiency in border controls.
1516
Global Durian Demand

Current Durian Demand
Global     demand in 2016 was estimated to
                                                         Figure 8 – Global Demand (2016)

be 1.5 billion KG. In terms of retail value, that is
approximately 15 billion USD based on a retail price
of 10 USD/KG. Global trade indicated by import
volumes accounted for 30% of total demand with
the largest domestic consumers being Indonesia,
Thailand and Malaysia.

Global demand has been quantified by combining
global trade measured by imports and the domestic        Sources: Trade Map
consumption of Thailand, Malaysia and Indonesia.         Wannarat Tantrakonnsab and Nattapon Tantrakoonsab (2018) Thai Export of Durian to
                                                         China: BRC Research Report Bangkok Research Center, JETRO.
                                                         Jabatan Pertanian (Department of Agriculture) (2015) Statistik Tanaman Buah-Buahan
Thailand, Malaysia and Indonesia are known to be         (Fruit Crops Statistics): Jabatan Pertanian (Department of Agriculture). [2015 data was
                                                         used a proxy]
large consumers of domestically grown Durian fruit       Beritagar (2018) Produksi buah nasional masih berpusat di Jawa , Available at: https://
                                                         beritagar.id/artikel/berita/produksi-buah-nasional-masih-berpusat-di-jawa (Accessed:
which is not taken into account in trade data.           2018). [2015 data was used a proxy]
                                                         Beritagar (2018) Berburu durian, nangka, dan rambutan di musim penghujan ,
                                                         Available at: https://beritagar.id/artikel/berita/berburu-durian-nangka-dan-rambutan-
                                                         di-musim-penghujan (Accessed: 2018).

As a result, their data was added to get a more complete and thorough representation of demand. Other
countries such as the Philippines, Vietnam and Australia produce Durian that is domestically consumed as
well however their combined quantity is relatively insignificant. Their data was considered immaterial to this
analysis and was not taken into account.

Once again it is important to note that data from the Indonesia’s statistical department, Badan Pusat Statistik,
indicates that Indonesia exported an average of 470 million KG of Durian over the past two years while
Trade Map reports an average of 5 thousand KG. Data from the Indonesian government was assumed to be
accurate for domestic consumption purposes as it results in a per capita figure of 2.40 KG which is in line with
other reports. Global imports however are based on Trade Map data for data consistency throughout this
report. It is important to note however that if Indonesia reported data is indeed accurate, it would result in
global import figures being underreported by Trade Map by approximately 470 million KG. Trade Map figures
are relied upon by industry analysts and the media which is worrisome considering they are almost definitely
inaccurate.

                                                                                                                                           17
Global Durian Demand
Domestic Consumption per Capita
Malaysia is the world’s largest consumer of Durian Figure 9 – Consumption per Capita (KG, 2016)
fruit per capita with an estimated 11 KG in 2016. To
put this figure into perspective Malaysia per capita,
consumed approximately 1.8x more Durian than
beef and 3x more Durian than tomatoes. Unlike
other countries Malaysian consumption is almost
entirely supplied by domestic supply. It imported
11.9 million KG of Durian and consumed 381 million
KG in 2016.
Thailand, despite being one of the largest
producers and exporters of Durian, surprisingly lags
other regional countries in terms of consumption.
Thailand’s consumption has notably changed since
2008 dropping from approximately 6 KG per capita
to 1.5 KG in 2016. As can be seen in Figure 10, exports
and domestic consumption per capita have been
inversely correlated since 2010. Durian exports have Sources: Trade Map
The World Bank [population data]
significantly increased over the years accounting Department of Statistics Malaysia (2015) Supply and Utilization Accounts Selected
Agricultural Commodities, Malaysia 2010-2014: Department of Statistics Malaysia. [2014
for 38% of Thailand’s total Durian production in 2008 Malaysian data was used a proxy]
Beritagar (2018) Produksi buah nasional masih berpusat di Jawa , Available at: https://
and rising to 80% in 2016. beritagar.id/artikel/berita/produksi-buah-nasional-masih-berpusat-di-jawa (Accessed:
2018). [2015 data was used a proxy]
Beritagar (2018) Berburu durian, nangka, dan rambutan di musim penghujan ,
Available at: https://beritagar.id/artikel/berita/berburu-durian-nangka-dan-rambu-
tan-di-musim-penghujan (Accessed: 2018).
Wannarat Tantrakonnsab and Nattapon Tantrakoonsab (2018) Thai Export of Durian to
China: BRC Research Report Bangkok Research Center, JETRO.
The reduction of domestic consumption is believed to be attributed entirely to growing Chinese demand rather
than any sudden change in Thailand’s appetite for Durian. This indicates that Thailand is likely facing a supply
shortage unable to cope with both internal and external demand. The substantial price increase of Durian
abroad has made it considerably more profitable to export likely impacting access to supply domestically.
Figure 10 – Thailand: Exports vs. Consumption per Capita
Exports (KG,m.) KG per Capita
450 7.00
400
6.00
350
(KG per capita)
5.00
(KG, million)
300
250 4.00
200 3.00
150
2.00
100
1.00
50
0 0.00
2008 2010 2012 2014 2016
Source: Trade Map
The World Bank [population data]
Karolien Bais (2016) Why Thailand is the leading exporter of durian, mangosteen and other tropical fruits: UTAR Agriculture Science Journal.
Wannarat Tantrakonnsab and Nattapon Tantrakoonsab (2018) Thai Export of Durian to China: BRC Research Report Bangkok Research
Center, JETRO.
18Global Durian Demand
China’s Rising Consumption
China’s consumption per capita in 2016 was 0.21 KG which was significantly lower than other regional
countries. China’s fascination with Durian however is only a decade old with consumers first exposed to it
abroad in Thailand and Malaysia. As a result per capita consumption is expected to rise significantly over
time. Thailand has dominated exports to China due to their astute focus on China as a key export destination
and the existing Free Trade Agreement which began in 2003. China’s consumption per capita has increased
13% p.a. since 2006 from 0.07 KG to 0.21 KG in 2016. If growth continues as it has, consumption is expected to
reach 1.11 KG per capita by 2030. Growth is expected to realistically reach 3 KG per capita in the long term
so that it is in line with regional countries with similar tastes.
Figure 11 – Chinese Consumption Per Capita
1.20
1.00
0.80
(KG per capita)
0.60
13% p.a.
(2006-16)
0.40
0.20
0.00
2002 2006 2010 2014 2018 2022 2026 2030
Sources: Trade Map, The World Bank [population data]
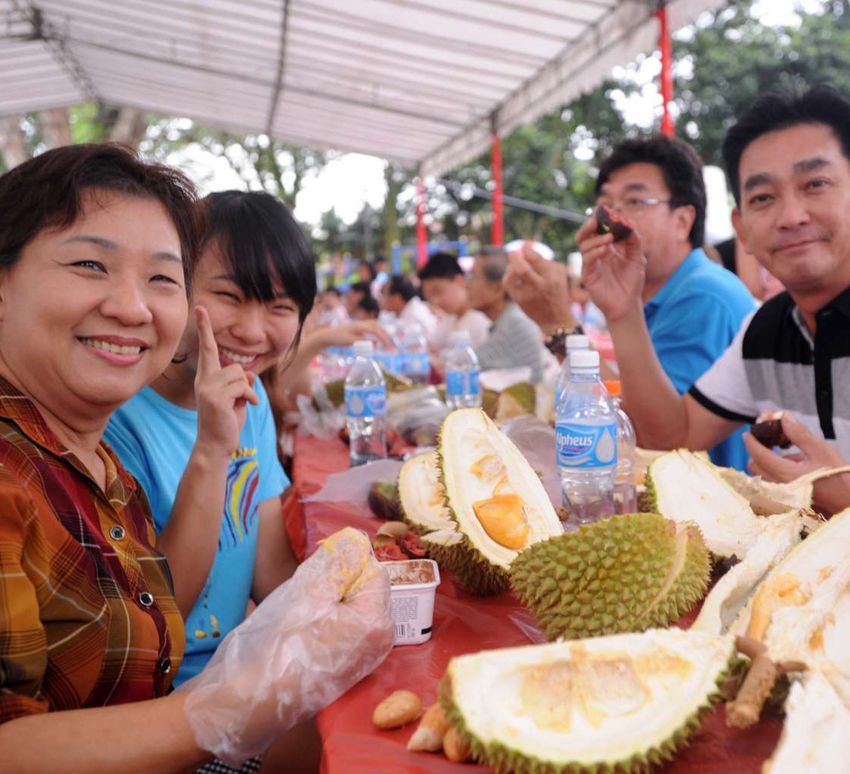
19Global Durian Demand Although Durian consumption in its totality is expected to increase there is one variety which is specifically demanded, Musang King. Musang King Durian demand is already high with limited supplies increasing prices globally none more so than in China. Demand has been so exorbitant from the Chinese that entire industries have developed to cater to it. Travel agencies have set up travel packages around Durian providing Chinese tourists with flights, accommodation and Durian plantation tours. In addition, some plantations have also begun offering their own tours and even built accommodation on site to cater to Chinese tourists. Spas have also been developed on Durian plantations too. All this is in addition to multiple renowned hotels, such as the Shangri-La, offering durian travel and dining packages. Malaysia has historically had a higher level of per capita consumption than Thailand and still does. This factor combined with the limited supply of its highly in demand Musang King Durian variety and Chinese restrictions on its importation has limited its Durian exports. Malaysian Durian production has risen from an average 300 million KG over the period 2005-2010 to approximately 370 million KG in 2016. The fact that exports have still remained at such low levels, despite production rising and Musang King being so expensive and in high demand, indicates there is insufficient supply to meet demand domestically and abroad. This has stifled Chinese imports and consumption which is expected to increase substantially once Malaysia receives approval for fresh whole fruit exports sometime in 2019. 20
Global Durian Supply

Current Durian Supply
Global supply based on total production in 2016                                     Figure 12 – Total Production (%. 2016)
was estimated to be 1.6 billion KG. Indonesia was
the world’s largest producer with 47% followed by
Thailand with 33% in 2016. This figure was based on
the production levels of known key producers –
Thailand, Malaysia and Indonesia. Other countries
such as the Philippines, Vietnam and Australia
produce Durian as well however their quantity
is relatively insignificant and was not taken into
account. Other countries not included in this
analysis are believed to account for approximately
5% of total production and are entirely focused on
domestic consumption rather than exports.

It’s important to highlight that global demand
earlier in this report was reportedly 1.5 billion KG.                            Sources:
                                                                                 Beritagar (2018) Berburu durian, nangka, dan rambutan di musim penghujan , Available at:
Demand and supply should realistically equal                                     https://beritagar.id/artikel/berita/berburu-durian-nangka-dan-rambutan-di-musim-penghu-
                                                                                 jan (Accessed: 2018).
each other although this is rarely the case when                                 Wannarat Tantrakonnsab and Nattapon Tantrakoonsab (2018) Thai Export of Durian to Chi-
analysing trade data.                                                            na: BRC Research Report Bangkok Research Center, JETRO.
                                                                                 Jabatan Pertanian (Department of Agriculture) (2016) Statistik Tanaman Buah-Buahan (Fruit
                                                                                 Crops Statistics): Jabatan Pertanian (Department of Agriculture).

The mismatch is due to inefficiency in data collection by reporting bodies. This inefficiency means that trade
data tends to underreport actual trade. As an example of data discrepancy, data from Indonesia indicates
it exported an average of 470 million KG over the past two years while Trade Map reports an average of 5
thousand KG. Supply data was based on each country’s records of production while trade data was based
on Trade Map. It is worth noting is that total production levels are deemed to be more accurate than Trade
Map figures because they rely on data directly from only 3 countries compared to over 40 for Trade Map
which is based on import and export data.

                           Figure 13– Total Production (KG ‘000, 2005-2016)

                                                         Indonesia                   Thailand                   Malaysia
                           1,200,000

                           1,000,000

                            800,000
               (KG '000)

                            600,000

                            400,000

                            200,000

                                  0
                                       2005 2006 2007 2008 2009 2010 2011 2012 2013 2014 2015 2016
      Sources:
      Badan Pusat Statistik (2018) Tabel Dinamis Subjek Hortikultura, Available at: https://www.bps.go.id/subject/55/hortikultura.html (Accessed: 2018).
      Wannarat Tantrakonnsab and Nattapon Tantrakoonsab (2018) Thai Export of Durian to China: BRC Research Report Bangkok Research Center, JETRO.
      Narong Chomchalow, Songpol Somsri and Prempree Na Songkhla (n.d.) Market Trends and Export of Thai Fruits: International Tropical Fruits Network (TFNet).
      Khoo Teng Kew (2012) High-value differentiation of durian: Are we missing an opportunity?, 5th International Symposium on Tropical and Subtropical Fruits
      (Guangzhou, China).
      Jabatan Pertanian (Department of Agriculture) (2016) Statistik Tanaman Buah-Buahan (Fruit Crops Statistics): Jabatan Pertanian (Department of Agriculture).
      Jabatan Pertanian (Department of Agriculture) (2015) Statistik Tanaman Buah-Buahan (Fruit Crops Statistics): Jabatan Pertanian (Department of Agriculture).

                                                                                                                                                                      21
Global Durian Supply
Figure 14 – Global Supply in 2016 (KG, millions) Production in Indonesia has been relatively
inconsistent ranging between 600-995 million
KG since 2005. This is likely due to erratic
yields owing to natural factors. Indonesian
agricultural production is known to be
quite variable due to forest fires that have
become a seasonal phenomenon. The fires
result from the practice of slash and burn
forest clearance where land is set on fire as
a cheaper way to clear it for new planning.
The fires typically spread out of control with
resulting haze impacting agricultural yields
and taking months to clear.
Unlike Indonesian production, production
levels in Thailand and Malaysia have been
relatively consistent since 2005. Thailand and
Malaysia have produced an average of 600
million KG and 330 million KG, respectively.
Sources: Refer to Figure 15
Although Durian production in total is believed to be 1.6 billion KG, not all Durian are made equal with many
different types of Durian available. Musang King Durian specifically is in high demand and expected to drive
growth in the industry, particularly in China. Musang King had a supply of only 500,000 mature trees in Malaysia
as of 2017. The total expected fruit production per year is forecast to be 50 million KG, assuming all 500,000
existing trees produce 50 fruit per year and weigh 2 KG. This is the equivalent of only 3% of total imports
globally and indicates a severe supply demand imbalance.
22Global Durian Supply
Durian Production Figures
Figure 15
1
I n do ne s i a
735.42 millions KG of durian produced (2016)
80% of Indonesia’s Durian production is based on the islands
of Java and Sumatra. In 2016, the province of East Java
accounted for 27% of total Durian production followed by
Central Java and North Sumatra with 10% each.
2
T h a i l an d
517.98 millions KG of durian produced (2016)
The majority of Thailand’s Durian production occurs in its South
& South Eastern Provinces. 38% of total Durian production
occurred in the province of Chanthaburi followed by
Chumphon and Rayong with 16% and 15% respectively in
2008.
3
Ma l ay s i a
302.65 millions KG of durian produced (2016)
82% of Malaysia’s Durian production is based on Peninsular
Malaysia also known as West Malaysia. The state of Pahang
accounted for 28% of total Durian production in the country
followed by Johor and Kelantan with 17% and 12% respectively
in 2016.
4
P h i l i pp i n es
71.45 millions KG of durian produced (2016)
Durian production in the Philippines is highly concentrated on
its southern island of Mindanao. The region of Davao is the
largest producer in the country followed by the Autonomous
Region in Muslim Mindanao (ARMM), both situated on
Mindanao. In 2016, Davao produced 75% of total Durian
production in the country followed by ARMM with 9%.
Sources:
Indonesia: Badan Pusat Statistik (2018) Tabel Dinamis Subjek Hortikultura, Available at: https://www.bps.go.id/ (Accessed: 2018).
Beritagar (2018) Berburu durian, nangka, dan rambutan di musim penghujan , Available at: https://beritagar.id/artikel/berita/berburu-durian-nangka-dan-rambutan-di-musim-pen-
ghujan (Accessed: 2018).
Thailand: Office of Agricultural Economics (2017) Agricultural Statistics of Thailand 2016: Office of Agricultural Economics.
Wannarat Tantrakonnsab and Nattapon Tantrakoonsab (2018) Thai Export of Durian to China: BRC Research Report Bangkok Research Center, JETRO.
Pokterng S. and Kengpol A. (2010) The Forecasting of Durian Production Quantity for Consumption in Domestic and International Markets: AIJSTPME.
Malaysia: Jabatan Pertanian (Department of Agriculture) (2016) Statistik Tanaman Buah-Buahan (Fruit Crops Statistics): Jabatan Pertanian (Department of Agriculture).
Philippines: Philippine Statistics Authority (2017) Crops Statistics of the Philippines (2011-2015): Philippine Statistics Authority.
Panay News (2018) Research initiative for the “king of fruits”, Available at: https://www.panaynews.net/research-initiative-for-the-king-of-fruits/ (Accessed: 2018).
23Total trade for Durian fruit
is expected to reach
4.5 Billion KG
by
2030.
24Expected Market Growth
Global Durian Trade
Total trade for Durian fruit is expected to grow from approximately 1.5 billion KG in 2016 to over 2.7 billion
KG by 2030 in our conservative scenario. Our growth scenario which is highly plausible as well, expects trade
to reach 4.5 billion by 2030. In terms of USD value, trade is expected to rise from 15 USD billion in 2016 to over
35 USD billion by 2030. Our growth scenario expects trade to reach 90 USD billion by 2030. Consumption per
capita in China under the conservative and growth scenario is expected to reach 0.78 KG and 1.46 KG,
respectively. Population growth was based on growth figures provided by the United Nations under their
medium growth variant scenario. Chinese consumption under both growth scenarios still lags other regional
countries. China is expected in the long term to reach a consumption level of 3 KG per capita to be in line
with Taiwan and Singapore.
Global trade has been identified as global imports plus the domestic consumption of the key markets of
Thailand, Malaysia and Indonesia. Total future trade was calculated based on three key subsectors of data
and markets– high growth, growth and mature growth markets. Figure 16 indicates the assumptions behinds
the growth projections.
Figure 16 – Expected Growth Assumptions
Source: Durian Harvests
Figure 17 – Global Trade (KG, millions) - Conservative Scenario
1,475,086,000
1,532,413,310
3,000 1,593,448,162
1,658,509,727
2,500
1,727,947,511
(KG, millions)
2,000 1,802,144,321
1,881,519,542
1,500
1,966,532,724
2,057,687,531
1,000
2,155,536,088
500 2,260,683,747
2,373,794,335
2,495,595,923
2016 2017 2018 2019 2020 2021 2022 2023 2024 2025 2026 2027 2028 2029 2030
2,626,887,163
China Thailand Malaysia Indonesia Others
2,768,544,264
Source: Durian Harvests
25Expected Market Growth
China was classified as a high growth market being the world’s largest importer of Durian and fastest
growing consumer market. China is the world’s largest importer of Durian with approximately 292 million KG
imported in 2016. China share of imports ranges between 60 - 80% of global imports depending on data
source. UN Comtrade data indicates the figure is 82% while Trade Map suggests it is 66%. This is due to Trade
Map including Vietnamese imports based on mirror data which raised total global imports and reduced
China’s share. Regardless, Vietnamese imports are believed to be destined towards China indicating China
is the key export market irrespective of data source.
Growth markets include all countries except for China with reported Trade Map imports. They include high
consumption countries such as Taiwan, Singapore, Brunei, Hong Kong and Macau. Mature markets include
Thailand, Malaysia and Indonesia all of which have been consuming domestically grown Durian for hundreds
of years. Although they are known to import Durian as well their demand is not expected to grow as fast as
other countries who are reliant on imports and do not have domestic production.
Figure 18 – Global Trade (KG, millions) - Growth Scenario
1,475,086,000
1,581,775,925
5,000
1,698,463,736
4,500
1,826,328,063
4,000
1,966,706,722
3,500
3,000 2,121,119,594
(KG, millions)
2,500 2,291,294,875
2,000 2,479,199,211
1,500 2,687,072,279
1,000 2,917,466,486
500 3,173,292,550
0 3,457,871,841
2016 2017 2018 2019 2020 2021 2022 2023 2024 2025 2026 2027 2028 2029 2030
3,774,996,484
China Thailand Malaysia Indonesia Others
4,128,998,394
4,524,828,568
Source: Durian Harvests
26Expected Market Growth
Durian Supply Requirements
Total Durian trade was approximately 1.5 billion KG in 2016. As noted earlier this figure is likely higher however
and closer to 2 billion KG due to unreported data which has not been captured in data sources. By 2030 total
trade is expected to reach between 2.8 and 4.5 billion KG which will require a substantial increase in supply
to be met. Demand is expected to be driven by two key growth factors - Musang King Durian fruit demand
and demand for Durian based end products of all Durian varieties. China in both instances will be the main
consumer market.
The total supply of Durian in terms of production was approximately 1.6 billion KG in 2016. As indicated earlier
in this report, production in Thailand and Malaysia has been relatively consistent since 2005 averaging 600
million KG and 330 million KG, respectively. Indonesian production has been more volatile ranging between
600-995 million KG due to inconsistent yields.
Figure 19 indicates the supply imbalance resulting from the projected conservative and growth scenarios.
As indicated earlier in this report, total supply is based on the total level of production in 2016 which was
estimated to be 1.6 billion KG. As can be seen in the figure by 2030 there will be a supply shortfall of 1.3 billion
KG and 3 billion KG depending on scenario. This is the equivalent of approximately 12.6 million Durian trees in
the conservative scenario and 30.3 million trees in the growth scenario. The tree figures presented are based
on a Durian tree yielding 50 fruit per tree with an average fruit weight of 2 KG. We would like to note that tree
yields increase as a tree ages with the 50 fruit per tree used as an approximation. For example, a tree at age
5 may yield 10 fruit and by age 20 yield up to 100 fruit.
Figure 19 – Projected Supply Imbalance (2017-2030)
Source: Durian Harvests
27Expected Market Growth Musang King Supply Requirements Although demand for all varieties of Durian will increase over the years Musang King Durian demand is expected to drive growth. This is particularly true for the export market which is driven primarily by China. The Chinese demand for Musang King has been so high that prices are up to 350% higher than found locally in Malaysia. Musang King is also highly in demand domestically in Malaysia but its consumption has been limited due to inadequate levels of supply. As a result, consumers are forced to purchase other varieties of Malaysian Durian which are readily available. According to Malaysia’s Agriculture Department, there are currently approximately 500,000 mature Musang King Durian trees in the country. This is the equivalent of 50 million KG worth of fruit and represents only 3% of total global durian trade comprised of Trade Map imports and domestic consumption in the key countries of Thailand, Malaysia and Indonesia. This figure is shockingly low and means that current Musang King supply can only meet 3% of annual global demand indicating a severe Musang King supply shortage. Thailand currently accounts for up to 95% of global exports with its Monthong variety taking in the bulk of this although the exact figure is unknown. Malaysia’s Musang King is in higher demand than all of Thailand’s exports thus it can be surmised that it can potentially account for up to 95% of global exports. Musang King can theoretically replace a large share of existing consumption domestically as well as its highly demanded in Malaysia too. The Malaysian government noticing the significant loss of potential earnings due to the rise in Musang King prices and high demand has been actively promoting it on the supply side by encouraging farmers to improve their existing operations and yields, and on the demand side by increasing awareness overseas. Malaysia has gone so far as to say that it can overtake palm oil as the preferred choice of new agricultural investment due to it being more profitable. To put things into perspective the palm oil industry in Malaysia accounts for up to 50% of agriculture’s contribution to Malaysian GDP or 22 USD billion. The obstacle facing Musang King will not be one of demand as its demand is evident. Instead it will be on finding the correct balance between supply and price in order to optimise the fruits profitability. 28
DISCLAIMER
MK Durian Harvests Sdn Bhd and its employees, authorized representatives, subsidiaries, introducer(s) and agents are
for the benefit of this entire document collectively referred to as (“Durian Harvests”). Durian Harvests makes every effort
to ensure that the information provided to you (“You”) in this document pertaining to its Musang King Durian Plantation
Ownership Opportunity (“Opportunity”) is accurate, timely and complete subject to the following:

Durian Harvests does not provide tax, legal, accounting, investment, financial planning, retirement or estate planning
advice or services nor are they licensed with any authority to do so. The content of this document is for information
dissemination purposes only and is intended to assist you in deciding whether you wish to proceed with further investigation
of the Opportunity and does not constitute an offer or solicitation or contract, or part of one, in relation to the Opportunity
and shall not be so construed.

The information contained in this document is based on certain assumptions, information and conditions applicable at a
certain time, some of which was derived from outside sources believed to be reliable, and may be subject to change at
any time without notice. Durian does not guarantee their accuracy, completeness, or fairness. Financial data including
returns, opinions, and projections set forth herein are presented for informational purposes only and involve a number of
assumptions that may not prove to be valid and may change without notice. Some important factors that could cause
actual results to differ materially from those in any forward looking statements include the following: changes in financial,
market, and economic or legal conditions, among others.

All brands, images and photos used in this document are for example and illustration purposes and remain the exclusive
copyright of their owners, manufactures and distributors, and no form of partnership, agency or collaboration is either
implied, intended or stated (unless otherwise specifically stated). Any information Durian Harvests provides in this document
may be subject to change from time to time. All information in this document may not be copied, modified, distributed
or reproduced in whole or in part without the prior written consent of Durian Harvests.

                                              MK Durian Harvests Sdn. Bhd.
                                                  Unit C-15-5 KL Trillion
                                                No 338 Jalan Tun Razak
                                                 50400 Kuala Lumpur
                                                        Malaysia

                                                  Tel: +60 3 2710 4723
                                            Email: info@durianharvests.com

                                              Growing Your Future
                                                 www.DurianHarvests.com
You can also read