Electronics Supply Networks and Water Pollution in China - Understanding and Mitigating Potential Impacts
←
→
Page content transcription
If your browser does not render page correctly, please read the page content below

Electronics Supply Networks and
Water Pollution in China
Understanding and Mitigating Potential Impacts

November 2010

www.bsr.org

About this Report
This report and related activities were developed in cooperation with the
Electronic Industry Citizenship Coalition (EICC) and generously funded by the
Rockefeller Brothers Fund. We wish to thank the leads of the Environmental
Sustainability Working Group for their support in project design and
implementation, consultation and facilitation with the EICC, and review of this
report. Please direct comments or questions to Laura Ediger at lediger@bsr.org
or Jesse Nishinaga at jnishinaga@bsr.org.

DISCLAIMER
BSR publishes occasional papers as a contribution to the understanding of the
role of business in society and the trends related to corporate social responsibility
and responsible business practices. BSR maintains a policy of not acting as a
representative of its membership, nor does it endorse specific policies or
standards. The views expressed in this publication are those of its authors and
do not reflect those of BSR members or the Electronic Industry Citizenship
Coalition.

ABOUT BSR
A leader in corporate responsibility since 1992, BSR works with its global
network of more than 250 member companies to develop sustainable business
strategies and solutions through consulting, research, and cross-sector
collaboration. With offices in Asia, Europe, and North America, BSR uses its
expertise in the environment, human rights, economic development, and
governance and accountability to guide global companies toward creating a just
and sustainable world. Visit www.bsr.org for more information.

BSR | Electronics Supply Networks and Water Pollution in China                      1
Contents
3     Executive Summary

4     Introduction
      China’s Water Crisis
      Regulatory and Civil Society Context

8     Risk Assessment
      Environmental Database
      Methodology
      Results

12    Supply Chain Recommendations
      Know Your Suppliers
      Establish Performance Expectations for Suppliers
      Consider Alternative Suppliers
      Work with Peers to Boost Industry-wide Practice

15    Conclusion

16    Appendix: Helpful Reports, Guides, and Technical Resources

17    References

BSR | Electronics Supply Networks and Water Pollution in China     2
Executive Summary
Electronics manufacturing has become an important economic contributor to
China’s success, but its rapid growth has come with environmental costs as well,
including negative impacts on water quality. As governmental enforcement of
wastewater standards improves, along with public awareness and civil society
engagement on environmental issues, global companies have a growing need to
effectively understand and mitigate potential risks.
For this study, BSR worked with the Electronic Industry Citizenship Coalition
(EICC) to better understand the environmental performance of a sample of
China-based suppliers to EICC members in relation to wastewater management.
With the support of ten EICC members who submitted lists of their suppliers in
China, BSR searched an online public database of water pollution information
compiled by the Institute of Public and Environmental Affairs to identify violations
linked to suppliers to the EICC members who participated in the study.
The findings of the database search included these results:
Environmental violations were found in the database for 33 (of 640)
suppliers, representing approximately five percent of the sample. The
majority of these matches were located in the provinces of Jiangsu (39
percent), Guangdong (30 percent), and Shanghai (15 percent), where
electronics manufacturers are concentrated.
Approximately 30 percent of the 33 supplier matches were for supplier
names submitted by more than one EICC member company, showing
the interconnected nature of the electronics supply chain and the widely
shared risk of poor supplier environmental performance.
More than 20 percent of the suppliers with recorded violations had
multiple matches in the database, demonstrating that these companies
may have long-term systemic challenges with effective wastewater
management.
The assessment findings provide helpful information for EICC members, and also
demonstrate the usefulness of the IPE database as one tool in a comprehensive
supplier evaluation and development program. Companies can work to improve
supply chain performance by fully understanding where relatively higher risks
exist in their supply networks, communicating effectively with suppliers regarding
expectations for water use and wastewater treatment, and integrating supplier
performance into initial and ongoing supplier selection and assessment.
BSR | Electronics Supply Networks and Water Pollution in China 3Introduction With nearly 20 percent annual growth in recent years, electronics manufacturing has become a core export industry for China, helping to fuel the country’s rapid economic development.1 Providing everything from discrete components to final product assembly, China is not only a major electronics producer – the country’s burgeoning middle-class has also turned China into an important market for products that were once sold primarily to Western consumers. Global electronics companies have played a central role in building the electronics industry into a crucial sector for China. However, the dramatic expansion of electronics manufacturing, along with other sectors that rely on intensive use of water and chemicals, has contributed to some of the challenging water issues that China faces today. Recent media reports and campaigns by nongovernmental organizations (NGOs) have highlighted the contribution of electronics manufacturing to China’s water pollution issues, sparking interest from consumers and government regulators. Corporate response has been varied, in part because many companies do not have a clear understanding of the extent to which their own supply chains are contributing to these water pollution impacts. Some electronics companies have already established stringent programs to address supplier wastewater management issues. For those that haven’t, combining a clear understanding of their supply chains and a process to evaluate potential environmental impacts will make it easier to determine how to effectively address water pollution concerns. BSR | Electronics Supply Networks and Water Pollution in China 4
The goal of this report is threefold: (1) provide global electronics companies with
the context needed to understand China’s water challenges, (2) present the
results of a supplier assessment that was conducted on behalf of Electronic
Industry Citizenship Coalition (EICC) member companies, and (3) document
recommendations and resources for identifying and mitigating water pollution
risks in electronics supply chains.
CHINA’S WATER CRISIS
China has experienced unprecedented economic growth in the last few decades,
which has improved the lives of millions of Chinese citizens. Unfortunately, this
Of the 745 river growth has also come at the expense of environmental losses that threaten
China’s public health and long-term prosperity.
sections being
monitored in China, China’s water resources are scarce, unevenly distributed, extensively polluted,
only 40 percent met and often poorly managed. According to the UN Food and Agriculture
the Grades I-III Organization (FAO), China’s per capita availability of water resources is only
surface quality one-fourth the global average and among the lowest for a major country. This
scarcity is further aggravated by extensive water pollution. A 2009 World Bank
standards (safe for report noted that of the 745 monitored river sections in China, only 40 percent
human met the Grades I-III surface quality standards (i.e. safe for human consumption
consumption after after treatment). Additionally, only 56 percent of the total annual discharge of
2
treatment). municipal and industrial wastewater was treated.
With China’s population expected to peak at 1.5 billion around 2033, under a
―business as usual‖ scenario, total water demand will increase by an estimated
3
16 percent to 653.5 km in 2030, largely driven by industrial and municipal
Source: Xie 2009 3
demands. The economic cost of China’s water crisis will also rise under this
scenario, putting additional strain on the country’s public and environmental
health. World Bank research estimated that the direct costs of water scarcity and
pollution are equivalent to
approximately 2.3 percent of Projected Water Demand
China’s GDP, with 1.3 percent Shares by Sectors (%)
attributable to scarcity and 1 80%
percent to the direct impacts of 70%
4
pollution. Other studies have
60%
found significant correlation
between water pollution and 50%
health impacts such as typhoid, 40%
diarrhea, anemia, birth defects, 30%
and mortality due to 20%
esophageal, stomach, bladder, 10%
5
lung, and liver cancer.
0%
Different regions of China Municipal Industry Agriculture
experience varying challenges 2000 2030
related to water resources.
Water-scarce regions are Source: Data from Xie 2009
largely concentrated in the
northern and western areas of the country. For example, the Huang-Huai-Hai
(3H) area, named after the region’s three major rivers, is home to 34.7 percent of
China’s population but only 7.6 percent of naturally available water resources.
The annual level of water access in the 3H area is far below the international
6
scarcity level of 1,000 cubic meters per capita.
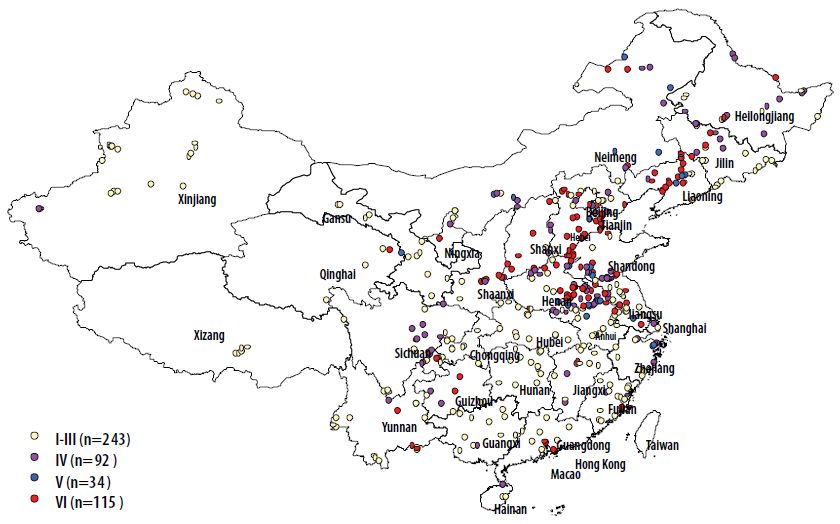
BSR | Electronics Supply Networks and Water Pollution in China 5Parts of central China and the eastern seaboard experience the most
concentrated pollution. In the Shanghai area, only one percent of surface water
meets drinking water standards, and Zhejiang and Guangdong Provinces also
have challenges with water quality. Figure 1 illustrates the surface water quality
levels in China, with the greatest concentrations of polluted water unsafe for
human consumption (i.e. Grades IV and above) in the central and eastern parts
of China as well as some key areas in the south.
Figure 1: Surface Water Quality Levels (2004)
Water Quality
Grade Level
Source: Nygard 2006
Note: Grades I–III refer to water that is safe for human consumption after treatment, Grades IV–V refer to water that is safe
only for industrial and irrigation use, and higher than Grade V refers to water that is unsafe for any use.
REGULATORY AND CIVIL SOCIETY CONTEXT
Over the last decade, China’s leaders have increasingly recognized the severe
challenges of environmental pollution and the need to address them with better
laws and effective enforcement. China’s State Environmental Protection Agency
was elevated to the Ministry of Environmental Protection (MEP) in early 2008,
signaling the central government’s intention to strengthen the regulatory power of
government agencies in regard to natural resource management.
In contrast to many developing countries, the legal aspects of environmental
protection in China are relatively strict. For example, detailed guidelines have
BSR | Electronics Supply Networks and Water Pollution in China 6been published for acceptable standards of industrial air and water emissions
discharge. In order to operate, manufacturers must go through a complicated
process of obtaining permits and approvals.
The main weakness of the regulatory system exists at the level of local
implementation. Municipal branches of the MEP are effectively dependent on
From April to August local government for their financial survival, so often they do not have the
2010, a coalition of independence to penalize companies if that is contrary to the wishes of local
officials. Close relationships between business owners and government officials,
Chinese NGOs, led by along with the importance of steady tax revenues, mean that local government
Friends of Nature, the often has little incentive to cite or shut down polluting businesses.
Institute of Public and
Environmental Affairs Meanwhile, the role of civil society organizations and activists in raising public
awareness and drawing attention to violations of the law is increasingly
(IPE), and Green Beagle
important. Although NGOs in China often have limited scope regarding their
produced a public report activities, organizations focused on environmental issues have had an increasing
alleging that 29 amount of freedom in recent years. There is growing acceptance of the positive
electronics brands used role that NGOs can play in educating the public about environmental issues and
suppliers in China with even aiding enforcement efforts by identifying offenders, especially if NGO
activities are not directed toward criticism of government initiatives.
poor environmental
practices, such as For global electronics companies, the implications of an improved climate for civil
dumping heavy metals society activity are twofold. First, there is a higher reputational risk of having a
into China’s water facility in their supply chain publicly identified as a polluter or targeted in a
campaign. The second and more positive perspective is that increased public
bodies.
awareness of corporate environmental performance can also help to support
global electronics companies in their sustainability work by improving
See www.ipe.org.cn for a series
accountability of supplier environmental performance at the local level.
of reports on this campaign.
BSR | Electronics Supply Networks and Water Pollution in China 7Risk Assessment
A typical electronics product is a complex construction of a wide range of diverse
components. Some of these components, which may number in the thousands,
are manufactured at facilities with highly intensive processes that use significant
amounts of water and chemicals. The waste byproducts of these processes must
be treated appropriately before discharge to limit impacts on human and
7
environmental health.
Because of the complexity and sheer size of electronics supply networks, a
consumer brand or OEM’s knowledge of supplier activities and identities is often
limited. This challenge is amplified by the fact that many components used to
build a typical electronics product are provided by suppliers with varying degrees
of vertical integration. As suppliers and their associated manufacturing processes
are identified, companies can assess specific supplier facilities to determine the
locations of the most water-intensive and potentially polluting facilities.
The following assessment identifies potential supply chain risks based on
evaluation of publicly available information on previous violations. BSR used a
list of suppliers collected from EICC members and checked the suppliers’ names
against a database created by a Chinese NGO that includes official violations
published by local media and government agencies.
ENVIRONMENTAL DATABASE
The Institute of Public and Environmental Affairs (IPE) is a Chinese NGO that
works to increase public awareness and disclosure of environmental information,
in part by publishing information about water and air pollution in China. One of
IPE’s project activities is maintaining an online database that contains published
information related to industrial air and water emissions. As of October 2010,
there were more than 50,000 individual entries in the database, which is
available to the public at www.ipe.org.cn (in Chinese) and is searchable by
company name, year, industry type, province, and city.
Information captured in the database includes environmental violations such as
negative evaluations received during an official environmental review, violations
for illegal or improper discharge, cases in which wastewater discharge did not
meet water quality standards, and community complaints that led to
investigations regarding pollution. There is also neutral information in the
database that is not linked to any violation, such as data from environmental
impact assessments or public mention of company participation in water quality
improvement projects.
The database is frequently updated by IPE staff based on information published
in the media and on official government websites. There are certain limitations in
relying on such sources, such as the preference of some government agencies
not to publish lists of offenders despite legal requirements. This means that the
database cannot be considered a comprehensive measure of environmental
performance. However, this information channel serves as a useful tool for
companies to identify known pollution risks in their supply networks.
METHODOLOGY
Ten EICC members submitted supplier lists to be included in the database-
matching assessment. From these lists, in combination with supplier names
provided for the EICC’s Carbon Reporting System initiative and suppliers that
have participated in the EICC audit process, we were able to check 640 suppliers
BSR | Electronics Supply Networks and Water Pollution in China 8in the IPE database using the supplier’s Chinese name. Additional supplier
names (in English) were provided by EICC member companies, but we were not
always able to identify the likely Chinese name, and thus were limited to
checking the 640 suppliers with identifiable Chinese names.
Where EICC members also provided details of supplier location, we checked any
database matches against that location. The results presented below distinguish
―primary location,‖ where the location matched, from ―secondary location,‖ where
the company name matched but the location did not. Suppliers at secondary
locations may or may not be linked to the supply chains of EICC members, but
these findings were included because in some cases, the matching facility may
be a close affiliate of the actual EICC supplier. In all instances, further
investigation is required to confirm whether the facility identified in the database
is in fact the supplier of an EICC member. Correct identification of suppliers can
be complicated by slight variations in company or facility name and address, so
while this exercise was conducted with the best information available to us at the
time, there may be additional suppliers in the database that we were not able to
identify.
Matches indicated below are only those related to negative information or explicit
violations, and do not include database matches linked to neutral or positive
information about a facility. Violations from previous years are not necessarily
indicative of current performance, as corrective actions may have been taken.
RESULTS
Of the 640 suppliers checked against the IPE database, we found 33 matches
(over 5 percent of the total) that indicated negative information about a supplier’s
performance on wastewater.
Table 1: Suppliers and Secondary Locations with Violations
% of Secondary
Suppliers w/ Total % of Total
Province Suppliers Total Locations
Violations Violations Violations
Suppliers w/ Violations
Anhui 1 0% 0 2 2 6%
Beijing 2 0% 0 0 0 0%
Fujian 5 1% 0 0 0 0%
Guangdong 163 25% 4 6 10 30%
Guangxi 2 0% 0 0 0 0%
Hainan 2 0% 0 0 0 0%
Hebei 0 0% 0 1 1 3%
Henan 1 0% 0 0 0 0%
Hunan 2 0% 0 0 0 0%
Jiangsu 295 46% 10 3 13 39%
Jiangxi 1 0% 0 0 0 0%
Liaoning 3 0% 0 0 0 0%
Shaanxi 3 0% 0 0 0 0%
Shandong 4 1% 0 0 0 0%
Shanghai 75 12% 3 2 5 15%
Shanxi 1 0% 0 0 0 0%
Sichuan 2 0% 0 0 0 0%
Tianjin 15 2% 0 0 0 0%
Zhejiang 6 1% 1 1 2 6%
Unidentified 57 9% 0 0 0 0%
Total 640 18 15 33
BSR | Electronics Supply Networks and Water Pollution in China 9Results by location
The majority of these matches were located in the provinces of Jiangsu (39
percent) and Guangdong (30 percent) in southeastern China, which reflects the
concentration of suppliers in those areas (68 percent total in the two provinces).
Shanghai, also a significant electronics manufacturing hub, represents 11
percent of all suppliers and 15 percent of all matches.
The fact that most matches were found in these areas may also reflect that
government agencies in these locations are more effective at monitoring and
evaluating companies within their jurisdiction, and may be relatively more open
and transparent regarding the publication of environmental information.
Results by product type
EICC members were also asked to include information about suppliers’ primary
products. The most common components produced by facilities that were found
to have negative information in the IPE database were printed circuit boards
(PCBs) (see Table 2). However, it is important to note that for more than half of
the matches identified, the key product is unknown. Regardless, the high number
of matches for PCB facilities supports common perceptions and expert opinion
about the relative water pollution risk of PCB manufacturing.
Table 2: Number of Violations by Component
Component Number of Violations
PCB 5
Hard drive 2
ANT receiver plate & PG9 1
BP, CG, Midplate 1
Electrical 1
Encoders 1
IO, NBK keyboard 1
Nut 1
Passives 1
Rubber 1
Systems/Thermals 1
Unidentified 17
Suppliers are linked to multiple companies
Approximately 30 percent of the 33 supplier matches were for supplier names
submitted by more than one EICC member company (see Table 3),
demonstrating that the risk of supplier pollution impacts is broadly shared. Since
only 10 companies submitted supplier lists, it is possible that other EICC
members also have business relationships with some of the suppliers identified
in this assessment.
Many suppliers had multiple violations
More than 20 percent of the suppliers with violations in the IPE database had
multiple matches (see Table 3). One facility even had four separate violations
BSR | Electronics Supply Networks and Water Pollution in China 10captured in the database, all related to wastewater discharge. The presence of
multiple violations indicates systemic problems with suppliers that are not just
related to a one-time accidental discharge or temporary equipment failure.
Table 3: Violation Location, Year(s), and Number of Buyers
Year of Number of
Location Match City Province
Violation(s) Buyers*
Primary Dongguan Guangdong 2007 1
Primary Guangzhou Guangdong 2009 1
Primary Guangzhou Guangdong 2006 2 + AP
Primary Zhongshan Guangdong 2006 1
Primary Kunshan Jiangsu 2007, 2008 1
Primary Kunshan Jiangsu 2008 1
Primary Kunshan Jiangsu 2006, 2007 1 + AP
Primary Suzhou Jiangsu 2008, 2009 1
Primary Suzhou Jiangsu 2007 2
Primary Suzhou Jiangsu 2007 1
Primary Suzhou Jiangsu 2008 1
Primary Suzhou Jiangsu 2008 1
Primary Wuxi Jiangsu 2008 1
Primary Wuxi Jiangsu 2007 1
Primary Shanghai Shanghai 2009 1
Primary Shanghai Shanghai 2008, 2009 1
Primary Shanghai Shanghai 2008 1
Primary Ningbo Zhejiang 2006 1
Secondary Hefei Anhui 2007 1
Secondary Hefei Anhui 2005 2
Secondary Dongguan Guangdong 2008 AP
Secondary Shenzhen Guangdong 2008 1
Secondary Shenzhen Guangdong 2006, 2008 1
Secondary Shenzhen Guangdong 2008 1
Secondary Shenzhen Guangdong 2006, 2007, 2008, 2008 1
Secondary Zhongshan Guangdong 2006, 2008 1
Secondary Langfang Hebei 2010 3
Secondary Nanjing Jiangsu 2006 3 + AP
Secondary Nanjing Jiangsu 2009 3 + AP
Secondary Wuxi Jiangsu 2006 2
Secondary Shanghai Shanghai 2009 3 + AP
Secondary Shanghai Shanghai 2005 1
Secondary Jiaxing Zhejiang 2008 2 + AP
*AP indicates that supplier names were included in lists from EICC’s audit process.
BSR | Electronics Supply Networks and Water Pollution in China 11Supply Chain Recommendations
Understanding risks to water resources at a local level for the electronics industry
is challenging. However, companies can take action with their suppliers to
mitigate risk by improving wastewater treatment processes, based on experience
from best practices in supply chain management.
The following are practical steps that global electronics companies can take to
understand and address key challenges in the supply chain related to water
resource risks in China. These recommendations provide guidance for how
companies can better invest their time and resources in improving supply chain
performance.
KNOW YOUR SUPPLIERS
One important aspect of working with suppliers is to fully understand complex
supply chain relationships, and to prioritize suppliers with higher potential for
water risk, whether due to their processes, management, or location. Information
collected should include details about which processes suppliers are using and
how wastewater is being treated at the first-tier supplier level and beyond based
on prioritized supplier types and characteristics. A full assessment of supply
chain impacts on water quality would also trace the supply chain to early phases
of the product life cycle such as mining and metallurgy, which also have the
potential for negative environmental impacts.
Focus Your Efforts
A typical supply network may be too large and complex to effectively evaluate in
its entirety. The scope can be narrowed by applying certain basic criteria for risk
characterization, such as:
1. Suppliers that are the most ―strategic‖ in terms of spending and
importance to business. Importance to business may be higher for
suppliers that produce components or products that generate the
greatest revenues or profits for the company, and/or are used
extensively for less tangible but equally important purposes, such as
for branding;
2. Suppliers that have already been identified by the public, media, or
NGO community as responsible for previous environmental offenses;
3. Suppliers known to have poor quality management or reporting
systems; or
4. Suppliers that are financially unstable, maintain poor external
relationships, or have a history of labor or environmental issues,
ownership changes, and workforce disruptions.
Look at Process, not Product
As part of supplier prioritization, companies should work to identify which
suppliers are using the most water-intensive and potentially polluting
manufacturing processes in a product’s life cycle. Rather than identifying each
supplier primarily based on the product it manufactures, electronics companies
should understand their supply chains in terms of where specific manufacturing
processes are located.
Electronics companies will ultimately have to work with technical experts on
chemical and industrial processes to understand the relative risk of different
BSR | Electronics Supply Networks and Water Pollution in China 12operations. Across the industry, however, some components are highlighted
more often than others as relatively intensive in terms of water, energy, and
chemical usage during production. These include printed circuit boards (PCBs),
semiconductors, LCD screens, and batteries and power supply units.
Particular manufacturing processes may present pollution risks due to large
volumes of water required, specific chemicals and treatment methods, and the
need for multiple repetitions of phases such as etching and cleaning. For
example, PCB manufacturing involves a number of complicated and intensive
processes, including cleaning and surface preparation of the base, electroless
8
copper plating, pattern printing and masking, electroplating, and etching.
Similarly, manufacturing of semiconductors typically requires 200 to 300 steps
with three basic elements: layering, doping, and patterning. Large amounts of
water are needed, primarily for rinsing after the etching and cleaning stages. The
rinsing process results in large volumes of wastewater, which may contain a wide
9
range of chemicals.
Consider the Geographic Context
An additional consideration is whether any suppliers are located in a particularly
sensitive environmental context. Key factors related to water impacts include
local water scarcity and infrastructure and enforcement limitations.
As detailed above, some regions of China experience chronic water shortages,
with decreasing availability of both surface and groundwater. Not only does this
mean that suppliers may experience more regulatory pressure in terms of water
use and efficiency, but wastewater discharge quality is also of greater concern
because lower water volumes mean that pollutants are more concentrated.
Another type of sensitive geographic context can be found in China’s interior
provinces or smaller cities, where local capacity to enforce wastewater standards
is not as developed. With rising labor costs in the traditional manufacturing hubs
in China’s southern and eastern regions, many manufacturers are moving to
smaller cities or townships, or to inland provinces with lower operating expenses.
Water demand is expanding rapidly in such locations, which are often
10
experiencing expansion of both industrial and residential water needs.
However, investment in appropriate wastewater treatment infrastructure is still
relatively limited in these areas compared to larger cities and coastal provinces,
along with the level of local enforcement and government transparency.
ESTABLISH PERFORMANCE EXPECTATIONS FOR SUPPLIERS
Direct engagement with suppliers to communicate expectations is a critical piece
of risk mitigation. Once a company has identified its high-risk suppliers, the
company should work with its suppliers to identify specific challenges, develop
customized approaches to improve water efficiency and wastewater treatment
methodologies, set expectations for disclosure and reporting, and provide
incentives for implementing best practices. Regular engagement and evaluation
will help a company and its supplier to set appropriate expectations, track
progress, and adjust activities when necessary.
Tangible results of supplier engagement may include recommendations or joint
exploration of technical improvements, such as using the best available
technologies and state-of-the-art treatment systems to reduce pollution and
contaminant levels in effluent streams.
BSR | Electronics Supply Networks and Water Pollution in China 13CONSIDER ALTERNATIVE SUPPLIERS Integrating evaluation of supplier performance on water use and wastewater treatment into the overall supplier assessment process would enable companies to incorporate water-related risks into business decisions. Electronics companies may need to consider alternative suppliers and supply chain partners who will support a company’s sustainability goals. This approach obviously does not eliminate the root problem of wastewater mistreatment, but can signal to new and existing suppliers that continued mismanagement of wastewater will result in loss of business opportunities. WORK WITH PEERS TO BOOST INDUSTRY-WIDE PRACTICE Industry-wide collaboration can be an effective means of combining company resources to maximize societal impact. One example of a collaborative approach to environmental challenges is the EICC’s Carbon Reporting System initiative. Since early 2008, the EICC has used the Carbon Reporting System to standardize reporting of organizational greenhouse gas (GHG) emissions between suppliers and enterprise customers. Water assessment can work in similar ways as GHG emissions assessment, and in fact, the Carbon Reporting System already asks a few basic water-use questions in the current version of its supplier questionnaire. Leading electronics companies can work through the EICC framework to gather basic information from suppliers and communicate the importance of water resource protection. Another example of a joint initiative is the Global Social Compliance Program (GSCP). The GSCP provides a framework of environmental reference requirements that can be used by global electronics companies as a model for continuous improvement in environmental performance of suppliers, moving suppliers from basic compliance (Level 1) to proactive management (Level 2) to leading-edge performance (Level 3). The GSCP also provides an implementation guide to help companies meet these requirements step-by-step and gradually move from Level 1 to Level 3. Companies may be able to work within existing initiatives like the ones offered by the EICC and GSCP to address water pollution issues in China, or adapt other tools for this purpose. The investment that companies have already made in EICC participation demonstrates a commitment to collaborative supply chain engagement. Using this type of framework to address water pollution in China and other manufacturing hubs would be a straightforward and valuable expansion of current efforts. BSR | Electronics Supply Networks and Water Pollution in China 14
Conclusion
China’s water challenges are long-term and complex, and the electronics
industry is just one small piece of the country’s overall water management.
However, the global visibility of the industry, and of EICC members, provides an
opportunity for addressing water-related business risks in a way that can provide
broader environmental benefits.

BSR’s supply chain assessment of EICC member supplier lists found that over 5
percent of suppliers were linked to negative environmental performance citations
in the IPE database. More than 20 percent of these suppliers had not just one but
multiple negative matches in the database, indicating that wastewater
mismanagement is a systemic problem rather than just a one-time incident.

The finding that 30 percent of negative matches were suppliers that have
relationships with multiple EICC members demonstrates the widely shared risk
that is created by overlapping supply networks, as well as the shared benefits
that can be generated by improved supplier performance.

Companies with more extensive understanding of their supply chains, including
prioritization of high-risk suppliers, that communicate performance expectations
clearly to their supply chains and integrate assessment of water management
into business decisions, can make significant progress towards mitigating water
pollution risks, both for their own business and for the local environment.

BSR | Electronics Supply Networks and Water Pollution in China                     15
Appendix

HELPFUL REPORTS, GUIDES, AND TECHNICAL RESOURCES:

General Information on China and Water:

1) Aquastat, Food and Agricultural Organization of the United Nations,
   http://www.fao.org/nr/water/aquastat/countries/china/index.stm

2) The Asia Water Project, http://www.asiawaterproject.org/

3) Institute of Environmental and Public Affairs, http://www.ipe.org.cn/

4) World Bank 2009 Report, ―Addressing China’s Water Scarcity,‖ http://www-
   wds.worldbank.org/external/default/WDSContentServer/WDSP/IB/2009/01/1
   4/000333037_20090114011126/Rendered/PDF/471110PUB0CHA0101OFFI
   CIAL0USE0ONLY1.pdf

Guides for Electronics Manufacturing:

5) Environmental Guidelines for Electronics Manufacturing, Multilateral
   Investment Guarantees Agency,
   http://www.miga.org/documents/ElectronicsManufacturing.pdf

6) Environmental, Health, and Safety Guidelines for Semiconductors & Other
   Electronics Manufacturing,
   http://www.ifc.org/ifcext/enviro.nsf/AttachmentsByTitle/gui_EHSGuidelines20
   07_Semiconductors/$FILE/Final+-
   +Semiconductors+and+Other+Electronic+Mnfg.pdf

7) U.S. Environmental Protection Agency, Design for Environment,
   http://www.epa.gov/dfe/

Technical Reports:

8) Alternative Technologies for Surface Finishing: Cleaner Technologies for
   Printed Wiring Board Manufacturers,
   http://www.epa.gov/opptintr/dfe/pubs/pwb/tech_rep/Surface_Finishing.pdf

9) Desktop Computer Displays: A Life Cycle Assessment,
   http://www.epa.gov/dfe/pubs/comp-dic/lca/index.htm

10) Implementing Cleaner Printed Wiring Board Technologies: Surface Finishes,
    http://www.epa.gov/dfe/pubs/pwb/pdf/sf_guide.pdf

11) Printed Wiring Board Pollution Prevention and Control Technology: Analysis
    of Updated Survey Results, http://www.epa.gov/dfe/pubs/pwb/pdf/p2tech.pdf

12) Solders in Electronics: A Life-Cycle Assessment,
    http://www.epa.gov/dfe/pubs/solder/lca/lca-summ2.pdf

BSR | Electronics Supply Networks and Water Pollution in China                16
References
1
Pecht, Michael, 2006. China’s Electronics Industry, William Andrew Publishing,
Norwich, NY.
2
Xie Jian, 2009. ―Addressing China’s Water Scarcity,‖ The World Bank.
3
Xie Jian, 2009.
4
Xie Jian, 2009.
5
Xie Jian, 2009.
6
Xie Jian, 2009.
7
Brigden, Kevin et al., 2007. ―Cutting Edge Contamination: A Study of
Environmental Pollution During the Manufacture of Electronic Products,‖
Greenpeace Research Laboratories Technical Note 01/2007, Greenpeace
International.
8
Multilateral Investment Guarantees Agency, ―Environmental Guidelines for
Electronics Manufacturing,‖ The World Bank Group.
9
Walters, Adam et al., 2006. ―Background Documents on Three Key Elements
of the Electronics Manufacturing Sector: Semiconductors, Printed Wiring
Boards, and TFT-LCD Screens,‖ Greenpeace Research Laboratories
Technical Notes.
10
Nygard, Jostein, 2006. ―China: Water Quality Management—Policy and
Institutional Considerations,‖ The World Bank.
BSR | Electronics Supply Networks and Water Pollution in China 17You can also read