Dynamic tensile properties, deformation, and failure testing of impact loaded coal samples with various water content
←
→
Page content transcription
If your browser does not render page correctly, please read the page content below
www.nature.com/scientificreports
OPEN Dynamic tensile properties,
deformation, and failure testing
of impact‑loaded coal samples
with various water content
Zhen Wei1,3, Ke Yang1,2,3*, Xiao‑Lou Chi1,3, Xiang He4, Xin‑Yuan Zhao1,3 & Ji‑qiang Zhang1,3
Disc coal samples with different water content were tested using the split Hopkinson press bar
test system. Their dynamic tensile failure process was monitored via an ultra-high-speed digital
image correlation system. The deformation trend and failure characteristics as a function of the
water content were analyzed, and the water content effect on dynamic mechanical properties was
investigated. The results demonstrated that the dynamic stress–strain curve of the coal samples
consisted of four stages. As the water content increased, the coal sample brittleness degraded, while
its ductility was enhanced. Quadratic polynomial functions can describe dynamic peak stress, peak
strain, and loading pressure. Under different loading pressures, the dynamic peak stress exhibited a
concave bending trend as the water content increased. The coal sample’s dynamic tensile strength had
a strong rate correlation, and the saturated coal sample exhibited the highest rate correlation. Under
high-rate loading, the inertia effect and the Stefan effect of water in coal samples hinder the initiation
and propagation of coal sample cracks, improving the coal sample’s strength. The research results
provide a basic theoretical basis for the prevention and control of rock burst in coal mines.
Water is one of the main factors affecting the mechanical properties of materials. In coal mining engineering,
high ground pressure disturbances are prone to inducing secondary engineering disasters, producing water-
conducting cracks, thus forming a large amount of mine water1,2. The construction of pumped storage power
generation projects in underground reservoirs can effectively reduce the water loss caused by mine water dis-
charge, improving the power system’s feasibility and s afety3–5. The preset coal pillars and artificial coal mining
walls constitute the underground reservoir and soaked by groundwater for a long t ime6. Therefore, it is necessary
to consider the interaction between water and coal during coal mining, the design of water-proof pillars in aqui-
fers, and the excavation and support of water-rich roadways. The coal rock structure is complex and changeable;
thus, the mechanical performances under impact loads are quite different from those under static o nes7,8. As the
underground coal pillar wall of the pumped storage power generation project is subjected to long-term dynamic
load, to prevent coal rock damage caused by dynamic load impact from causing catastrophic accidents, it is nec-
essary to understand the impact failure characteristics of coal samples with different water c ontent9. Hence, in
designing underground reservoir coal pillars and roadway safety support, it is crucial to reveal the impact failure
mechanism of coal rock via the dynamic tensile test of coal samples with different water content.
Many studies on the mechanical performance of water-soaked coal have been carried out in recent years. Still,
most of them were focused on the impact of water on coal sample mechanical performance under static load,
which revealed the static tensile performances of saturated coal samples. The results show that static loads have a
weakening effect on coal samples’ mechanical p erformances10,11. Various field engineering cases have shown that
dynamic instability and failure often occurs in coal rock12, while the dynamic tensile performance of coal rock has
important mechanical features, which is of great significance for the control of coal rock stability under impact
load and the study of disaster mechanism caused by rockburst. At present, scholars have carried out extensive
research on the mechanical performances of coal rock under dynamic load with the separated Hopkinson bar
(SHPB) test device, and some significant research results have been achieved. Li et al.13 performed the granite
1
State Key Laboratory of Mining Response and Disaster Prevention and Control in Deep Coal Mines, Anhui
University of Science and Technology, Huainan 232001, China. 2Institute of Energy, Hefei Comprehensive National
Science Center, Hefei 230031, China. 3Key Laboratory of Mining Coal Safety and Construction Efficiency of Anhui
Province and Ministry of Education, Anhui University of Science and Technology, Huainan 232001, China. 4China
University of Mining & Technology (Beijing), Beijing 100083, China. *email: keyang2003@163.com
Scientific Reports | (2021) 11:7096 | https://doi.org/10.1038/s41598-021-86610-7 1
Vol.:(0123456789)
www.nature.com/scientificreports/
Figure 1. Typical coal sample.
layer fracture test using the improved Hopkinson bar device and analyzed the failure characteristics of hard rock
fracture under impact loads. Yuan et al.14 carried out impact compression tests on sandstones with different
water content using an SHPB device. The variation trend of sandstone dynamic uniaxial compressive strength
with water content was obtained. Kim et al.15 studied the effect of water content and loading rate on sandstone’s
physical performances. Zhao et al.16 investigated the effects of bedding angle and loading rate on the initiation
and propagation of cracks in coal samples. Exploring the dynamic deformation and failure characteristics of
layered sandstone, Yang et al.17 carried out the dynamic Brazilian disk test of sandstone at different bedding angles
combined with the digital image correlation (DIC) method. Ai et al.18 carried out a dynamic sandstone bar test
using a separated SHPB. They analyzed the relationship between crack propagation and dynamic mechanical
performance under impact load combined with DIC technology. Insofar as energy is the inherent factor during
the material failure process, which changes throughout the entire process of material deformation and fracture,
it is the main way to study the failure mechanism of coal rock by analyzing energy dissipation19–21. Based on the
principle of energy dissipation, scholars have also carried out a series of experimental studies on the dynamic
deformation and failure of different coal rock and analyzed the energy d issipation22, fractal c haracteristics23, and
energy storage c haracteristics24 of coal rock, thus improving comprehension of energy dissipation in the process
of coal rock fracture. However, the dynamic tensile test results on coal samples are different, as the strata coal
samples contain a certain amount of moisture. Therefore, it is necessary to study the dynamic tensile character-
istics and evolution of coal samples with different water contents.
The Brazilian disc indirect tensile test is the simplest and most effective method to test the tensile perfor-
mances of coal rock. Based on the static tensile test principle and after long-term theoretical substantiation and
device innovation efforts, an SHPB test device was developed to realize the dynamic tensile performance test of
materials25. To further study the deformation and failure features of coal samples with different water contents
under impact load, the hard coal from the Hujiahe coal mine in the Binchang mining area, Shaanxi was selected.
The SHPB test system of the Anhui University of Science and Technology with the pressure rod diameter of
50 mm was used to deeply analyze the deformation and failure features of coal samples with different water
contents under various loading pressures. During the test, a high-speed digital camera was used to capture and
record the crack propagation process of coal samples. Thus, the strain field of coal samples under different loading
pressures, the dynamic evolution process of the displacement field, crack propagation behavior, and mechanical
performance trends were analyzed, revealing the deformation and failure mechanism of coal samples with dif-
ferent water contents under high loading rates.
Experimental
Sample preparation. Coal samples applied in the test were taken from the 401,103 workface of the Hujiahe
coal mine in the Binchang mining area. According to the international recommendations for the Brazilian split
test of rocks to determine the dynamic tensile strength of materials26, the coal block with good integrity and
homogeneity was cored and cut into Φ50 mm × 25 mm disc samples. To meet the SHPB test requirements and
reduce the effect of end-face friction, the SHM-200 double-end face grinder was used to grind and polish the
disc samples. The non-parallelism of the end face in the coal sample should be less than 0.05 mm, while its diam-
eter’s deviation should be less than 0.02 mm, the processed sample ensures that there is no obvious crack on the
surface. To ensure the correlation of the samples’ physical and mechanical performance and avoid differences in
the samples’ structure and composition, all samples were taken from the same coal block.
Typical coal samples are shown in Fig. 1.
The experimental objects were subdivided into three groups, 15 samples in each group, and the experimental
coal samples were prepared. The specific steps were as follows:
1. All coal samples were placed in a constant temperature drying oven to obtain dry coal samples (w = 0), the
temperature was 20℃, the drying time was 48 h, and their weight was mdry.
2. According to GB/T23561.5–2009, saturated coal samples were prepared using a vacuum suction device,
which weight was recorded as msat . The saturated water content of the coal sample can be calculated as in27:
msat − mdry
wsat = × 100 (1)
mdry
Scientific Reports | (2021) 11:7096 | https://doi.org/10.1038/s41598-021-86610-7 2
Vol:.(1234567890)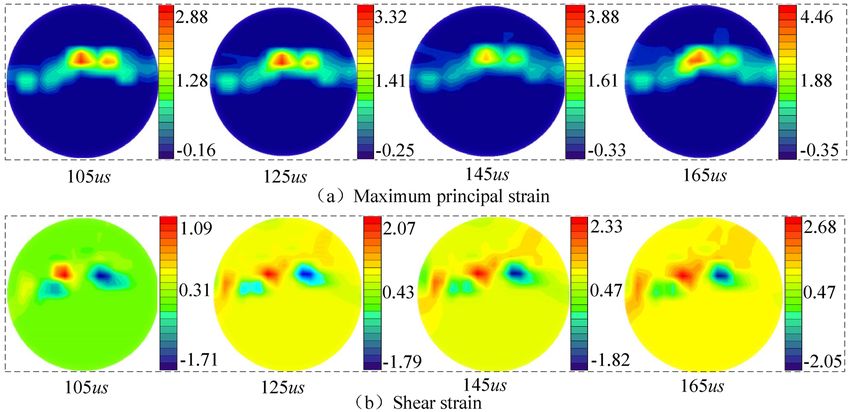
www.nature.com/scientificreports/
Sample Water content w/% Average water content/%
BD-1-0.30 0 0 0
BD-1-0.35 0 0 0
BD-1-0.40 0 0 0 0 (Dry samples)
BD-1-0.45 0 0 0
BD-1-0.50 0 0 0
BD-2-0.30 2.137 2.130 2.166
BD-2-0.35 2.128 2.140 2.173
BD-2-0.40 2.108 2.119 2.156 2.136 (Natural samples)
BD-2-0.45 2.148 2.103 2.113
BD-2-0.50 2.157 2.152 2.143
BD-3-0.30 3.140 3.158 3.165
BD-3-0.35 3.192 3.154 3.132
BD-3-0.40 3.134 3.157 3.128 3.174 (Saturated samples)
BD-3-0.45 3.159 3.143 3.183
BD-3-0.50 3.170 3.177 3.196
Table 1. The water content in coal samples.
High-pressure Infrared velocity BD coal
air chamber measurement Absorbing device
Bullet Incident bar samples Transmitted bar Absorbing bar
Laser speed detector Ultra-high-speed camera and flashlight Strain gauge bridge box
·
Ultrahigh dynamic strainometer Oscilloscope PC computer
Figure 2. SHPB and high-speed DIC test system.
This test involved dry, natural, and saturated coal samples, each group consisting of 15 replicates. Table 1
shows the prepared coal samples’ properties, with the average water content of saturated coal samples of 3.174%.
Before the test, spots with size, density, and irregularity characteristics, which met the DIC method’s calcula-
tion requirements, were painted on the surface of coal samples by spray p ainting28. During the test, the spots of
digital images on the surface of coal samples were tracked to obtain the surface strain information in the dynamic
tensile process of coal s amples29.
Test system and scheme. The SHPB test system with an opposite-type punch developed by the Central
South University, China, was applied in this experiment, as shown in Fig. 2. The test device’s pressure rod (of
50 mm in diameter) and punch were made of high-strength alloy steel with a density of 7800 kg/m3 and an elastic
modulus of 210 GPa. The impact waveform was a sine wave with a longitudinal wave velocity of 5190 m/s30. Dur-
ing the test, the opposite punch hit the input rod at a certain speed in the axial direction, generating a stress wave
in the input rod. When the stress wave was transmitted to the coal sample, a reflected stress wave was transmitted
to the input rod. Meantime, the coal sample transmitted a stress wave to the output rod. Then, the strain gauge
pasted on the pressure rod received the corresponding stress wave signal31.
Scientific Reports | (2021) 11:7096 | https://doi.org/10.1038/s41598-021-86610-7 3
Vol.:(0123456789)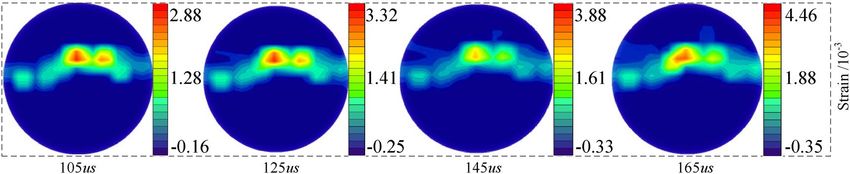
www.nature.com/scientificreports/

                                                        25                                      Incident stress
                                                                                                Reflected stress
                                                        20
                                                                                                Transmitted stress
                                                        15                                      Incident+reflected stress

                                                        10

                                                         5

                                           Force / KN
                                                         0

                                                         -5

                                                        -10

                                                        -15

                                                        -20

                                                        -25
                                                              0   50      100             150           200               250
                                                                                Time/us

                                            Figure 3.  Dynamic stress equilibrium of typical samples.

                                               The test data acquisition equipment included an SDY2107A super dynamic strain gauge, Yokowaga-DL850E
                                            oscilloscope, and ultra-high-speed DIC test system. The above system comprised a FASTCAM SA-Z high-speed
                                            camera, lighting flash, trigger, and synchronous control system. Before the test, the high-speed camera’s shoot-
                                            ing speed was set at 120,000 fps, and the image resolution was 256 pixels × 408 pixels, which could capture the
                                            deformation and failure features of the coal samples and meet the test requirements. The velocity and incident
                                            amplitude of opposite-type punch were controlled by adjusting nitrogen pressure.
                                               A spare coal sample was tested before the experiment to determine a suitable loading air pressure.
                                               The results obtained show that the tensile strength of the coal samples was relatively small. Hence, the loading
                                            pressures of 0.30, 0.35, 0.40, 0.45, and 0.50 MPa were applied in the test. Three specimens were tested at each of
                                            the above loading pressures, and a total of 45 dynamic tensile tests were carried out. After the test, the effective
                                            results that met the standard requirements were selected for comparative analysis.
                                               During the test, to improve the test results’ accuracy, the vaseline was applied to the contact zone between
                                            the pressure rod and the coal sample, thus reducing the friction coefficient and friction effect.

                                            Results and analysis
                                            Verification of the dynamic stress equilibrium. In the abbreviations of samples listed in Table 1, “BD”
                                            in BD-1-0.30 means the Brazilian splitting test, while “1” represents the first group of tests, and “0.30” stands for
                                            the loading pressure value. For the SHPB test, the stress equilibrium before samples’ failure is the prerequisite for
                                            the effective dynamic test results. During impact loading, the strain gauge on the incident rod and transmission
                                            rod measured electrical signals. Through signal transformation, the change of strain (stress) in the elastic rod at
                                            both ends of the sample with time can be obtained. As shown in Fig. 3, the typical sample’s stress equilibrium
                                            curves in a dynamic tensile test were drawn according to the test results. As observed, the transmitted wave
                                            curve, the incident and reflected waves’ superimposition curve overlap during the impact loading process, indi-
                                            cating that the stress at both ends of the sample is balanced before the sample’s failure, and the test results are
                                            valid. During the data processing, all test results were strictly verified by stress equilibrium, and the test results
                                            that did not meet the standards were eliminated.

                                            Dynamic stress–strain curves. Under impact loading, the voltage signals on the incident rod and the
                                            transmission rod were collected by ultra-dynamic strain gauge and converted into strains based on the· 1D stress
                                            wave theory. Then, combining Eqs. (2)–(4), the coal sample’s stress σ (t), strain ε(t), and strain rate ε(t) under
                                            impact load were calculated with a three-wave method to obtain the dynamic tensile stress–strain curve of the
                                            coal sample.
                                                                                                             EA
                                                                                                σ (t) =          [εI (t) + εR (t) + εT (t)]                    (2)
                                                                                                             2As
                                                                                                                 t
                                                                                                        c
                                                                                            ε(t) =                    [εI (t) − εR (t) − εT (t)]dt             (3)
                                                                                                        ls    0

                                                                                                  ·           c
                                                                                                  ε(t) =
                                                                                                              ls
                                                                                                                 [εI (t) − εR (t) − εT (t)]                    (4)

                                            where c, E, and A are the elastic wave velocity, elastic modulus, and cross-sectional area of the compression rod,
                                            respectively; As and ls are the cross-sectional area and length of the coal sample, while εI (t), εR (t) and εT (t) are
                                            the incident strain, reflected strain, and transmitted strain, respectively.

          Scientific Reports |   (2021) 11:7096 |                      https://doi.org/10.1038/s41598-021-86610-7                                                4

Vol:.(1234567890)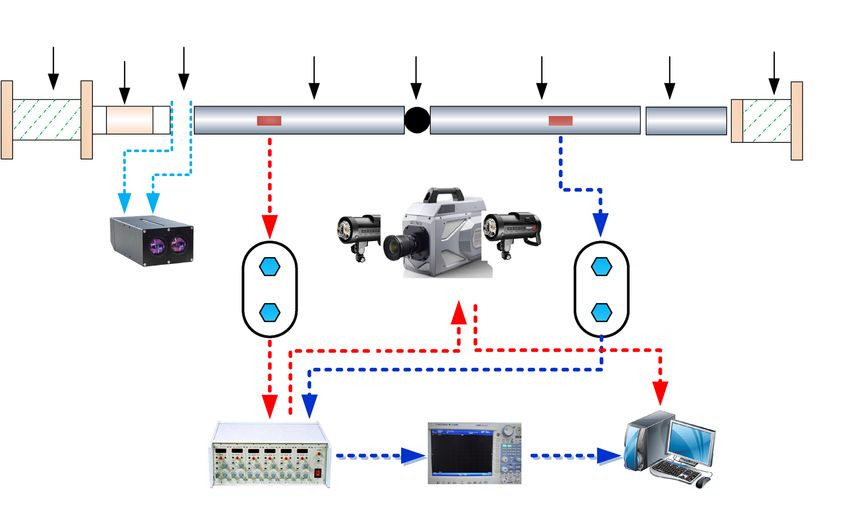
www.nature.com/scientificreports/
6
7 0.30MPa
0.30MPa
0.35MPa
0.35MPa
6 5 0.40MPa
0.40MPa
0.45MPa
0.45MPa
0.50MPa
5 0.50MPa
4
Stress/MPa
Stress/MPa
4
3
3
2
2
1
1
0 0
0 500 1000 1500 2000 2500 3000 0 500 1000 1500 2000 2500 3000
Strain/10-6 Strain/10-6
(a) Dry coal sample (b) Natural coal sample
6
0.30MPa
0.35MPa
5 0.40MPa
0.45MPa
0.50MPa
4
Stress/MPa
3
2
1
0
0 500 1000 1500 2000 2500 3000 3500 4000
Strain/10-6
(c) Saturated coal sample
Figure 4. Dynamic stress–strain curves of coal samples under different loading pressures.
Figure 4 shows the dynamic tensile stress–strain curve of typical coal samples under impact load. As observed,
a coal sample’s stress–strain curve under dynamic load can be roughly subdivided into four s tages31,32. Stage I
is the compaction stage. The coal sample’s internal microcracks are closed under the action of external force,
showing the trend of rapid first and then gradual slowing down, and the σ − ε curve shows a concave bending
trend. However, the loading rate of impact load is much higher than that of static or quasi-static load, resulting
in the closure of internal microcracks; thus, the curves’ feature is not obvious. The second stage is the elastic
(linear) deformation part, which is mainly due to the enormous elastic energy stored inside the coal sample
under external load. The curve approaches a straight line, which slope is equal to the coal sample dynamic elas-
tic modulus. The third stage is the plastic deformation stage, which is mainly due to the plastic deformation of
the coal sample under external force. The σ − ε curve is concave, and its slope is gradually reduced. The latter
value varies with water content and reaches zero in the peak stress position. The fourth stage is the failure stage,
where the coal sample undergoes brittle (ductile) failure under external load. Thus, the curve reflects different
states with a negative slope.
The results demonstrated that dynamic tensile performances of coal samples with various water contents are
significantly different. Specifically, the greater the water content of the coal sample, the greater the peak strain.
Besides, the elastic stage of the stress–strain curve is longer than the plastic stage. The overall tendency is the
right shift, indicating reduced brittleness, enhanced ductility, and exacerbated coal samples’ d amage33.
Trend of the dynamic peak stress. Figure 5 illustrates the trends of dynamic tensile peak stress and
coal samples’ loading pressure with different water contents. As observed, the coal sample’s dynamic peak stress
increased with the loading pressure, indicating an obvious rate effect. The dynamic peak stress (σd) and loading
pressure (p) can be described by:
σd = ap2 + bp + c (5)
where a, b, and c are coefficients of the quadratic function.
The dynamic peak stress function coefficients of the coal sample are listed in Table 2.
Scientific Reports | (2021) 11:7096 | https://doi.org/10.1038/s41598-021-86610-7 5
Vol.:(0123456789)
www.nature.com/scientificreports/

                                                              7
                                                                          Dry coal sanple
                                                                          Natural coal sample
                                                              6           Saturated coal sample

                                           Peak stress /MPa
                                                              5

                                                              4

                                                              3

                                                              2
                                                                   0.30         0.35          0.40          0.45         0.50
                                                                                   Impact air pressure /MPa

                                             Figure 5.  The trend of coal sample peak stress with loading pressure.

                                                  Water content                a          b             c          Correlation coefficient R2
                                                  Dry                          0.4857     − 2.3457      5.84       0.9915
                                                  Natural                      0.4685     − 2.3725      5.66       0.9816
                                                  Saturated                    0.5685     − 3.0145      6.53       0.9576

                                             Table 2.  Peak stress and loading pressure fitting coefficient of different samples.

                                                              7
                                                                                              0.30MPa              0.35MPa
                                                                                              0.40MPa              0.45MPa
                                                                                              0.50MPa
                                                              6
                                           Peak stress /MPa

                                                              5

                                                              4

                                                              3

                                                              2
                                                                  Dry coal               Natural coal                Saturated coal
                                                                                        Water content

                                             Figure 6.  The trend of coal sample peak stress with water content.

                                                 As observed, the correlation coefficient (R2) of σd and p was reduced to 0.9576, indicating a good correla-
                                             tion between them, and the fitting coefficient a was greater than 0. Thus, the curve shape is concave, as shown
                                             in Fig. 5. As observed, the loading pressure and dynamic peak stress of dry samples (w = 0%) increased from
                                             0.3 to 0.5 MPa and from 3.22 to 6.16 MPa, demonstrating a significant positive effect of the loading rate on the
                                             dynamic peak stress of dry coal sample. The results show that with the increase of loading rate, water has resist-
                                             ance to crack propagation and hinders its initiation and propagation, that is, water content has strengthening
                                             effect on dynamic tensile strength of coal samples, but the strengthening effect is less. At p = 0.4–0.5 MPa, the
                                             saturated coal sample’s dynamic peak stress increased faster, indicating that under high loading pressure, the
                                             water content has a strengthening effect on dynamic tensile strength. If p = 0.3–0.5 MPa, peak stresses are 2.63,
                                             2.78, 3.11, 4.48, and 5.36 MPa, respectively. Compared with the dry coal samples with the same loading pressure,
                                             the peak stresses were reduced by 32.7, 22.7, 24.1, 16.0, and 12.9%, indicating that the greater the water content
                                             under the same loading pressure, the lower the dynamic tensile strength of the coal sample.
                                                 Figure 6 shows the trend of dynamic tensile peak stress of coal samples as a function of water content at
                                             different loading pressures. As observed, the curve of dynamic peak stress of coal samples with water content
                                             shows a trend of asymmetric concave bending trend, and the peak stress curve shows an overall upward trend
                                             as the loading pressure increases. If p = 0.3–0.4 MPa, as the water content increased, the coal sample peak stress
                                             gradually decreased. If p = 0.4–0.5 MPa, the coal sample’s peak stress decreased first and then increased with the
                                             water content, while the peak stress of natural samples always exceeded that of saturated ones. At the loading

          Scientific Reports |   (2021) 11:7096 |                                      https://doi.org/10.1038/s41598-021-86610-7                            6

Vol:.(1234567890)
www.nature.com/scientificreports/
3500
Dry coal sample
3000 Natural coal sample
Saturated coal sample
2500
Peak strain/10-6
2000
1500
1000
500
0.30 0.35 0.40 0.45 0.50
Impact air pressure /MPa
Figure 7. Peak strain versus loading pressure.
Water-content type d e f Correlation coefficient R2
Dry 24.714 − 12.637 2.144 0.9871
Natural 15.914 − 8.429 2.400 0.9358
Saturated 6.085 3.737 − 0.475 0.9674
Table 3. Fitting coefficients of peak strain versus loading pressure curves.
pressure of 0.50 MPa, the dynamic peak stresses of dry, natural, and saturated coal samples were 6.21, 5.42, and
5.51 MPa, respectively, indicating that the coal sample water content had a strong effect on its peak stress.
Trend of dynamic peak strain. Figure 7 shows trends of dynamic peak strains of coal samples with differ-
ent water contents as a loading pressure function. As observed, peak strains of coal samples with different water
contents increased with loading pressure. The correlation of dynamic peak strain εd and p can be described as
follows:
εd = dp2 + ep + f (6)
where d, e, f are coefficients of the quadratic function.
Values of coefficients d, e, and f are listed in Table 3. As observed, the minimum correlation coefficient R2
between the dynamic peak strain of coal samples at different rates and the loading pressure was equal to 0.9358,
indicating a good correlation. Moreover, the quadratic function coefficient d was higher than zero, and the curve
shape was concave, as shown in Fig. 7. As observed, dry samples’ loading pressure and dynamic peak strain
increased from 0.30 to 0.50 MPa and by 279.06%, respectively, showing a strong loading rate effect. The peak
strain curves of natural and saturated coal samples were located above that of dry coal samples. The peak strain
curves of saturated coal samples were the highest. Thus, the peak strain of coal samples increased with water
content. The loading pressure had a positive effect on the dynamic peak strain of coal samples.
Figure 8 shows trends of peak dynamic tensile strain of coal sample as a function of water content at differ-
ent loading pressures. At loading pressure of 0.3 MPa, the peak strain first increased and then decreased as the
water content increased; at loading pressure of 0.35 and 0.4 MPa, peak strain exhibited a concave growth as the
water content increased; at loading pressure of 0.45 and 0.5 MPa, peak strain had a convex growth as the water
content increased. With an increase in the loading pressure, peak strains of coal samples with different water
contents shifted upwards at different rates.
With the increase of loading pressure, the dynamic tensile strength of coal samples increases gradually and
has a good rate correlation. Water content will affect the post-peak deformation behavior of coal samples. After
the dry samples reach the peak load, there will be obvious stress drop phenomenon, while after the water-
containing samples reach the peak load, the stress does not fall immediately, but slowly decreases, showing the
characteristics of plastic deformation.
The mechanical properties of water bearing coal samples are the result of the interaction between softening
and strengthening of water. When the loading rate is low, water makes clay mineral particles expand, which leads
to the disintegration of two adjacent particles and the increase of particle spacing, resulting in the decrease of
liquid bridge force, the decrease of interfacial cohesion and the dominant role of water softening. When the load-
ing rate is high, the inertial action and viscous stress are enhanced, and the enhancement of water is dominant.
The strength of saturated coal sample may be greater than that of dry sample.
Scientific Reports | (2021) 11:7096 | https://doi.org/10.1038/s41598-021-86610-7 7
Vol.:(0123456789)www.nature.com/scientificreports/
3000
0.30MPa 0.35MPa
0.40MPa 0.45MPa
2500 0.50MPa
2000
Peak strain /10-6
1500
1000
500
Dry coal Natural coal Saturated coal
Water content
Figure 8. Peak strain versus water content.
Figure 9. Dry coal sample maximum principal strain cloud diagram.
Dynamic failure of coal samples
Spatiotemporal evolution characteristics of the strain field. The coal sample’s initial spot pattern
under impact load was regarded as a reference. The spot pattern at typical moments in the loading process was
selected as the deformation image and then analyzed with the PhotoInfor and PostViewer digital image process-
ing software34. Figure 9 shows the maximum principal strain cloud diagram of the dry coal sample at the loading
pressure of 0.30 MPa (tensile strain is positive and compressive strain is negative). As observed, the maximum
principal strain concentration area is first formed in the middle of the sample under impact load and propagated
rapidly, indicating that the disk sample at the center reaches the critical failure value at first, and then breaks and
rapidly propagates to form macroscopic cracks parallel to the loading direction.
During the dynamic tensile test of the coal sample, the maximum principal strain field exhibited a good
symmetry, that is, the sample was in the dynamic equilibrium state under impact loading. Under the radial
symmetric impact load, the tensile strain at the coal sample center was always the maximum. The microcrack
was generated at the sample center and split along the radial direction. This was consistent with the static-load
Brazilian disk test results. At the same time, the tensile stress in the vertical loading direction was the main factor
for the initiation and propagation of cracks.
Figure 10 shows the cloud diagram of the natural disk coal sample’s strain field cloud map at an impact load
of 0.30 MPa. As observed, a significant strain concentration occurs in the coal sample’s central position under
a natural state. The crack first initiates and propagates in the central area under the combined action of tensile
and shear stresses. In contrast to dry coal samples, a wide-range strain concentration zone existed in the natural
coal sample due to the water content effect. Combined with the shear strain cloud diagram, the shear strain
value under impact loading is smaller, indicating that the coal sample’s failure mode is an open fracture type.
Under the action of dynamic impact load, multiple principal strain concentration zones appear in the sam-
ple’s center, as shown in Fig. 11. The number of principal strain concentration zones is not related to the impact
load magnitude. With the impact loading, the principal strain concentration zone’s share increased, eventually
forming a radially penetrating strain concentration area. As observed in the cloud diagram of the saturated coal
sample’s maximum principal strain, the strain concentration zone dimensions were different. Still, the maximum
value was always located in the strain concentration zone. Several shear strain concentration zones appear in the
center of the sample under the shear strain cloud diagram’s impact load. However, the shear strain concentra-
tion domain has not penetrated to form an obvious strain concentration area, indicating that the samples’ crack
propagation had mainly a tensile form.
The crack propagation of saturated coal samples was relatively complex. Multiple principal strain concentra-
tion zones were initially formed at the central part of the coal sample. Then, under the external dynamic load,
they gradually propagated and penetrated along the impact loading direction. Comparing the shear strain cloud
diagram of the natural state and the saturated coal sample under the same loading air pressure, there was no
particular rule in the shear strain cloud image of saturated coal samples, and the strain value is small, the shear
Scientific Reports | (2021) 11:7096 | https://doi.org/10.1038/s41598-021-86610-7 8
Vol:.(1234567890)www.nature.com/scientificreports/
Figure 10. Strain field distribution in natural coal sample at loading pressure of 0.30 MPa.
Figure 11. Strain field distribution in saturated coal samples at a loading pressure of 0.30 MPa.
strain value of saturated coal sample is about twice that of natural coal sample. Because the coal sample’s inter-
nal water could not be rapidly eliminated due to external load and water content. Thus, high pore pressure was
generated and superimposed with the impact force.
Dynamic crack evolution. The evolution features of coal sample cracks under impact load are the main
research content of coal rock dynamic mechanical features35. The coal sample’s crack propagation and failure
morphology during the dynamic tensile process changes with the water content. During the SHPB test, the
failure process of coal samples with different water contents is recorded by high-speed video. The surface crack
evolution features were analyzed. Herein, Fig. 12 is a sketch of typical coal sample failure under impact load-
ing. The upper right corner is a high-speed camera image of the coal sample’s dynamic failure process, and the
right side is the corresponding coal sample failure pattern. As observed, the degree of failure of coal samples in
natural and saturated samples was higher than that of dry samples under the same loading pressure. The macro-
scopic crack propagation path on the surface was not smooth. Coal samples gradually decomposed and peeled
under dynamic load. As shown in Fig. 12a, the number of cracks in the dry coal sample was small when it was
fractured. The middle tensile crack (red line) is the main one. The failure of saturated coal samples resulted in
tensile cracks along the loading direction accompanied by numerous bifurcated secondary cracks (blue line).
Under external loading, secondary cracks gradually propagated to the sample edge, as shown in Fig. 12c. The
coal sample was affected by the internal primary crack and water content, etc. The surface crack propagation and
failure morphology exhibited different features. With an increase in water content, the number of cracks after
the coal sample failure increased, and their morphology was complex. In summary, the coal sample surface crack
propagation features on the coal sample surface were under dynamic impact load, and tensile cracks appeared in
Scientific Reports | (2021) 11:7096 | https://doi.org/10.1038/s41598-021-86610-7 9
Vol.:(0123456789)www.nature.com/scientificreports/
Figure 12. Sketching diagram of impact splitting failure process of coal samples with different water content.
the center of the coal sample first. Then new cracks were generated, which propagated and finally decomposed
and peeled-off in coal samples.
Discussion
Results show that under high loading rate, water has a certain positive effect on the mechanical performances of
coal samples, and its influence on the dynamic mechanical performances was mainly reflected in three aspects:
1. There are differences between mineral particles in coal samples, and clay minerals bond other mineral
particles to each other, There are a large number of natural joints and fissures in the mineral itself. A series
of physical and chemical reactions occur between water and minerals. Water migrates between internal
micropores and fissures, which reducing the connection force between mineral particles. With the increase
of water content, the internal cracks of coal samples increase, the overall integrity becomes worse, and the
needle-like and sheet-like structures appear locally after saturation.
2. Generally, since the loading rate of static test is low, the inertia of coal sample can be ignored. However, in the
dynamic test, the deformation and failure of coal samples occur instantaneously, and the inertia effect will
prevent the generation and propagation of cracks, increase the strength of coal samples. With the increase
of water content, the weight of coal samples increases, and the inertia effect of dynamic test increases.
3. The mechanical properties of water-bearing coal samples are affected by the interaction of water softening
and strengthening. Under the effect of external load, the internal water of coal samples cannot be excluded,
resulting in high pore pressure in the pores and fissures, which induced the expansion of stress concentration
at the crack tip. When the loading rate is low, water would induced the swelling of clay mineral particles and
cause the disintegration of two adjacent particles, increase the particle spacing, and then reduce the liquid
bridge force. The free water at the crack tip will also promote the crack initiation and the softening effect of
water is dominant when the cohesive force of the interface is small. Under higher loading rate, the inertial
effect and viscous stress are enhanced, and the enhancement of water is dominant.
Scientific Reports | (2021) 11:7096 | https://doi.org/10.1038/s41598-021-86610-7 10
Vol:.(1234567890)www.nature.com/scientificreports/
Conclusions
1. The dynamic stress–strain curves of coal samples with different water content at various loading pressures
contain the compaction stage, elastic (linear) deformation stage, plastic deformation stage, and failure stage.
As the water content increases, the curves show a rightward shifting trend, indicating reduced brittleness,
enhanced ductility, and exacerbated coal samples’ damage.
2. As the loading pressure increases, the coal sample’s dynamic tensile strength is gradually improved, which
has a good rate correlation. Under the same loading pressure, the coal sample’s dynamic peak stress shows an
asymmetric concave bending trend with increased water content. The dynamic peak stress and peak strain
of coal samples with different water content versus loading pressure have a quadratic polynomial function
relationship and a strong correlation.
3. The disc coal sample shows tensile splitting failure features, with the main crack propagating along the
loading direction. Under the impact load, the coal sample first cracks in its center, followed by initiation,
propagation, and penetration of multiple secondary microcracks, resulting in surface cracks.
4. Under dynamic loads, multiple principal strain concentration zones appear at the center of the saturated
coal sample. Then, the principal strain concentration zone propagates gradually and eventually exhibits
radial direction development. This phenomenon mainly occurs because it is too late to eliminate the coal
sample’s internal water under the external impact load, which generates high pressure in pores and fissures
that becomes superimposed with the impact force.
Received: 11 November 2020; Accepted: 2 March 2021
References
1. Xie, H. P. et al. New concept of coal revolution and coal technology development conception. J. China Coal Soc. 43(5), 1187–1197
(2018).
2. Gu, D. Z. et al. Theoretical framework and technical system of underground reservoir in coal mines. J. China Coal Soc. 40(2),
239–246 (2015).
3. Wang, Y. B. et al. Dynamic mechanical properties of coals subject to the low temperature-impact load coupling effect. Sci. Rep. 9,
1–13 (2019).
4. Zhao, Z. H., Sun, W., Chen, S. J., Wang, W. M. & Wang, Q. B. Coupling model of jointed rock mass and rock bolt in offshore LPG
underground storage. Energy Sci. Eng. 8(5), 1468–1483 (2020).
5. Chang, S. et al. Static and dynamic mechanical properties and deterioration of bedding sandstone subjected to freeze–thaw cycles:
considering bedding structure effect. Sci. Rep. 10, 1–14 (2020).
6. Gu, D. Z., Yan, Y. G., Zhang, Y., Wang, E. Z. & Cao, Z. G. Dynamic response and stability analysis of coal pillar in coal mine
underground reservoir. J. China Coal Soc. 41(7), 1589–1597 (2016).
7. Si, X. F., Gong, F. Q., Li, X. B., Wang, S. Y. & Luo, S. Dynamic Mohr-Coulomb and Hoek-Brown strength criteria of sandstone at
high strain rates. Int. J. Rock Mech. Min. Sci. 115, 48–59 (2019).
8. Xing, H. Z. et al. Full-field measurement and fracture characterisations of rocks under dynamic loads using high-speed three-
dimensional digital image correlation. Int. J. Impact Eng. 113, 61–72 (2018).
9. Gong, F. Q., Ye, H. & Luo, Y. The effect of high loading rate on the behaviour and mechanical properties of coal-rock combined
body. Shock. Vib. 2018, 1–9 (2018).
10. Li, J. C., Zhao, X. B., Li, H. B., Chai, S. B. & Zhao, Q. H. Analytical study for stress wave interaction with rock joints having unequally
close–open behavior. Rock Mech. Rock Eng. 49(8), 3155–3164 (2016).
11. Lu, A. H. et al. Impact of moisture content on the dynamic failure energy dissipation characteristics of sandstone. Shock Vib. 2019.
(2019).
12. Xie, H. P. et al. Conception and research progress of in-situ “Five Guarantees” coring in deep rock. J. Rock Mech. Eng. 39(5), 865–876
(2020).
13. Li, X. B. et al. Mechanical characteristics of rock under static and dynamic loading. J. Rock Mech. Eng. 07, 1387–1395 (2008).
14. Yuan, P. & Ma, Q. Y. Experimental study on split Hopkinson pressure bar of coal mine sandstone under dry wet cycle. Geotech.
Mech. 34(9), 2557–2562 (2013).
15. Kim, E., Stine, M. A., de Oliveira, D. B. M. & Changani, H. Correlations between the physical and mechanical properties of sand-
stones with changes of water content and loading rates. Int. J. Rock Mech. Min. Sci. 100, 255–262 (2017).
16. Zhao, Y. X., Gong, S., Hao, X. J., Peng, Y. & Jiang, Y. D. Effects of loading rate and bedding on the dynamic fracture toughness of
coal: laboratory experiments. Eng. Fract. Mech. 178, 375–391 (2017).
17. Yang, R. S., Li, W. Y., Fang, S. Z., Zhu, Y. & Li, Y. L. Experimental study on impact dynamic characteristics of layered composite
rock mass. J. Rock Mech. Eng. 38(9), 1747–1757 (2019).
18. Ai, D. H., Zhao, Y. C., Wang, Q. F. & Li, C. W. Crack propagation and dynamic properties of coal under SHPB impact loading:
experimental investigation and numerical simulation. Theor. Appl. Fract. Mech. 105, 102393 (2020).
19. Gong, F. Q., Si, X. F., Li, X. B. & Wang, S. Y. Dynamic triaxial compression tests on sandstone at high strain rates and low confining
pressures with split Hopkinson pressure bar. Int. J. Rock Mech. Min. Sci. 113, 211–219 (2019).
20. Ping, Q., Luo, X., Ma, Q. Y. & Yuan, P. Energy consumption characteristics of sandstone specimen under impact load. J. Rock Mech.
Eng. 34(S2), 4197–4203 (2015).
21. Zhou, Q. et al. The effect of a pre-existing crack on a running crack in brittle material under dynamic loads. Fatigue Fract. Eng.
Mater. Struct. 42(11), 2544–2557 (2019).
22. Ma, Q. Y. & Cao, Z. M. Experimental study on fractal characteristics and energy dissipation of stabilized soil based on SHPB test.
J. Mater. Civil Eng. 31(11), 04019264 (2019).
23. Li, X. F., Li, H. B., Zhang, Q. B., Jiang, J. L. & Zhao, J. Dynamic fragmentation of rock material: characteristic size, fragment dis-
tribution and pulverization law. Eng. Fract. Mech. 199, 739–759 (2018).
24. Gong, F. Q., Yan, J. Y., Li, X. B. & Luo, S. A peak-strength strain energy storage index for bursting proneness of rock materials. Int.
J. Rock Mech. Min. Sci. 117, 76–89 (2019).
25. Wu, B. B., Chen, R. & Xia, K. W. Dynamic tensile failure of rocks under static pre-tension. Int. J. Rock Mech. Min. Sci. 80, 12–18
(2015).
26. The ISRM Suggested Methods for Rock Characterization. Testing and Monitoring: 2007–2014 (2015).
Scientific Reports | (2021) 11:7096 | https://doi.org/10.1038/s41598-021-86610-7 11
Vol.:(0123456789)www.nature.com/scientificreports/
27. Mao, X. B., Chen, Z. Q., Xu, S. P. & Li, T. Z. Experimental study on the relationship between coal seam impact tendency and water
content. J. Rock Mech. Eng. 1, 49–52 (2001).
28. Pan, B., Wu, D. F. & Xia, Y. Quality evaluation of speckle pattern in digital image correlation method. Exp. Mech. 25(2), 120–129
(2010).
29. Li, D. Y., Li, B., Han, Z. Y. & Zhu, Q. Q. Evaluation on rock tensile failure of the Brazilian discs under different loading configura-
tions by digital image correlation. Appl. Sci. 10(16), 5513 (2020).
30. Li, X. B., Tao, M., Gong, F. Q., Yin, Z. Q. & Du, K. Theoretical and experimental study on fracture failure of hard rock under impact
load. J. Rock Mech. Eng. 30(6), 1081–1088 (2011).
31. Zhang, R. R. Experiment and analysis on dynamic mechanical and damage characteristics of deep sandstone after different tem-
perature treatments. J. Rock Mech. Eng. 37(S2), 3879–3890 (2018).
32. Ping, Q., Luo, X., Ma, Q. Y. & Yuan, P. Characteristics of crushing energy consumption of sandstone specimen under impact load.
J. Rock Mech. Eng. 34(S2), 4197–4203 (2015).
33. Wang, L. L. Stress Wave Basis (National Defense Industry Press, 2005).
34. Li, Y. H., Zhu, H. H., Shang, S. L. Y. & Wang, Q. L. Y. Deformation field measurement of sand model test based on image correla-
tion analysis. J. Geotech. Eng. 01, 36–41 (2004).
35. Dai, F., Xu, Y., Zhao, T., Xu, N. W. & Liu, Y. Loading-rate-dependent progressive fracturing of cracked chevron-notched Brazilian
disc specimens in split Hopkinson pressure bar tests. Int. J. Rock Mech. Min. Sci. 88, 49–60 (2016).
Acknowledgements
This research was supported by the National key Research and development program 2019YFC1904304.
Author contributions
Z.W. and X.C. wrote the main manuscript text and X.H. prepared all the figures. X.Z. did a lot of work in the
revision. All authors reviewed the manuscript.
Competing interests
The authors declare no competing interests.
Additional information
Correspondence and requests for materials should be addressed to K.Y.
Reprints and permissions information is available at www.nature.com/reprints.
Publisher’s note Springer Nature remains neutral with regard to jurisdictional claims in published maps and
institutional affiliations.
Open Access This article is licensed under a Creative Commons Attribution 4.0 International
License, which permits use, sharing, adaptation, distribution and reproduction in any medium or
format, as long as you give appropriate credit to the original author(s) and the source, provide a link to the
Creative Commons licence, and indicate if changes were made. The images or other third party material in this
article are included in the article’s Creative Commons licence, unless indicated otherwise in a credit line to the
material. If material is not included in the article’s Creative Commons licence and your intended use is not
permitted by statutory regulation or exceeds the permitted use, you will need to obtain permission directly from
the copyright holder. To view a copy of this licence, visit http://creativecommons.org/licenses/by/4.0/.
© The Author(s) 2021
Scientific Reports | (2021) 11:7096 | https://doi.org/10.1038/s41598-021-86610-7 12
Vol:.(1234567890)You can also read