Trends in maximum ice-induced water levels and flooding frequencies in some rivers of Quebec, Canada
←
→
Page content transcription
If your browser does not render page correctly, please read the page content below
CGU HS Committee on River Ice Processes and the Environment
                             21st Workshop on the Hydraulics of Ice Covered Rivers
                             Saskatoon, Saskatchewan, Canada, August 29-September 1, 2021

Trends in maximum ice-induced water levels and flooding frequencies in some
                        rivers of Quebec, Canada

                       Guillaume Poulin1, Tadros Ghobrial1, Benoit Turcotte2
     1
         Department of Civil & Water Engineering, Université Laval, 1045 avenue de la Médecine,
                                         Québec, QC, G1V 0A6
                                     guillaume.poulin.9@ulaval.ca
                                    tadros.ghobrial@gci.ulaval.ca
 2
     YukonU Research Center, Yukon University, 500 University Drive, Whitehorse, YT, Y1A 5K4
                                    bturcotte@yukonu.ca

            In cold regions, it is not uncommon for significant ice jams to cause the highest
            water level of the year. In a changing climate, weather parameters that directly and
            indirectly influence ice and hydrological processes are being altered, therefore
            affecting the frequency and intensity of dynamic ice processes that cause high water
            levels. This paper investigates the trends in peak water levels based on their origin
            (either freeze-up ice jams, breakup ice jams or open water) for nine Centre
            d’expertise hydrique du Québec (CEHQ) stations during the past 50 years (1970-
            2020). Also trends in ice induced flooding frequencies and magnitudes are
            presented based on provincial flooding database. Several additional information
            such as the satellite images as well as climatic data were used to analyze river ice
            formation and breakup effects on the stream stage signals and flood intensities. The
            expansion of this analysis to cover more stations and streams could deepen our
            understanding of the variation in temporal and spatial trends within the province of
            Quebec. This research is part of a national effort to better understand the impact of
            climate change on many aspects of river ice sciences and engineering.
1. Introduction The presence of ice in cold region rivers alters hydraulics conditions and oftentimes causes the highest annual water level. During freeze-up, a significant drop in air temperature can cause ice formation on most of the river surface overnight. As the ice front progresses upstream, the water level can rise rapidly (stages-up) due to a sudden increase in friction as well as ice occupying a portion of the channel section. Dynamic accumulation of incoming ice can take the form of a freeze-up jam. In shallower streams, the ice cover can grow thermally quickly and can even block most of the river flow, causing significant rises in upstream stage (Ashton, 1998). At breakup, the mobilization of the ice cover can be very dynamic (i.e., mechanical), with broken pieces of ice cover jamming together, causing fast rising and high water levels. Breakup can also be thermal with the ice cover melting in place with no apparent effect on water levels (Turcotte, et al., 2020). The breakup scenario depends on the complex interaction between the river’s morphological setup, the ice cover, and the environmental conditions. This complexity is further amplified by the effect of climate change which in turns directly and indirectly affects hydrological processes within the river watershed (Seneviratne, et al., 2012). These changes could already be affecting the intensity, as well as the frequency of maximum ice-induced water levels in northern rivers. Climate trends and variations from the baseline average of 1960-1991 published by Environment and Climate Change Canada (2021) showed that the western part of Quebec experienced a rise in air temperatures between 2°C and 4°C during winter as well as slightly warmer falls and slightly colder springs. Areas located more to the east and north of the province seem to be less affected by temperature changes. In terms of precipitation, southern regions of the province experienced a slight decline in precipitation as opposed to a slight increase for the north. Increase in precipitations together with warmer air temperatures could be an enhancer of flood occurrence (Kundzewicz, et al., 2007). As climate warms, river ice breakup generally tends to happen earlier and freeze-up occurs later, resulting in much shorter ice cover season duration (Magnuson, et al., 2000). Another important observation made in arctic regions is that dynamic breakup processes are slowly giving way to more thermal breakups (Cooley & Pavelsky, 2016). Based on this observation, ice jam frequency and intensity should be declining as ice cover duration is decreasing, which in turn would result in fewer recorded ice jam flooding events over time. However, the impacts of climate change on ice processes are various and Turcotte et al. (2019) expects freeze-up consolidation events to become more frequent, therefore raising the frequency and severity of major ice jam floods. The main objective of this study is to investigate the effect of climate change on maximum ice-induced water level trends for freeze-up and breakup seasons in the Province of Quebec. This is achieved using historical data from nine hydrometric stations and nearby weather stations to determine the maximum water level corresponding to each type of event; namely breakup ice jams, open water floods and freeze-up congestion or jamming. The second objective is to see if there are correlations between trends in peak intensity and the frequency of significant flooding events. This is all part of a national effort to better understand the impacts of climate change on various aspects of river ice sciences and engineering.
2. Methodology
2.1 Study sites and historical data
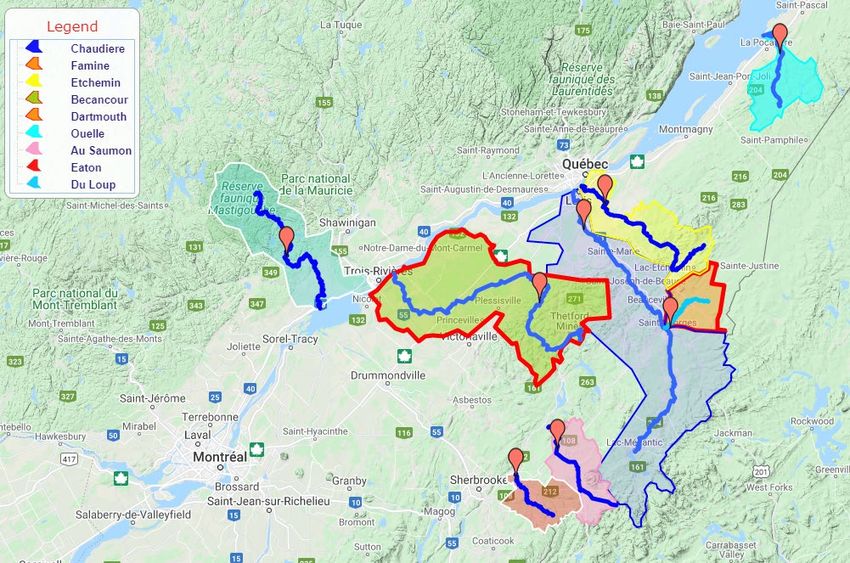
Nine rivers in Quebec were selected for this study, their location is shown in Figure 1. Several
criteria were used for this selection. Ideally, for statistical significance, selected hydrometric
stations would have water levels as well as discharge data for several decades. Hydrometric
stations in Quebec are managed by the Centre d'expertise hydrique du Québec (CEHQ) under the
Ministère de l’Environnement et de la Lutte contre les changements climatiques (MELCC) and for
most of the stations, the CEHQ provides instantaneous discharge and water levels from 1997
onwards, as well as daily water levels from 1992 onwards (MELCC, 2020A). Therefore, between
1992 and 1997, the water levels used are estimated from the daily measures, and from 1998 to
2020 they are 15-minute interval data. Another selection criterion was for the hydrometric station
to be as close as possible to a weather station. Since the goal of the study was to find trends in
maximum ice-induced water levels, stations with dynamic ice processes were prioritized over
rivers with more thermal river ice regimes. Also, stations where ice processes are affected by ice
control infrastructure such as hydroelectric dams were eliminated from the selection. Finally,
stations covering different parts of the province were selected. Key characteristics of the nine
hydrometric stations are presented in Table 1 with their corresponding weather stations. Note that
the data interval used for discharge is always daily because of the lack of available discharge from
CEHQ’ data during the winter.
022704
023303
052805
023402
024003 023422
030282
020602
030234
Figure 1. Locations of the nine rivers, their watershed and corresponding station.Table 1. Studied rivers and corresponding information.
River name: CEHQ Meteo. Record Watershed area Average
station ID# station length at hydrometric yearly
ID# (years) station discharge
(km2) (m3/s)
Bécancour: 024003 7024250 29 914 22
Chaudière: 023402 7027840 49 5820 117
Dartmouth: 020602 7052601 29 626 15
Du Loup: 052805 7016816 29 769 13
Eaton: 030234 7028123 29 646 13
Etchemin: 023303 7024254 29 1152 27
Famine: 023422 7027283 29 696 15
Ouelle: 022704 7054096 29 796 15
Au Saumon: 030282 7024320 29 769 18
2.2. Databases
Flooding information from two provincial flooding databases were also used to investigate trends
in flooding frequency that corresponds to each type of flooding event (freeze-up, breakup and open
water). The first database is developed and maintained by the Ministère de la Sécurité Publique
du Québec (MSP) and contains flooding information from the year 1991 and forward (the free
public database can be found at: https://www.donneesquebec.ca/recherche/dataset/historique-
publique-d-embacles-repertories-au-msp). The MSP database includes: the river name as well as
the flooded municipality, the date of the event, the cause of the flood as well as the severity of the
event. The second database is managed by the Ministère du Transport du Québec (MTQ) and goes
back to flooding events recorded in the nineteenth century. However, the data in the MTQ database
comes from newspaper articles and municipal reports, which can be difficult to quantify. The
number of events recorded in the MTQ database after 1990 is also very scarce. Therefore, for the
current study, the MTQ database was used for the period before 1990, and the MSP database was
used from 1990 onward. Table 2 presents the number of flooding events recorded at or near each
of the nine study sites as recorded by both the MSP and the MTQ databases. As shown in Table 2,
there were no significant number of flooding events on the Dartmouth and Famine rivers, and
therefore, they were excluded from the frequency analysis.Table 2. Summary of the flood records in the databases from the MSP and MTQ.
River name: station ID# Number of recorded events Period of record
Bécancour: 024003 61 1876-2020
Chaudière: 023402 105 1850-2020
Dartmouth: 020602 2 2015-2020*
Eaton: 030234 16 1924-2020
Etchemin: 023303 24 1866-2020
Famine: 023422 0 -
Du Loup: 052805 9 1924-2020
Ouelle: 022704 10 1927-2020
Au Saumon: 023422 12 2008-2020*
*Only recorded events are in this period, but reliable hydrological information since 1992.
3. Data analysis
The biggest part of the analytical effort is done through water levels, but discharge and weather
conditions are also useful in understanding processes in each river as well as to help distinguish
ice-induced from open-water events. Water level data retrieved from the CEHQ archives were
plotted for each station and for each year of record together with their corresponding air
temperature and precipitation data from Environment Canada archives. Also using the mean daily
air temperatures near each station, the cumulative degree-days of thaw (CDDT) and the cumulative
degree-days of freezing (CDDF) were calculated for breakup and freeze-up seasons, respectively.
An example of these plots is shown in Figure 2 for the Bécancour station (024003) for the year
1998. Several stations have gap in the water level measurements that can range from 2 to 72 hours
for instantaneous data to several days, or weeks, for daily data. This is illustrated in water level
data in Figure 2a towards the end of May. The reasons for these gaps vary but are mostly due to
filtering of extreme values by provincial operators or due to device malfunction. Since the analysis
used raw data files (uncorrected water levels), the latter is the only one of concern. Considering
that ice jams can form in less than an hour and can raise the water levels up by several meters,
instantaneous data was used for water level analyses from 1997 and afterwards. Prior to 1997, no
instantaneous data was available for CEHQ’s stations. A peak factor correlating instantaneous
levels to daily levels was calculated for each station using the period when both data types are
available (i.e., 1997 to 2020). This factor was used to roughly estimate peak water levels for the
data series prior to 1997 (see Table 2). For some stations, when the coefficient of determination
was too low, the difference between the overall average of the water levels from both data sets for
the river was instead used as a correction.32
a)
31
30
Stream stage (m)
29
28
27
26
01-Jan 01-Feb 01-Mar 01-Apr 01-May 01-Jun 01-Jul 01-Aug 01-Sep 01-Oct 01-Nov 01-Dec
b) 35 60
Precipitations Temperature
25 50
Temperature (°C)
15 40
Precipitation (mm)
5 30
-5 20
-15 10
-25 0
01-Jan 01-Feb 01-Mar 01-Apr 01-May 01-Jun 01-Jul 01-Aug 01-Sep 01-Oct 01-Nov 01-Dec
Figure 2. Data plots for a) water level and b) meteorological data used to determine the peaks of
1998 for station 024003.
The open water peak is the easiest annual event to identify since its hydrograph usually shows a
gradual rising and falling limbs. However, breakup and freeze-up peaks are often harder to identify
on a daily hydrograph. They can require significant interpretation of discharge data (when
available), and the CDDT and the CDDF for breakup and freeze-up, respectively. Breakup peaks
due to jamming are usually characterized by a sudden rise and a sudden drop in water levels once
the jam has released. It is usually hard to see in a daily-average chart, especially for small rivers,
and require instantaneous levels to verify. Freeze-up peaks have a similar chaotic pattern, but their
recession is usually more gradual while the ice cover is smoothing, stabilizing, and eventually
thickening. A conceptual example of instantaneous water level hydrographs for each type of event
is shown in Figure 3.25
a)
24.5
24
23.5
Water level (m)
23
22.5
22
21.5
04-01 0:00 04-02 0:00 04-03 0:00 04-04 0:00 04-05 0:00 04-06 0:00 04-07 0:00 04-08 0:00
Date and time
21.8
b)
21.6
Water level (m)
21.4
21.2
21
20.8
05-13 0:00 05-14 0:00 05-15 0:00 05-16 0:00 05-17 0:00 05-18 0:00 05-19 0:00 05-20 0:00
Date and time
c) 25.8
25.75
25.7
Water level (m)
25.65
25.6
25.55
12-08 21:36 12-09 16:48 12-10 12:00 12-11 7:12 12-12 2:24
Date and time
Figure 3. Water level hydrograph for a) breakup peak on the Chaudière in 2020, b) open water
event on the Chaudière in 2016, and c) freeze-up peak on Eaton River in 2007.
In Figure 3a, several dynamic breakup processes occurred on the 3rd and 4th, with the last one,
probably an ice-jam release event, showing the highest peak. In Figure 3b, the hydrograph is
smooth as it is typical for open water events. As the discharge gets higher, the water level rises
following the local rating curve. Figure 3c presents a freeze-up event. There is an initial sharp rise
in the water level, probably the initial obstruction of the stream, followed by 40 hours of more or
less constant rising water level.
The amount of precipitation in the days preceding an identified peak is also an important parameter
to distinguish the type of maximum water level event. An example of that is a peak occurring
during a mid-winter breakup event that would have been initiated by a rain on snow event. These
mid-winter events usually affect subsequent ice processes significantly in the spring (Beltaos,
2002). Due to the complexity of the processes involved, multiple studies could yield differentinterpretations of these peaks. It is important to note that the local knowledge of the characteristics
of studied rivers is also important since these processes are chaotic and can even differ significantly
between locations along the same river.
A similar river ice processes classification was done as part of the Canadian River Ice Database
or CRID (de Rham, et al., 2020) up to the year 2015. Only three rivers (Chaudière, Dartmouth,
and Du Loup rivers) from the current study were included in the CRID database. The dates of
breakup from the CRID database were found to be consistent (± 1 days) with the dates estimated
from the current analysis in most cases. For freeze-up and mid-winter breakups, more events were
identified in the CRID database, but the dates were generally fairly consistent (± 2 days).
4. Results and discussion
4.1 Trends in intensity of peak annual ice-induced events
Three different peaks were identified for each year and for all stations, and automated interpolated
trends were drawn. Table 3 presents the estimated trends in terms of m/decade for all river and for
the three types of events. Positive values mean a rising trend in water levels and negative values
mean a decreasing trend in tater levels. There is no universal trend in any of the water level (stage)
peak types. As shown in Table 3, there are more rising trends than decreasing trends, but it varies
significantly between rivers and event type. Five out of nine rivers present a rising open water peak
intensity, and generally higher slopes, which results in a trend that is significantly more important
than for ice events. Also, two third of the studied rivers present uptrends for freeze-up high water
events. Finally, for breakup events, the data is conflicting, there are some significant trends both
upwards and downwards.
Table 3. Studied rivers and their corresponding trends.
Breakup Open water Freezup
River name (m/decade) (m/decade) (m/decade)
Bécancour 0.043 -0.025 0.042
Chaudière -0.150 0.095 -0.041
Dartmouth 0.253 -0.011 0.171
Eaton -0.071 0.098 0.024
Etchemin -0.099 0.123 0.037
Famine 0.024 0.186 -0.051
Du Loup 0.156 0.205 0.017
Au Saumon -0.106 -0.083 -0.056
Ouelle -0.039 -0.078 0.116
It is important to note that some streams present a much higher stage variability, making the effect
of historical extreme events less dominant on their trends than for streams with small intra-year
water stage change. For example, the Chaudière sees rises of as much as three meters to its water
level, but the peaks on the Bécancour are usually within one meter of the open water levels. The
impact of a single extreme peak event is therefore stronger on the latter.Freeze-up trends seem to represent the most robust results found in this study: peak intensity is
generally going up. It has both the highest number of studied rivers with a rising trend and the
smallest variance of the three types of events.
Out of the nine rivers, only the Du Loup river sees a rising in the intensity of all event types, and
only the Au Saumon River sees declining peak intensities for all processes. Both rivers are situated
in regions of the province with similar climate change trends (Environment and Climate Change
Canada, 2021) and therefore with comparable variations in meteorological conditions, yet their
results are opposite. Breakup and freeze-up peaks are following same trends for six out of nine
rivers, and the Bécancour River has approximately the same rising trend for both ice-induced
events: 0.043 for breakup and 0.042 for freeze-up.
The Famine River is an affluent of the Chaudière River, yet there are important differences
between their trends. Figure 4 shows the trend graph for the Famine River and Figure 5 for the
Chaudière River. Freeze-up variations are similar, but breakup intensity in the Chaudière is shifting
-0.15 m per decade while the Famine is rising by 0.024 m per decade.
31 Freezup Open water Breakup
30
29
Stream stage (m)
28
27
26
25
Year
Figure 4. Evolution of the peak water level for the Famine River between 1993 and 2020 for the
three type of peak events.
The station on the Chaudière River is almost 75 km downstream of the mouth of the Famine River
and its discharge is affected by several tributaries’ inflows, while the Famine is a smaller gravel
bed stream with a relatively high slope. Breakup events on the Famine are always happening at a
relatively low discharge (under 100 m3/s) and are therefore more predictable. In turns, water level
and discharge values corresponding to breakup peaks are historically very scattered for the
Chaudière, making it more likely to generate extremes with climate change (and, given the high
risk of flooding [Turcotte et al., 2020], also more likely to see ice control infrastructure to be built).
Development in the floodplain of the Chaudière River, as well as modifications to its bed, has
taken place over the studied period, which may induce an anthropogenic effect to the results.117
116
115
Water level (m)
114
113
112
111
1972 1974 1976 1978 1980 1983 1985 1987 1989 1991 1993 1995 1997 1999 2001 2003 2005 2007 2009 2011 2013 2015 2017 2019
Year Breakup Freezup
Figure 5. Evolution of the peak water level for the Chaudière River between 1973 and 2020 for
ice-induced peak events.
Instantaneous stream stage and discharge values for the years prior to 1997 can be highly uncertain
based on the correlation between daily-average and instantaneous data for each studied river and
event types. The coefficient of determination of this correlation varies between 99.4% for the open
water events of the Du Loup River to 27% for the breakup events of the Ouelle River. These
coefficient as well as the equation to determine the peak correction for every type of event at every
station are presented in Table 4. The correlation is generally strong for open water as well as freeze-
up events. However, breakup events can be very intense and the R2 values at different stations
suggest that estimating instantaneous water levels from daily data for this type of event can lead
to significant misestimation. This shows that for certain stations, using a single correlation lumping
together all three types of events can lead to higher levels of uncertainties, at least for smaller
streams.
Table 4. Correlation between instantaneous and daily water levels.
River name Breakup Open water Freeze-up
2 2 2
R Correction R Correction R Correction
Bécancour 0,92 0,85 HDM+4,71 0,99 1,05 HDM -1,44 0,88 1,08 HDM -2,31
Chaudière 0,76 1,39 HDM-8,21 0,97 1,02 HDM-0,51 0,72 1,17 HDM-3,61
Dartmouth 0,88 0,96 HDM+1,42 0,90 1,08 HDM-2,45 0,99 1,15 HDM-4,26
Eaton 0,50 1,205** 0,77 1,19 HDM+4,85 0,77 1,19 HDM+4,85
Etchemin 0,79 1,17 HDM-7,81 0,57 0,222** 0,97 0,92 HDM+3,94
Famine 0,43 0,372** 0,87 1,31 HDM-8,60 0,88 1,12 HDM-3,34
Du Loup 0,95 1,02 HDM-0,32 0,99 1,01 HDM-0,37 0,85 0,93 HDM+2,18
Ouelle 0,27 0,465** 0,94 1,19 HDM-9,29 0,97 1,06 HDM-3,10
Au Saumon 0,36 0,419** 0,94 1,16 HDM-4,60 0,93 1,14 HDM-4,04
**The correlation is considered too low and a static average value is used
Example graphs of this correlation are shown in Figure 6. Estimations of instantaneous values
prior to 1997 are back calculated based on these relationships, and this could impact the trendresults, at least for stations with poor correlations (for at least one type of event) such as the Au
Saumon and Ouelle River.
a) 30.5 b) 32
HIM = 1,0836*HDM - 2,3084 HIM = 0,853HDM + 4,7082
31.5 R² = 0,9184
R² = 0.8879
HIM, Instant max (m3/s)
HIM, Instant max (m3/s)
30 31
30.5
29.5
30
29 29.5
29
28.5
28.5
28 28
28 28.5 29 29.5 30 27.5 28.5 29.5 30.5 31.5
HDM, Daily max, (m3/s) HDM, Daily max, (m /s)
3
c) 24 d) 25.5
HIM = 1,1722HDM - 3,6058 HIM = 1,3856HDM - 8,2145
25 R² = 0,7569
23.5 R² = 0,7193
24.5
HIM, Instant max (m3/s)
HIM, Instant max (m3/s)
23 24
23.5
22.5 23
22.5
22 22
21.5 21.5
21
21 20.5
21 21.5 22 22.5 23 20 21 22 23 24
HDM, Daily max, (m3/s) HDM, Daily max, (m3/s)
Figure 6. Correlation between instantaneous and daily data for a) freeze-up and b) breakup on the
Bécancour River; and c) freeze-up and d) breakup on the Chaudière River.
These wide variations also reveal how flooding processes in some rivers are inherently controlled
by mechanical ice processes and their effect on the speed at which the stream stage can change.
The impact of breakup processes on the Du Loup River water levels are very limited in terms of
time and amplitude variations, meaning that river ice is evacuated very thermally. Overall, ice
processes seem to generally have minimal effects on the Du Loup River water levels, with an ice-
induced backwater reaching 30 cm at most. Being a very flat river flowing to the South, it is not
surprising that processes are very thermal. On the other hand, ice-induced peaks on the Au Saumon
River are generally well-above the open water rating curve and the water level rises quickly and
significantly when ice jams occur.
The study found that most ice-induced peaks do not seem to be declining over time. Climate trends
and variations, through shorter ice seasons and thinner ice covers, support such a decline, alsoreported for studies in arctic regions (Cohen, Ye, & Jones, 2015). This may in part be due to the rising number of rain-on-snow events occurring in the studied watersheds as well as to multiple other effects likely canceling each other, partially or completely. For freeze-up related events, the rising frequency of significant late rain events quickly followed by freezing temperatures seems to be a plausible explanation for the rise (Cunderlik & Ouarda, 2009). Finally, the rise in open water peaks is in part explained by the higher precipitation variability observed in the last decades, leading to higher peaks and lower minimums (Kundzewicz, et al., 2007). Rain-on-snow events generally represent the main cause of significant mid-winter breakup events and seem to shift the open water peaks to later in summer or autumn instead of mid-spring. There is usually less river ice coverage and snowpack at springtime, therefore supporting fewer dynamic breakup events. The roughness of the ice cover is also heavily modified by those mid-winter events. However, in some cases, a new river ice formation cycle follows and creates consolidated ice with stronger mechanical properties and even more significant ice jams in spring. Turcotte et al. (2019) concludes that fewer ice jam floods should occur, but the frequency and intensity of major ice jam floods should rise. Those two opposing theories could very well partially cancel each other out, or work for different streams. Beyond their importance in the annual river ice cycle, these mid-winter breakup events seem to be more common in recent years, but not necessarily more intense (Cohen, Ye, & Jones, 2015). In the literature, research on the impact of climate change on ice-induced events have also found contradicting results. Many similar studies from northern regions of the world have a similar conclusion: there is no widespread common trends in the intensity of floods and in the frequency at which they occur (Rokaya, et al., 2008), (Cunderlik & Ouarda, 2009), (Villarini, et al., 2009). A study from 139 stations in Russia has found that spring peak discharge tends to be happening earlier than a few decades ago but cannot find any reliable trends in terms of intensity (Shiklomanov, et al., 2007). A similar study from 136 Water Survey of Canada stations finds peaks to be declining, breakups to happen sooner and freeze-up to happen later (Von de Wall, et al., 2010). The study is one of the few that finds almost widespread evidence of a decline. However, data from this study is mostly from the Prairies and the northeastern region of British Columbia where the effects of climate change are different than in southern Quebec. A study done on seven rivers in the province of Quebec found that ice jam floods could occur more often in a number of rivers in Quebec after 2040, mostly because of a shift from a single spring breakup event to several mid-winter breakup events (Turcotte, et al., 2020). All the reviewed literature and the current results show that the effects of climate change on maximum ice-induced water levels vary widely regionally, even between neighboring watersheds. Not only is the interaction between the climate system, morphological characteristics, and ice processes very complex, but human engineering factors also induce changes that are hard to take into account or to predict. Most studies on the impact of climate change on ice processes have focused on large rivers; the current study is one of the few to mostly include smaller streams. This may explain the significant
trends obtained from rivers of the same region. However, large scale studies on smaller streams
are challenging because of the lack of automated measuring stations, the short records, and the
acquisition time that may not allow “catching” the peaks, especially for streams where breakup
conditions can shift significantly in a couple of minutes.

4.2   Frequency of ice-related events
Two provincial ice-related flood databases are used to try correlating trends in peak water levels
with frequency of recorded flooding events. The information in the MTQ database comes from
newspapers and municipal sources and is very scarce for most rivers. However, it provides a good
overview of the most significant floods for these rivers, as well as the date they occurred. Data
from the MSP database is more coherent, it includes information for all communities of Quebec,
and comprises events of different intensities, but it is only going back to 1990, and may excludes
some events. There is also a third database prepared by Mayer-Jouanjean and Bleau (2018), which
provides an analysis of the total number of floods, not just ice-induced events. The review of
provincial meteorological archives and municipal flood damage reports is extremely thorough for
every major river of southern Quebec (South side of St. Lawrence River between Montreal and
Lévis).

A high frequency of ice-induced peak flooding events was reported for the Chaudière River from
the 1880s to 1910s (Figure 7), followed by a downwards trend, another peak in the 1950s and a
third peak in the last 30 years where many extreme events were reported and documented. Results
for the Bécancour are similar although much less frequent, as there is a first peak in the late 19th
century, then another one in the mid-20th century and a significant higher flood frequency at the
beginning of the 21st century (Figure 7). There has been, without a doubt, several major ice-induced
flooding events in the last decade in Quebec. However, the higher rate of reported events in the
last 30 years could be due to the additional public interest and media coverage as well as increased
flood exposure in recent years. In turn, minor ice jam flood events, as reported by the MSP database
after 1990, would most likely have not made the news prior to 1990, and were therefore excluded
from Figure 7. The Etchemin River, another direct neighbor of the Chaudière River (Figure 1),
was affected by ice-induced flood events 3 times during the 1890s and of 5 times in the 1990s, but
there have constantly been only 1 or 2 significant events for the other decades. The assessment of
changes has a high level of uncertainty considering that the data comes from several different
databases, with different methodologies and errors as well as the difficulty to verify some of the
information.
1.4
                                      Bécancour

                                      Chaudière
                       1.2

                           1
Average number of events

                       0.8

                       0.6

                       0.4

                       0.2

                           0
                               1870s 1880s 1890s 1900s 1910s 1920s 1930s 1940s 1950s 1960s 1970s 1980s 1990s 2000s 2010s
                                                                       Decades
          Figure 7. Average number of ice-induced flooding events per year presented by decade for the
                                       Chaudière and Bécancour Rivers.
The Chaudière River is by far the one with the most accurate data as it can be validated by more
than one database. Also the data from the CEHQ water level database goes back earlier than other
studied rivers. In the Mayer-Jouanjean & Bleau (2018) database, the more important ice jam flood
peak seems to occur in the 1970s, but there is also a high density of flooding events reported during
the second half of the 1930s, in 1990s and in the 2010s, which is also the case in the current study.

The study of the severity of the different ice-related flooding events, available in the MSP’s
database, also brings interesting results for the Bécancour (Figure 8) and Chaudière (Figure 9)
Rivers. For Bécancour River, the second half of the 2010s has seen a lot more events taking place,
but with generally lower intensity. This is in contradiction with the results presented in Table 3,
where ice-induced peaks seem to be rising over the period.
8
7
6
Number of ice-related flooding event registered
5 Very high
High
4
Moderate
3 Minor
Unknown
2
1
0
1995
1996
1997
1998
1999
2000
2001
2002
2003
2004
2005
2006
2007
2008
2009
2010
2011
2012
2013
2014
2015
2016
2017
2018
2019
2020
Year
Figure 8. Intensity of the different ice-related flooding events in the Bécancour River for the
1995-2020 period.
For the Chaudière River, the frequency of ice-induced flooding events (Table 2) is only slightly
higher over the period, but the rise in event intensity is evident in Figure 9. It is of interest to note
that there seems to have be no reported ice jam flood events between 1996 and 2005 in the
Chaudière basin, which is historically improbable, but verified by archival work from Grenier
(2005). These results also seem to be in direct contradiction with ice-induced peak event trends
shown in Table 3.6
5
Number of ice-related flooding events
4
Very High
High
registered
3
Moderate
2 Minor
Unknown
1
0
1991
1992
1993
1994
1995
1996
1997
1998
1999
2000
2001
2002
2003
2004
2005
2006
2007
2008
2009
2010
2011
2012
2013
2014
2015
2016
2017
2018
2019
2020
Year
Figure 9. Intensity of different ice-related flooding events in the Chaudière River for the 1991-
2020 period.
The severity factor in the MSP database is subjective and can depend on damage to infrastructure
around the river during the period as well as the interpretation of the different criteria by the
observer. The previous section should therefore not be used to evaluate the intensity of ice-induced
events by comparing it to quantified, accurate water level peaks. Moreover, recorded events from
that database includes different municipalities along the same rivers whereas the station is
measuring water levels that are only representative of hydrological processes at one location, at
least for ice-induced water levels. Therefore, only flood events reported near the station should be
compared with measured water levels.
Results from different flood event databases suggest a rising trend in the frequency of ice-related
high water events in the last decades, in line with results of peak water levels presented in Table
2. However, it is possible that different factors are inducing a bias in the database approach. More
studies should be done on the subject to verify the results, possibly through modelling. For
example, Turcotte et al. (2020) used a breakup intensity forecast model to simulate future trends
in river ice breakup intensity for seven rivers in Quebec.
The number of recorded events in the past for several other studied rivers (Dartmouth, Famine, Du
Loup and Au Saumon) is limited in time or in number, and no conclusions regarding historical
trends can be made about them so far. However, if trends form in the coming decades, they could
probably be linked to climate change as those rivers only had a handful of flooding events in
recorded history. Therefore, more studies should be done in the future to track the evolution and
note significant changes.The flooding events from the different databases has been used to cross-validate the high water levels for the stations. However, the results are somewhat insubstantial. To make sure the data is reliable, the event needs to occur close to the studied station. The current study also considers only the annual peak for each type and does not take in consideration years with multiple peaks. This is a significant limitation in many stations as the number of floods occurring at or near the station can be very low, and many of them are secondary peaks in the same year. The exercise is to be done more thoroughly in a future study for operational prediction of ice-jam floods on major streams in Quebec. 5. Conclusion The objective of this study was to illustrate trends in ice-induced peak water levels. The results did not show evident correlation that could be confidently associated with climate change. As altered climate patterns modify various thermal, hydrological, and even morphological processes, they obviously affect ice-induced water levels in many ways. However, some of these modifications directly cancel each other, resulting in low-correlation or opposing trends for breakup and freeze- up events. Human engineering may also significantly modify the behavior of a river over time, either by directly regulating flow or hydraulic conditions, or through the indirect effects of urbanization and agriculture on stream parameters, therefore further complicating the quantification of the effects of climate change on ice-induced floods. The time series length available for studied stations was somewhat limiting the efficiency of the adopted historical trend analysis technique, which is prone to interpretation and therefore less systematic. As the number of rivers studied in any given region is low, it is often impossible to confirm a spatial trend. Moreover, trends seem to be extremely variable in a single region, even for neighboring watersheds, as it has been foreseen by Turcotte et al. (2020). Several studies pointed to a prevalence of downward trends for breakup events, but as presumed by Turcotte et al. (2019) many different stations have seen rising intensity in their water level peaks over the years. Upward trends in freeze-up peaks have been observed, partially because of the increasing amount of significant rain events late in the season. The lack of water level data before 1992 and the small number of complete yearly series with instantaneous data represents a limitation to the accuracy of the results. The very high variability in the correlation between instant and daily water levels for the different peak event types suggests that using a single peak correction value at a certain station could lead to larger uncertainties and even inaccuracy in the calculated water levels, especially for breakup. The analysis of the evolution of the frequency of ice-induced floods was completed for five rivers and results suggest a slight (recent) historical rise. However, the data was obtained from several
different sources using different methodologies and assumptions, therefore leading to a high
uncertainty, especially earlier in the record.

On a longer timeframe, as more data gets added to the records, ice-induced flood (or maximum
water level) trends might become more evident, both in terms of frequency and intensity. As
historical data series for nine rivers have already been processed, it would be interesting to continue
this research effort in the following years and to corroborate results using robust hydrological and
ice models to see if maximum water level trends become more evident. This would be useful for
the development of sustainable flood risk reduction strategies across Quebec.

Acknowledgments
This research was partially funded through support from the MSP and a NSERC undergraduate
student research award (USRA). Also, we would like to thank the MSP for providing access to the
databases used in this study.

References
Ashton, G. D. (1979, February). River Ice: The presence of ice on rivers changes their behavior,
       interferes with their use, and causes severe economic disruption. American Scientist, 67(1),
       pp. 38-45. Retrieved May 8, 2021, from http://www.jstor.org/stable/27849059
Ashton, G. D. (1998, October 08). Ice in lakes and rivers. Retrieved April 2020, from Britannica:
       https://www.britannica.com/science/lake-ice/Ice-in-rivers
Beltaos, S. (2002, March). Effects of climate on mid-winter ice jams. Hydrological Processes,
       16(4), pp. 789-804. doi:10.1002/hype.370
Cohen, J., Ye, H., & Jones, J. (2015). Trends and variability in rain-on-snow events. Geophysical
       Research Letters, #42. doi:10.1002/2015GL065320
Cooley, S. W., & Pavelsky, T. M. (2016, March 15). Spatial and temporal patterns in Arctic river
       ice breakup revealed by automated ice detection from MODIS imagery. Remote Sensing of
       Environment, 175, pp. 310-322. doi:10.1016/j.rse.2016.01.004
Cunderlik, J., & Ouarda, T. (2009, Septembre 2015). Trends in the timing and magnitude of floods
       in      Canada.        Journal      of     Hydrology,       375(3-4),        pp.    471-480.
       doi:10.1016/j.jhydrol.2009.06.050
de Rham, L., Dibike, Y., Beltaos, S., Peters, D., Bonsal, B., & Prowse, T. (2020). A Canadian
       River Ice Database from the National Hydrometric Program Archives. Earth System
       Science Data, 12(3), pp. 1835-3860. doi:10.5194/essd-12-1835-2020
Environment and Climate Change Canada. (2021). Climate Trends and Variations Bulletin.
       Canada. Retrieved April 2021, from https://www.canada.ca/en/environment-climate-
       change/services/climate-change/science-research-data/climate-trends-variability/trends-
       variations.html
Grenier, F. (2005). 1773 à aujourd'hui: Catastrophes hydrologiques en Beauce. Cap-aux-
       Diamants(82), pp. 14-19.
Kundzewicz, Z., Mata, L., Arnell, N., Doll, P., Kabat, P., Jimenez, B., . . . Shiklomanov, I. (2007).
       Freshwater resources and their management. pp. 173-210.
Magnuson, J. J., Robertson, D. M., Benson, B. J., Wynne, R. H., Livingstone, D. M., & al. (2000,
September 08). Historical Trends in Lake and River Ice Cover in the Northern Hemisphere.
Science, 289(Issue 5485), pp. 1743-1746. doi:10.1126/science.289.5485.1743
Mayer-Jouanjean, I., & Bleau, N. (2018). Projet 551013: Historique des sinistres d'inondations et
d'étiages et des conditions météorologiques associées. Montréal: Ouranos. Retrieved May
2021, from https://www.researchgate.net/profile/Nathalie-
Bleau/publication/326632059_Historique_des_sinistres_d%27inondations_et_d%27etiag
es_de_leurs_consequences_de_leur_gestion_des_conditions_meteorologiques_associees_
et_des_solutions_mises_en_place/links/5b59d2c2
Ministère de l'Environnement et de la Lutte contre les changements climatiques. (2020A). Données
des mesures hydrologiques historiques du Québec. Québec: Direction de l'expertiste
hydrique: Division de l'hydrométrie.
Ministère de l'Environnement et de la Lutte contre les changements climatiques. (2020B). Données
du Réseau de surveillance du climat du Québec. Québec: Direction de la qualité de l'air et
du climat.
Rokaya, P., Budhathoki, S., & Lindenschmidt, K.-E. (2008). Trends in the Timing and Magnitude
of Ice-Jam Floods in Canada. Scientific Reports, 8(5834). doi:10.1038/s41598-018-24057-
z
Seneviratne, S., Nicholls, N., Easterling, D., Goodess, C., Kane, S., Kossin, J., . . . Zhang, X.
(2012). Changes in climate extremes and their impacts on the natural physical
environment. Working Groups I and II of the Intergovernental Panel on Climate Change.
Cambridge and New York: Cambridge University Press.
Shiklomanov, A., Lammers, R., Rawlins, M., Smith, L., & Pavelsky, T. (2007). Temporal and
spatial variations in maximum river discharge from a new Russian data set. Journal of
Geophysical Research- Biogeosciences, 112. doi:10.1029/2006JG000352
Turcotte, B., & Morse, B. (2015). River ice breakup forecast and annual risk distribution in a
climate change perspective. 18th Workshop on the Hydraulics of Ice Covered Rivers.
Quebec: Committee on River Ice Processes and the Environment.
Turcotte, B., Burell, B. C., & Beltaos, S. (2019). The impact of Climate Change on Breakup Ice
Jams in Canada: State of knowledge and research approaches. 20th Workshop on the
Hydraulics of Ice Covered Rivers. Ottawa: Committee on River Ice Processes and the
Environment.
Turcotte, B., Morse, B., & Pelchat, G. (2020). Impact of Climate Change on the Frequency of
Dynamic Breakup Events and on the Risk of Ice-Jam Floods in Quebec, Canada. (MDPI,
Ed.) Water, 12(10). doi:10.3390/w12102891
Villarini, G., Serilnadi, J., Smith, J., & Krajewski, W. (2009). On the stationarity of annual flood
peaks in the continental United States durint the 20th century. Water Ressources Research,
45. doi:10.1029/2008WR007645
Von de Wall, S., De Rham, L. P., & Prowse, T. D. (2010). The River Ice Break-Up Season in
Canada: Variations in water Levels and Timing. 67th Eastern Snow Conference. Hancock,
MA.You can also read