Energy Recovery Potential in Industrial and Municipal Wastewater Networks Using Micro-Hydropower in Spain - REDAWN
←
→
Page content transcription
If your browser does not render page correctly, please read the page content below
water
Article
Energy Recovery Potential in Industrial and Municipal
Wastewater Networks Using Micro-Hydropower in Spain
Aida Mérida García 1, *, Juan Antonio Rodríguez Díaz 2 , Jorge García Morillo 2 and Aonghus McNabola 1

                                          1   Department of Civil, Structural and Environmental Engineering, Trinity College Dublin,
                                              Dublin D02 PN40, Ireland; amcnabol@tcd.ie
                                          2   Department of Agronomy, Campus Rabanales, University of Cordoba, Edif. Da Vinci, 14071 Cordoba, Spain;
                                              jarodriguez@uco.es (J.A.R.D.); g62gamoj@uco.es (J.G.M.)
                                          *   Correspondence: g82megaa@uco.es

                                          Abstract: The use of micro-hydropower (MHP) for energy recovery in water distribution networks
                                          is becoming increasingly widespread. The incorporation of this technology, which offers low-cost
                                          solutions, allows for the reduction of greenhouse gas emissions linked to energy consumption. In
                                          this work, the MHP energy recovery potential in Spain from all available wastewater discharges,
                                          both municipal and private industrial, was assessed, based on discharge licenses. From a total
                                          of 16,778 licenses, less than 1% of the sites presented an MHP potential higher than 2 kW, with a
                                          total power potential between 3.31 and 3.54 MW. This total was distributed between industry, fish
                                          farms and municipal wastewater treatment plants following the proportion 51–54%, 14–13% and
                                          35–33%, respectively. The total energy production estimated reached 29 GWh·year−1 , from which
                                80% corresponded to sites with power potential over 15 kW. Energy-related industries, not included
                                   in previous investigations, amounted to 45% of the total energy potential for Spain, a finding which
Citation: Mérida García, A.;              could greatly influence MHP potential estimates across the world. The estimated energy production
Rodríguez Díaz, J.A.; García Morillo,     represented a potential CO2 emission savings of around 11 thousand tonnes, with a corresponding
J.; McNabola, A. Energy Recovery          reduction between M€ 2.11 and M€ 4.24 in the total energy consumption in the country.
Potential in Industrial and Municipal
Wastewater Networks Using                 Keywords: wastewater treatment plants; industries; fish farms; renewable energy; hydropower
Micro-Hydropower in Spain. Water          potential
2021, 13, 691. https://doi.org/
10.3390/w13050691

Academic Editor: Giuseppe Mancini
                                          1. Introduction
Received: 8 February 2021                      The increase in global energy consumption [1] has been transformed into a rise in fossil
Accepted: 28 February 2021                fuel demand, led by natural gas, representing 44% of the global annual primary energy
Published: 4 March 2021                   demand [2]. This growth is driven by an economy with increasing energy requirements
                                          due to the technological revolution and, above all, the demand for cooling, heating and
Publisher’s Note: MDPI stays neutral      transport. In this context, global energy-related CO2 emissions grew by 1.7% in 2018 to
with regard to jurisdictional claims in   reach a historic high of 33.1 annual Gt CO2 , which represents an increase of around 0.5% for
published maps and institutional affil-   every 1% growth in global economic output, despite the growth of renewable energies [2].
iations.                                  These figures support the unquestionable need of a global transformation of the energy
                                          generation system.
                                               The increase in water and energy consumption in industry coincides with fast de-
                                          velopment transforming water use patterns in emerging market economies. The use of
Copyright: © 2021 by the authors.         water by sectors is clearly led by the primary sectors (agriculture, forestry, fishing, aquacul-
Licensee MDPI, Basel, Switzerland.        ture, mining and quarrying, among others), while industry (self-supply) and municipal
This article is an open access article    water supply represents around 8% of total water use [3]. The industrial productivity
distributed under the terms and           of course varies between products, but also, for the same product, it varies significantly
conditions of the Creative Commons        across countries [4,5]. For that reason, it is not easy to estimate real values of water con-
Attribution (CC BY) license (https://     sumption in industries, nor is it easy to access to real data for specific products. On the
creativecommons.org/licenses/by/          other hand, energy requirements related to the industry sector reached 261 million tonnes
4.0/).

Water 2021, 13, 691. https://doi.org/10.3390/w13050691                                                       https://www.mdpi.com/journal/water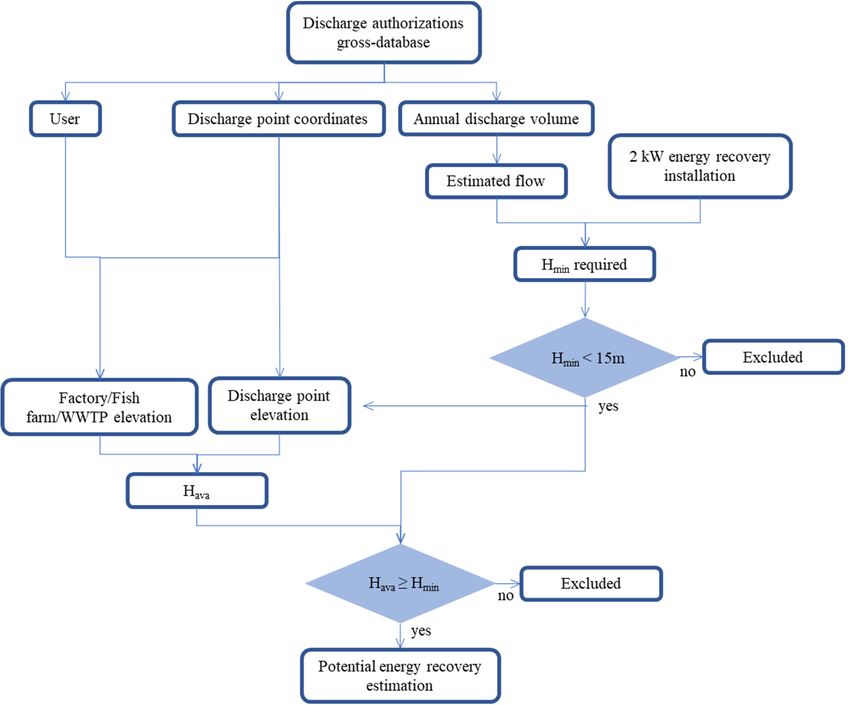
Water 2021, 13, 691                                                                                            2 of 14

                      of oil equivalent in Europe, only behind the transport sector (326.9 Mt oil eq.), and con-
                      sumption in households (288 Mt oil eq.) [6]. In Spain, industry has traditionally been the
                      largest consumer of energy. However, savings and efficiency measures that began to be
                      implemented in the 1970s and process improvements by the use of new technologies have
                      resulted in transport exceeding industry’s energy consumption [7]. The energy demand
                      for extraction, supply and distribution of water, as well as water treatments in the urban
                      sector implies a large amount of energy requirements [8]. This energy is partly wasted,
                      as overpressure and leakages are generated in specific locations of the water distribution
                      networks [9,10]. Energy recovery through micro-hydropower (MHP) not only addresses
                      the reduction of energy consumption in water distribution networks, as it also explores
                      the improvement of efficiency and sustainability in the water industry [1,11]. For that
                      reason, the study of the potential of energy recovery using MHP in water distribution
                      networks [12–14], break pressure tanks [15], or at the end of the network of a wastewater
                      treatment plant (WWTP) [16,17], has been already addressed in several works. In the case
                      of Gallagher et al. [13], the developed methodology was focused on assessing the potential
                      energy recovery sites in the water and WWTP infrastructure in the UK and Ireland, show-
                      ing estimations of around 17.9 GWh per annum of potential energy generation with MHP.
                      The variability on the flow and, thus, on the turbine efficiency, has been explored to define
                      the applicability of this technology on a small scale in WWTPs [12]. MHP technology has
                      also already been applied to irrigation networks [18,19], assessing the potential for energy
                      recovery in the irrigation sector and carbon savings, which for the case of the Bembezar
                      Margen Izquierda Irrigation District (south Spain), it was estimated as 270.5 MWh and
                      108 t CO2 eq., respectively [20]. The use of Pumps As Turbines (PAT) has proven to be a
                      viable and cost-effective technical solution for this energy recovery practice in water distri-
                      bution networks [1,21], which has also increased the interest in this technology even for
                      developing countries [22]. Nevertheless, the optimal location and selection of the turbine
                      or PAT can significantly impact on the energy production and economic savings [23]. This
                      high interest on MHP and energy recovery, from the economic and environmental points of
                      view, is challenged by the difficulty of creating a universal methodology applicable to any
                      area and country to assess its potential impact. Bousquet et al. [24] assessed the potential for
                      energy recovery using MHP turbines across all municipal WWTPs in Switzerland, finding
                      19 sites with a total MHP potential for energy production of 9.3 GWh·year−1 . However
                      previous investigations have neglected to include in their assessment of this potential all
                      forms of wastewater discharges including private industrial WWTPs associated with, for
                      example, food processing or other water-intensive products.
                            The objective of this work was to investigate the research question—what is the
                      potential for hydraulic energy recovery in private water-intensive industrial discharges
                      using micro-hydropower? In order to evaluate this MHP energy recovery potential in Spain
                      including all wastewater discharges, both municipal and private industrial were assessed.
                      Assessing all discharge types enabled a comparison of their relative importance. This was
                      included in three broad categories of fish farms, municipal WWTPs, and other private
                      industrial sectors. Fish farms were separated from private industry as a sole category in
                      this case, as they represented a large share of industrial discharges in Spain. The established
                      methodology was focused on expanding the possibilities of MHP development for the
                      municipal and industrial wastewater sectors, evaluating the potential energy savings and
                      helping reduce their environmental impacts through the adoption of renewable energies.
                      This methodology was based on the available water volumes from the discharge licenses
                      to estimate the potential of energy generation by the installation of a micro-turbine or PAT.
                      The data were collected from the water authorities responsible for the water management
                      in the main river basin in the country.
Water 2021, 13, x FOR PEER REVIEW 3 of 14
Water 2021, 13, 691 3 of 14
2. Methodology
2. Methodology
2.1. Study Area
2.1. Study Area
The study area was focused on the main seven river basins in Spain (Figure 1) for
The study area was focused on the main seven river basins in Spain (Figure 1) for
which the information about the water discharge licenses was publicly available. The
which the information about the water2 discharge licenses was publicly available. The
study covered a total area of 394,571 km ,2 representing 78% of the country total area and
study covered a total area of 394,571 km , representing 78% of the country total area and
80% of the peninsular Spanish area. The sum of the annual discharge volumes reaches
80% of the peninsular Spanish area. The sum of the annual discharge volumes reaches
around
around4976
4976HmHm,3which
3
, whichcorrespond
correspondtoto16,778
16,778different
differentdischarge
dischargelicenses.
licenses.Most
Mostdischarge
discharge
licenses
licensescould
couldbebeclassified
classifiedinto three
into general
three groups,
general depending
groups, dependingon the
on provenance
the provenanceof the
of
effluent, corresponding to WWTPs, industry and fish farms. Within industry,
the effluent, corresponding to WWTPs, industry and fish farms. Within industry, some some fur-
ther subgroups
further subgroupswere then
were distinguished,
then which
distinguished, will
which bebe
will specified
specifiedlater.
later.These
Theseriver
riverbasins
basins
included
included Duero, Ebro, Tajo, Jucar, Guadiana, Guadalquivir and Segura rivers,for
Duero, Ebro, Tajo, Jucar, Guadiana, Guadalquivir and Segura rivers, forwhich
which
the
thetotal
totalarea,
area,population,
population,totaltotalauthorized
authorizeddischarge
dischargevolume
volumeandandnumber
numberof oflicenses
licensesare
are
summarized
summarizedininTableTable1.1.
Areacorresponding
Figure1.1.Area
Figure correspondingtotothe
theriver
riverbasins
basinsanalysed
analysedininSpain
Spainfor
forthe
theestimation
estimationofofthe
theenergy
energy
recoverypotential
recovery potential with
with micro-hydropower
micro-hydropower (MHP)
(MHP)ininwastewater
wastewatertreatment
treatment plants (WWTPs),
plants (WWTPs), industry
in-
dustry and
and fish fish farms.
farms.
Table
Table1.1.Total
Totalarea,
area,population,
population,authorized
authorizeddischarge
dischargevolume
volumeand
andnumber
numberof
ofdischarge
dischargelicenses
licenses for
for the different river basins are analysed.
the different river basins are analysed.
River Basin Area (km2) Population (×106) Authorised Volume (Hm3) Total Licenses
Area Population Authorised Volume
River
DueroBasin 78,458 2.2(×106 ) 861 Total5816
Licenses
(km2 ) (Hm3 )
Ebro
Duero 85,534
78,458 3.2 2.2 1268
861 4283
5816
Tajo
Ebro 55,781
85,534 7.9 3.2 1755
1268 1844
4283
Jucar
Tajo 42,735
55,781 5.0 7.9 345
1755 1949
1844
Jucar
Guadiana 42,735
55,513 1.5 5.0 105345 1949
565
Guadiana 55,513 1.5 105 565
Guadalquivir 57,525 4.1 562 1637
Guadalquivir 57,525 4.1 562 1637
Segura
Segura 19,025
19,025 2.0 2.0 8181 684
684
2.2.
2.2.Potential
PotentialEnergy
EnergyRecovery
RecoverySites
SitesDatabase
Database
Due
Due to no detailed data beingavailable
to no detailed data being availableabout
aboutdischarge
dischargeflows
flowsfrom
fromindustrial
industrialwater
water
users
usersinin the different river
the different riverbasins,
basins,the
theinformation
information corresponding
corresponding to their
to their discharge
discharge li-
license,
cense, from the public domain, was considered the most accurate way to assess
from the public domain, was considered the most accurate way to assess the MHP energy the MHP
energy
recoveryrecovery potential
potential on a broad
on a broad level. level. The discharge
The discharge licenses
licenses included
included the the
namename of
of the
the factory/user, the maximum authorised annual discharge volume and
factory/user, the maximum authorised annual discharge volume and the discharge outfall the discharge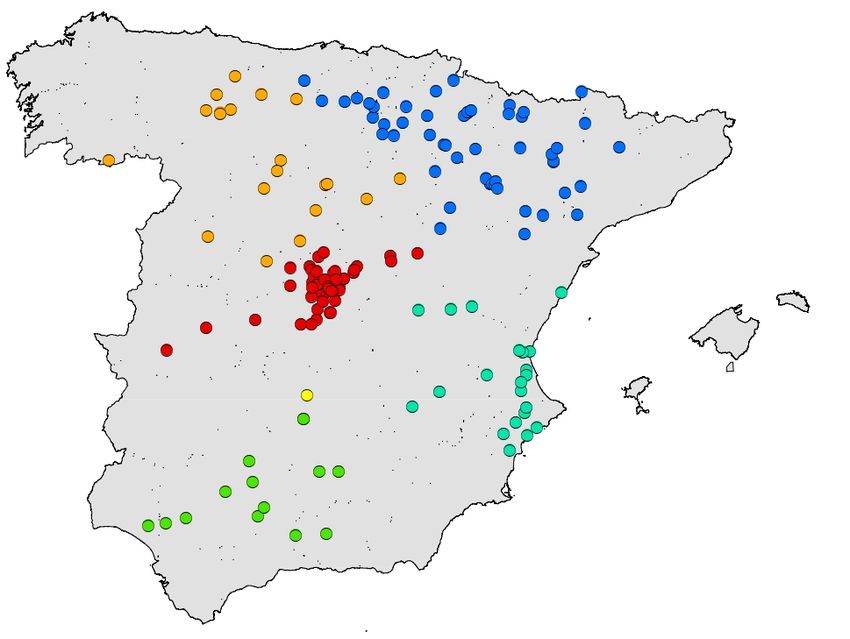
Water
Water 13,13,
2021,
2021, 691 PEER REVIEW
x FOR 4 of4 of
1414
outfall location
location (UTM-Universal
(UTM-Universal Transverse
Transverse Mercator
Mercator coordinates)
coordinates) (Figure(Figure 2). From
2). From the
the UTM
UTM coordinates, it was possible to determine the elevation for the
coordinates, it was possible to determine the elevation for the discharge points, using discharge points, us-
ing digital
digital elevation
elevation models,
models, while
while forfor
thethe point
point of generation/exit
of generation/exit of the
of the effluent,
effluent, the the ele-
elevation
vation was obtained
was also also obtained fromfrom digitaldigital elevation
elevation modelsmodels corresponding
corresponding to the
to the location
location of
of each
each factory,
factory, fishfish
farm farm or WWTP.
or WWTP. ThisThisworkwork
had had
to betoconducted
be conductedon aon a case-by-case
case-by-case basisbasis
as no
asinformation
no information aboutabout
the the geographic
geographic location
location of the
of the factory/WWTP/fish
factory/WWTP/fish farm
farm was
was avail-
available
able on the water discharge licenses databases. Once both elevations
on the water discharge licenses databases. Once both elevations were known, the available were known, the
available
dynamic dynamic
height (H height (Havadetermined
ava ) was ) was determined as the difference
as the difference between between
them. To them. Toout
carry carry
this
out this analysis
analysis in an effective
in an effective and time-efficient
and time-efficient manner,
manner, a sub-selection
a sub-selection of total
of the the total num-of
number
ber of discharge
discharge authorisations
authorisations (16,778)(16,778)
in thein the database
database was set.was set. Conducting
Conducting the headtheassessment
head as-
sessment for all 16,788
for all 16,788 dischargedischarge
licenses licenses on a case-by-case
on a case-by-case basisbasis
would would
havehavebeenbeen exces-
excessively
sively laborious. In addition, this was deemed unnecessary as the flow rates correspond-to
laborious. In addition, this was deemed unnecessary as the flow rates corresponding
some
ing of theofdischarge
to some licenses
the discharge were found
licenses to be too
were found small
to be tootosmall
haveto significant MHP potential,
have significant MHP
considering
potential, the likelythe
considering head drops
likely headavailable.
drops available.
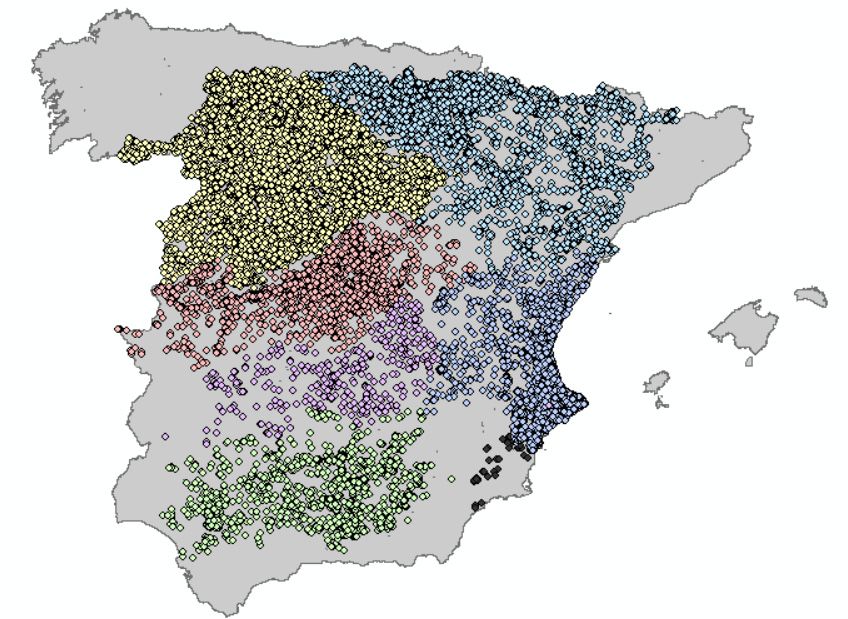
Figure 2. 2.
Figure Water discharge
Water points
discharge location
points from
location the
from licenses
the inin
licenses the selected
the river
selected basins
river basinsininSpain.
Spain.
TheThe sitepre-selection
site pre-selectionwaswasmade
madeby by establishing
establishing 2 kW kW asasminimum
minimumeconomically
economicallyviablevi-
power for an energy recovery installation
able power for an energy recovery installation using MHP using MHP in these setting. This minimum
setting. This minimum
power
power wasbased
was basedononprevious
previousstudies,
studies,whichwhichindicated
indicatedthatthatsmaller
smallerturbine
turbinesizes
sizeswere
were
found
found toto
bebe unprofitable
unprofitable [25].
[25]. Thus,
Thus, from
from thethe individual
individual annual
annual water
water dischargevolume
discharge volume
from licences, days·year −1 and
from licences, thethe annual
annual average
average flowflow
was was estimated,
estimated, assuming
assuming 365365
days∙year −1 and 24
24 h−1·day − 1 of operation, as the most pessimistic
h∙day of operation, as the most pessimistic scenarioscenario
from thefrompointthe pointofofthe
of view view of the
volume
volume distribution
distribution in availablein available
flow. flow.values
Once flow Once were flow estimated,
values were theestimated,
minimum the minimum
required dy-
required dynamic height
namic height (Hmin) for a 2 kW-MHP (H min installation was determined, following Equationfollowing
) for a 2 kW-MHP installation was determined, (1):
Equation (1):
=P =∙ ρ· g∙ · Q∙· Hmin ·∙e0 (1)(1)
where
where P is
P the power,
is the power, setset
at 2atkW,
2 kW, ρ isρthe water
is the density
water (kg∙m
density (kg),·m
−3 g −is3 ),
theg gravity acceler-ac-
is the gravity
ation (m ∙s ),(m
2
celeration
−1 Q is
2 ·s the), flow
− 1 Q is (m
the ∙s
3 −1
flow ), H(mmin the
3 ·s minimum
− 1 ), Hmin therequired
minimum dynamic
required height (m) and
dynamic e0
height
the overall estimated efficiency for the installation. In this case, an
(m) and e0 the overall estimated efficiency for the installation. In this case, an average average value for the
efficiency
value forwas assumed was
the efficiency (0.60), based on
assumed previous
(0.60), based on works as a works
previous conservative estimate
as a conservative
[8,13,20].
estimate [8,13,20].
After
Afterthe HH
the min requirements calculations, only the set of cases whose Hmin was equal
min requirements calculations, only the set of cases whose Hmin was equal
oror
lower
lowerthan
than 1515 mm waswasselected
selected totolook
lookfor forthe
thesites
siteswith
withenergy
energyrecovery
recoverypotential
potentialfor
for
MHP.
MHP. This
This limit
limitvalue
value was set set
was as aas conservative
a conservative threshold afterafter
threshold it wasit found that very
was found thatfew
very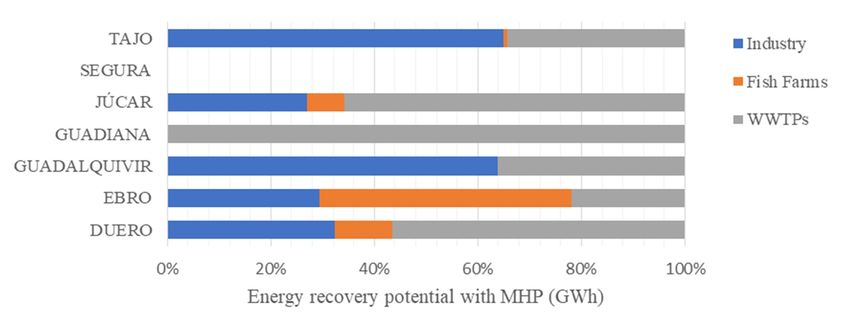
Water 2021,13,
Water2021, 13,691
x FOR PEER REVIEW 55 of
of 14
14
casescases
few met met
the requirement of having
the requirement a difference
of having in height
a difference between
in height the wastewater
between treat-
the wastewater
ment works
treatment and and
works the discharge pointpoint
the discharge higher thanthan
higher 10–12 m. m.
10–12
2.3.
2.3. Power
Power Estimations
Estimations andand Energy
Energy Recovery
Recovery Potential
Potential Assessment
Assessment
Once
Once the possible sites were identified and selected,their
the possible sites were identified and selected, theirHHmin values were
min values were compared
compared
with
with the
the corresponding
correspondingavailable
availabledynamic
dynamicheight
height(H(Hava ) for each particular site, measured
ava) for each particular site, measured
using
using digital
digital elevation
elevation models.
models. Those
Those sites
sites in
inwhich
whichHHava was equal or higher than Hmin
ava was equal or higher than H min
conformed
conformed to the group of sites with MHP potential. The power potential
to the group of sites with MHP potential. The power potential was
was calculated
calculated
using
using Equation
Equation (1),
(1), considering
considering again
again an
an overall
overall efficiency
efficiencyforforthe
the installation
installationofof0.60.
0.60. After
After
the power estimations, the potential annual energy recovery for the
the power estimations, the potential annual energy recovery for the different sitesdifferent sites was then
was
calculated. In this case, annual average flowsflows
were considered, and 365 days ·year −1 and
then calculated. In this case, annual average were considered, and 365
−1 were fixed again as the working time for factories, WWTPs and fish farms, as a
days∙year −1
24 h · day
and 24 h∙day were fixed again as the working time for factories, WWTPs and fish farms,
−1
conservative hypothesis.
as a conservative hypothesis.
A schematic representation of the main steps of all the process is defined in Figure 3.
A schematic representation of the main steps of all the process is defined in Figure 3.
Figure 3.
Figure 3. Schematic
Schematic representation
representation of
of the
the process
process stablished
stablished to
to determine
determine the
the energy
energy recovery
recovery potential
potential with
with MHP
MHP from
from
discharge licenses data.
discharge licenses data.
2.4. Economical and Greenhouse Gas Emissions Savings Projection
2.4. Economical and Greenhouse Gas Emissions Savings Projection
After identifying the possible sites with energy recovery potential with MHP, as well
After identifying the possible sites with energy recovery potential with MHP, as well
as estimating the power and energy that would be generated at these sites, a comparison
as estimating the power and energy that would be generated at these sites, a comparison
between this energy production and the total energy consumed at a country scale was
between this energy production and the total energy consumed at a country scale was made.
made. Then, the corresponding economic savings, considering an average price for elec-
Then, the corresponding economic savings, considering an average price for electricity from
tricity from the grid in Spain, was also estimated. Likewise, the positive impact on the
the grid in Spain, was also estimated. Likewise, the positive impact on the environmental
environmental aspects that the use of this recovered energy would generate was also eval-
aspects that the use of this recovered energy would generate was also evaluated. This
uated. This was made by estimating the amount of greenhouse gas emissions corresponding
was made by estimating the amount of greenhouse gas emissions corresponding to the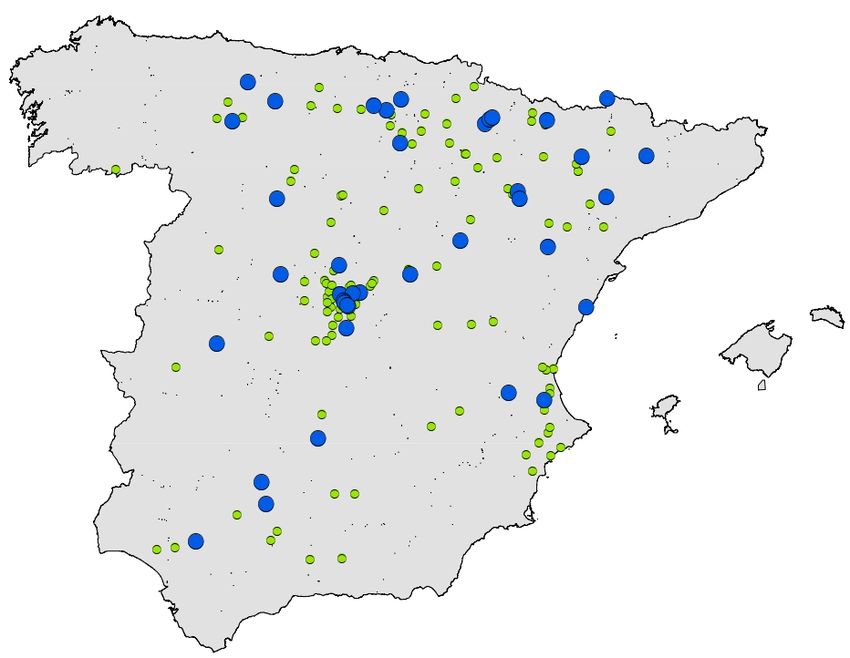
Water 2021, 13, 691                                                                                               6 of 14

                      total potential energy generated with MHP. For this purpose, an average ratio for Spain of
                      equivalent CO2 emissions per unit of electricity consumed was used.

                      2.5. Sensitivity Analysis
                           Once the evaluation of the potential for energy recovery with MHP in Spain was
                      completed, under the previously established criteria, a complementary analysis was carried
                      out. This complementary analysis considered a daily operating time of 12 h, instead of 24 h.
                      This new criterion would theoretically increase the number of potential sites, as the same
                      water discharge volume is distributed over a shorter operating time, providing a higher
                      flow and therefore, a higher MHP potential.

                      3. Results and Discussion
                      3.1. Potential Energy Recovery Sites Database
                            The initial database included a total of 16,778 discharge licenses, corresponding to
                      the seven river basins analysed, for which the individual area was previously detailed in
                      Table 2. From this total, sites which required less than 15 m as difference in height, between
                      the discharge point and the effluent emission point to produce a potential 2 kW MHP
                      installation, were listed in the so-called ‘test set’, making up a total of 471 sites. Those
                      sites presented annual discharge volumes in the range 0.62 to 210 Hm3 , which represents
                      flow values between 0.02 and 24 m3 ·s−1 . Under these established restrictions, no potential
                      sites were found for the Segura River basin, for which Hmin values were too high due
                      to low annual volumes, so the total of 471 sites of the test set belonged to the remaining
                      river basins, with the following distribution—16% Duero, 28% Ebro, 13% Guadalquivir,
                      3% Guadiana, 15% Jucar, and 25% Tajo. The representation of the three main categories
                      in this test set was 18%, 9% and 73% for industry, fish farms and Municipal WWTPs,
                      respectively. Nevertheless, while the number of sites for the Municipal WWTPs group
                      showed a significative majority, in terms of annual discharge volumes, the distribution
                      between the categories did not show the same differences, with 30–31% of the total volume
                      for both industry and fish farms and 39% for Municipal WWTPs. In this way, the Tajo and
                      Ebro river basins represented more than half of the total annual discharge volume, with 39%
                      and 27%, respectively. However, when studying the population corresponding to each of
                      the basins, it was observed that although the Tajo river basin is one of the most populated,
                      with 7.9 M people, this does not apply to the Ebro basin. Thus, while Tajo presented 98
                      possible sites in the Municipal WWTPs group and 19 for the industry category, the Ebro
                      reduced the Municipal WWTPs to 77 but doubled the possible sites for industry. These
                      figures show that a priori, an important contribution to the energy recovery potential at a
                      river basin level could come not only from the WWTPs, but also from the industry sector.

                      Table 2. Distribution of the number of sites with potential for MHP in the different river basins
                      and categories.

                                                                                              Corresponding Volume
                                       Basin Total     Industry       Fish Farms   WWTP
                                                                                                      (Hm3 )
                         Duero              20              6             5           9                  164
                          Ebro              52             19            14           19                 937
                       Guadalquivir         14              4             0           10                 298
                        Guadiana            1               0             0            1                  6
                          Jucar             21             1              3           17                 173
                         Segura             0               0             0            0                  0
                           Tajo             46             5              2           39                1562
                          Total            154             35            24           95                3139

                           After the analysis of the ‘test set’, in 154 (Figure 4) of the sites, a Hava higher than that
                      required for a 2-KW MHP installation was found. These sites with potential presented the
                      Hmin required with maximum values ranging between 5 and 13 m, so no cases were found
Water 2021, 13, 691 7 of 14
where Hava was higher than these values in the study area. This also means that generally
the available difference in height is relatively small, so there are few cases where small flows
result in exploitable power, as only the potential energy is being considered. From these
154 sites with MHP potential, more than half (62%) corresponded to Municipal WWTPs.
This time, the distribution among the different river basins showed Ebro as the one with
more sites, accounting for a total of 52 (34% of the total sites with potential), despite not
being one of the basins with the largest population but with a larger total area, with the
highest number of industries and fish farms with MHP potential. Behind the Ebro basin,
Water 2021, 13, x FOR PEER REVIEW 7 of 14
the Tajo river basin, with 30% of the sites, among which the contribution of WWTPs stands
out, as expected, was the basin with the largest population of the set. The rest of sites were
distributed between the Jucar, Duero, Guadalquivir and Guadiana river basin areas, with
different
14%, 13%,categories
9% and 1%,for which MHP
respectively. Thepotential was above
distribution of sites2between
kW wasthe
founded and
different summa-
categories
rized in Table 2.
for which MHP potential was above 2 kW was founded and summarized in Table 2.
Figure 4. Sites
Figure 4. Sites with
with energy
energy recovery
recovery potential
potential for
for MHP
MHPin
inthe
the77rivers
riversbasins
basinsanalysed
analysedin
inSpain.
Spain.
Regarding the discharge volumes of the sites with potential for MHP, again the Tajo
Table 2. Distribution of the number of sites with potential for MHP in the different river basins
and Ebro river basins showed the highest values, although this time, the Tajo river basin
and categories.
represented 50% compared with 30% for the Ebro, considering the total volume. These
figures show that although the Ebro river basin gathered more sites with potential, the
Basin Total Industry Fish Farms WWTP Corresponding Volume (Hm3)
available volume was 20% lower than in the case of the Tajo river basin.
Duero 20 6 5 9 164
3.1.1. Industry Potential Sites
Ebro 52 19 14 19 937
The industry category, which represented 18% of the test set, was divided into six
Guadalquivir 14 4 0 10 298
subgroups, based on the activity—agri-food; energy; minerals, metals and construction;
Guadiana 1 0 0 1 6
paper; chemicals; and others, in which the minority categories were included (such as
Jucar 21 1 3 17 173
discharges licenses attributed to tunnels or hotels isolated from the sewage network). Thus,
withinSegura 0
the industry group, the 0energy-related
0 0
industry was the largest0subgroup, with
Tajo
26 sites, followed by46the subgroup 5 minerals, 2 metals39and construction,1562 with 16 sites and,
matched in number (12 sites), the agri-food industry95
Total 154 35 24 3139
and the subgroup “others”. From the
‘test set’, a total of 35 industries showed any MHP potential above 2 kW, representing 23%
of theRegarding the discharge
total identified volumes
sites with of the
potential. sites
The with
Ebro potential
river for MHP,
basin was again
the area withthemore
Tajo
and Ebro river
industries with basins showed
potential, the highest
accounting a total values, although
of 19 sites (54% this time, the with
of industries Tajo river basin
potential),
represented
followed 50%Duero
by the compared with
with six and30%
Tajofor thefive.
with Ebro, considering the total volume. These
figures show that although the Ebro river basin gathered more sites with potential, the
available volume was 20% lower than in the case of the Tajo river basin.
3.1.1. Industry Potential Sites
The industry category, which represented 18% of the test set, was divided into six
subgroups, based on the activity—agri-food; energy; minerals, metals and construction;Water 2021, 13, 691 8 of 14
3.1.2. Fish Farms Potential Sites
Fish farms represented 9% of the initial ‘test set’. Their representation in the different
river basins showed a prevalence in the Duero and Ebro basins, covering the northern part
of the country, with 74% of the listed fish farms. These were not present in any of the cases
of the Guadiana and Segura river basins that met the head and power conditions imposed.
Related to the sites with power potential higher than 2 kW, a total of 24 fish farms with
potential were found, principally located in the Ebro river basin, with 14 being in this area.
3.1.3. Municipal WWTPs Potential Sites
The Municipal WWTPs were the type of facility that had the greatest presence in the
471 listed sites for the evaluation of energy recovery potential for MHP, representing 73%
of the total identified sites. WWTP was also the type of facility which presented more sites
with potential for all river basins except in the case of the Ebro river, in which both WWTPs
and industry presented the same quantity (19 sites). At the country level, WWTPs showed
the most numerous group, with 95 sites, representing more than 62% of the total sites with
MHP potential.
3.2. Power Estimations and Energy Recovery Potential Assessment
The power and energy potential estimations were calculated assuming an average
annual flow for all facilities, based on the annual discharge volume detailed in the cor-
responding discharge licenses, and considering an overall efficiency of 0.6 for the MHP
installation. The total power potential was estimated as 3.31 MW, for which 50.6%, 13.8%
and 35.6% corresponded to the industry, fish farms and Municipal WWTPs, respectively.
From the total 154 sites with power potential for MHP above 2 kW, 39 sites exceeded 15
kW of power (13 in industry sector, eight fish farms and 18 Municipal WWTPs) (Figure 5).
The distribution and percentages for areas and categories followed the same pattern for
the potential energy production, due to the fact that the same working time was assumed
2021, 13, x FOR PEER REVIEW
for all facilities. The total energy generation reached 29 GWh·year−1 , from which 80% cor-
9 of 14
responded to sites with power potential over 15 kW. The percentage breakdown of energy
potential generation for the different categories in each river basin is detailed in Figure 6.
Power potential ≥ 15 kW
Power potential < 15 kW
Figure 5. Geographic distributiondistribution
Figure 5. Geographic of sites withofpotential
sites withuppotential
to and above
up to 15
andkW for the
above different
15 kW river
for the basins in Spain.
different
river basins in Spain.Power potential < 15 kW
Power potential ≥ 15 kW
Water 2021, 13,Figure
691 5. Geographic distribution of sites with potential up to and above 15 kW forPower
the different 9 of 14
potential < 15 kW
river basins in Spain.
Figure 5. Geographic distribution of sites with potential up to and above 15 kW for the different
river basins in Spain.
Figure 6. Percentage distribution of the potential energy generation with MHP in the different sectors for the seven river
basins Figure 6. Percentage distribution of the potential energy generation with MHP in the different
analysed.
sectors for the seven river basins analysed.
Figure
Figure 7 summarizes
6. Percentage the sites,
distribution of thepower and
potential energy
energy potential
generation estimations
with and
MHP in the its distri-
different
bution
sectors between sectors.
for the seven river basins analysed.
Figure 7. Synthesis of the results obtained in terms of number of sites with MHP potential, and
Figure7.7. Synthesis
Figure
power and energy estimations Synthesis of the
for theof
the results
results obtained
different
obtainedininterms
sectors.
termsofofnumber
numberofof sites
sites with
with MHP
MHP potential,
potential, andand
power
powerand
andenergy
energyestimations
estimationsfor
forthe
thedifferent
differentsectors.
sectors.
As shown in Figure 7, although industries presented a lower number of sites with
MHP potential compared to the WWTPs, the higher volume of water per site resulted
in a higher potential in terms of energy generation, and a higher productivity. Thus, the
highest ratio of energy production per site corresponded to the private industry, more
than two and almost three times higher than the ratio obtained for the fish farms and the
WWTPs, respectively.
3.2.1. Industry Energy Recovery Potential
In a general overview, most of the industries presented restrictions for MHP pro-
duction due to low flow values. The highest contribution in the industry group, which
represented 1.7 MW of power potential for MHP, corresponded to the energy-related in-
dustries, amounting to 45% of the total power potential for Spain. From this 45%, 70%
(equal to 1492 kW) came from the Tajo river basin, with two nuclear power plants. After
energy-related industries, the following subgroup within the industry category was the
paper industry, which contributed with 70.7 kW of power, most of these coming from the
Ebro river basin. Thus, the industry sector represented an annual energy recovery potential
of 14.7 GWh, which was half of the total. Table 3 shows the breakdown for the energy
recovery contribution of the different subgroups of industries in the river basins analysed.Water 2021, 13, 691 10 of 14
Table 3. Annual energy recovery potential in MWh for the different industry sub-groups and river
basins analysed in Spain.
Minerals, Metals
Agri-Food Energy Paper Chemicals Others
and Construction
Duero 36.98 816.21 28.11 56.41 33.39 -
Ebro - 866.34 333.08 536.06 357.11 -
Guadalquivir - 1811.31 - 27.21 18.89 -
Guadiana - - - - - -
Júcar - 394.29 - - - -
Segura - - - - - -
Tajo 32.16 9182.48 - - 151.35 -
Total 69.14 13,070.62 361.19 619.68 560.74 -
Although the literature review has shown, in general terms, that the energy recovery
potential through MHP has been rarely addressed in the industry sector, these results
point to a positive contribution to the clean energy generation by MHP, especially in some
specific industries such as the energy production-related ones.
3.2.2. Fish Farms Energy Recovery Potential
Fish farms presented a total power potential estimation of 0.46 MW, representing
14% of the total power potential. As it was previously detailed in Section 3.1.2, from the
42 possible fish farms included in the ‘test set’, only 24 of them resulted in any potential for
MHP. In many cases, the proximity of the installation to the riverbed made the availability
of head too low, even though the flow conditions would allow, given its continuity and
volume, to install a PAT or other micro-turbine. Most of the power potential found
corresponded to the Ebro river basin, which accounted for 87% of the power potential
estimated for this category. Table 4 presents the distribution of the annual energy potential
estimated for the fish farm sector in the different river basins and its associated water
volume, including the ratio between them. This ratio shows the difference between river
basins in the conversion of water volume into energy due to the head available in the
different sites. Thus, the Ebro river basin showed the highest value for this ratio, with
0.028 GWh Hm−3 while the Tajo river presented the lowest value, with 0.0005 GWh Hm−3 .
Table 4. Energy potential for MHP and the corresponding annual volume of water breakdown for
the fish farm sector in the different river basins.
Energy (GWh) Volume (Hm3 ) Energy/Volumen Ratio
Duero 0.3 46 0.0065
Ebro 3.5 125 0.0280
Guadalquivir - - -
Guadiana - - -
Jucar 0.1 63 0.0015
Segura - - -
Tajo 0.1 192 0.0005
Total/mean 4.0 426 0.0094
This analysis of the fish farms points to a generalized lack of a head drop in many
cases, which hinders the exploitation of the MHP potential of the effluent flow. Even
though no previous studies focusing on the MHP potential assessment in fish farms have
been found, the potential of this technology in rivers has been previously addressed. Thus,
one of the highlighted challenges in such off-grid cases is that the use of the recovered
energy should be placed in the vicinity of the MHP plant, as its transport to other locations
would require important investments in infrastructure [26].Water 2021, 13, 691 11 of 14
3.2.3. Municipal WWTPs Energy Recovery Potential
In the case of the Municipal WWTPs, the total power potential amounted to 1.2 MW.
The Tajo river basin was the area with the highest contribution, representing 0.6 MW,
followed by the Duero, with 0.2 MW of power potential. In this case, the higher power
potential related to the Municipal WWTP in the Tajo basin could be associated with
the higher population, which amounted to 7.88 M people, representing 30% of the total
population associated with the seven river basins. In terms of energy, the total potential
was estimated at 10.35 GWh·year−1 , and its distribution between river basins and the
corresponding discharge volume are summarized in Table 5.
Table 5. Energy potential for MHP and the corresponding annual volume of water and population
breakdown for the WWTP sector in the different river basins.
Energy/Population Ratio
Energy (GWh) Volume (Hm3 )
(GWh Per Person and Year)
Duero 1.7 30 0.77
Ebro 1.6 54 0.49
Guadalquivir 1.1 77 0.26
Guadiana 0.12 6 0.08
Jucar 1.0 95 0.19
Segura - - -
Tajo 4.9 579 0.63
Total 10.4 842 0.40
The ratio between the energy potential and total population of the river basin showed
the differences between the six river basins for which any potential was found, as previously
suggested by Bousquet et al. [24]. The Duero river basin showed the highest value, with
0.77 kWh of energy per person, against the 0.08 obtained for Guadiana basin, which
presented the lowest value, the average for the country being 0.40. These differences were
due to several factors, such as the covered area and population, which conditioned the
number of WWTPs and corresponding wastewater volumes, or the topography. In this
way, the Duero basin presented initially 5816 licenses and 861 Hm3 against 565 licenses
and 105 Hm3 of the Guadiana basin.
3.3. Economical and Greenhouse Gas Emissions Savings Projection
Considering the total energy recovery potential for MHP estimated for the seven river
basins in Spain, the sum for the three sectors reached an annual total of 29 GWh. Assuming
an average conversion factor of 0.357 kg CO2 eq. per kWh of electricity coming from the
electricity grid in Spain [7], the estimated total energy production represented a saving of
around 11,353 tonnes CO2 eq. Moreover, in economic terms, the potential energy generated
by MHP in the industry, Municipal WWTPs and fish farms would represent an annual
reduction between M€ 2.11 and M€ 4.24, for an average cost of electricity in peak and
valley periods.
3.4. Sensitivity Analysis
Once the total MHP energy generation potential in Spain was assessed, the possible
variation in results when considering a shorter operating time of the facilities was evaluated.
Thus, the assessment of the possible sites with MHP potential under a 12 h-day operating
pattern was carried out for the total of discharge licenses included in the initial database.
The new criteria doubled the power to be installed in those sites that already showed any
MHP potential in the first assessment, as the flow rate is doubled. This higher power,
combined with the 50% reduction in the operating time, resulted in the annual potential
for energy generation remaining unchanged. However, the 12-h working assumption
included 348 new discharge licenses to be analysed, increasing the initial test set by 74%.
From those, only 21 sites showed any potential for MHP higher than 2 kW, as the restWater 2021, 13, 691 12 of 14
did not have the required difference in height. The WWTPs and industries related with
the energy production represented 14 and one of these sites, respectively. In both cases,
a 12-h operating regime was considered less realistic than 24-h working time, so finally,
only six new sites (five from the agri-food sector and one from the construction sector)
were included in the final calculations. The inclusion of these six industries supposed an
increase of 22 kW of power, equal to an annual energy generation potential of 98 MWh,
which represented only a 0.3% increase.
4. Conclusions
An assessment of the power and energy potential for MHP in the municipal wastewa-
ter, industry and fish farm sectors was addressed for the Spanish area, estimating a total
potential power between 3.31 and 3.54 MW and an annual energy recovery potential of
29 GWh. The operating time variation between 12 and 24 h in the private industry sector
did not represent significant changes in the total results, increasing the annual energy
potential generation by only 0.3%. Previous investigations of MHP potential in wastewater
systems have not included industrial treatment plants from water-intensive industry. Yet,
these have been shown to account for 50.9% of the total potential here, a finding which
could greatly influence MHP potential estimates across the world. It also identifies a signif-
icant new avenue for the exploitation of multipurpose MHP technology. Obviously, more
detailed information on the operating regime and flow rates of the analysed installations
would allow much more accurate results to be obtained.
The results here corresponded to the seven river basins analysed in Spain, which
included the Duero, Ebro, Guadalquivir, Guadiana, Jucar, Segura and Tajo rivers, covering
78% of the country total area and 80% of the peninsular Spanish area. The distribution
between river basins was irregular, showing either no or a very low potential for MHP
in basins such as the Segura and Guadiana, respectively. The estimated energy potential
represented a potential CO2 emission savings of around 11 thousand tonnes, which repre-
sented a reduction between M€ 2.11 and M€ 4.24 in the total energy consumption in the
country. These figures show only an approximation, since the available data corresponded
to maximum annual authorised discharge volumes, which was considered to be distributed
over the 365 days of the year, and 24/12 h of work per day. However, the possibility of
having access to flow records in real time or hourly, could facilitate a more detailed study
by sector, and even by type of industry. The analysis of this country-level data shows the
potential interest in the use of MHP technology for clean energy generation in the wastewa-
ter, industry and fish farm sectors, whose results and conclusions could be extrapolated to
other countries. The subsequent use of the energy produced would require the analysis of
the possibilities of usage at the point of generation, in some cases, or the injection into the
grid. The last one could present some difficulties in certain isolated areas, as it can be the
case of most of the fish farms. However, the robustness and low cost of the technology for
these small hydropower plants opens a way to reduce greenhouse gas emissions linked to
electricity production as well as to improve energy efficiency in the sectors addressed. This
fact becomes even stronger when most of the estimated MHP potential is concentrated in
sites with more than 15 kW of power. This shows that a large part of this energy generation
potential, in this case 80%, could be exploited by installing MHP plants in a small number
of sites.
Of course, this work represents a preliminary assessment of the potential applicability
of MHP technology as an added-value resource to contribute to the transformation of
the industrial and wastewater sectors into more sustainable activities, at a country level.
Future research should be directed towards in-site detailed assessments in the different
sectors, which could help to understand the advantages and drawbacks linked to MHP
energy recovery in each specific industrial sector.
Author Contributions: Conceptualization, J.A.R.D., J.G.M. and A.M.; methodology, A.M.G. and
A.M.; formal analysis, A.M.G. and A.M.; investigation, A.M.G. and A.M.; resources, A.M.G.; writing—Water 2021, 13, 691 13 of 14
original draft preparation, A.M.G.; writing—review and editing, J.A.R.D., J.G.M. and A.M.; supervi-
sion, A.M. All authors have read and agreed to the published version of the manuscript.
Funding: This research is part funded by the European Regional Development Fund (ERDF) through
the Interreg Atlantic Area Programme 2014–2020, as part of the REDAWN project (Reducing the
Energy Dependency in the Atlantic Area from Water Networks).
Institutional Review Board Statement: Not applicable.
Informed Consent Statement: Not applicable.
Data Availability Statement: Not applicable.
Conflicts of Interest: The authors declare no conflict of interest.
References
1. Morani, M.C.; Carravetta, A.; Del Giudice, G.; McNabola, A.; Fecarotta, O. A comparison of energy recovery by PATs against
direct variable speed pumping in water distribution networks. Fluids 2018, 3, 41. [CrossRef]
2. IEA. Global Energy & CO2 Status Report. 2019. Available online: https://www.iea.org (accessed on 10 September 2020).
3. Hoekstra, A.Y. The Water Footprint of Industry. In Assessing and Measuring Environmental Impact and Sustainability; Butterworth-
Heinemann: Oxford, UK, 2015; pp. 221–254. ISBN 9780128022337. [CrossRef]
4. UNESCO. Programa Mundial de Evaluación de los Recursos Hídricos (WWAP). Available online: http://www.unesco.org
(accessed on 27 February 2020).
5. Gerbens-Leenes, P.W.; Mekonnen, M.M.; Hoekstra, A.Y. The water footprint of poultry, pork and beef: A comparative study in
different countries and production systems. Water Resour. Ind. 2013, 1–2, 25–36. [CrossRef]
6. EEA. Final Energy Consumption by Sector and Fuel in Europe; Statistical Office of the European Union (Eurostat), European
Environment Agency: Copenhagen, Denmark, 2020; p. 20.
7. Ministerio de Industria, Energía y Turismo. Factores de Emisión de CO2 y Coeficientes de Paso a Energía Primaria de Diferentes Fuentes
de Energía Final Consumidas en el Sector de Edificios en España; Documento Reconocido del Reglamento de Instalaciones Térmicas en
los Edificios (RITE): Barcelona, Spain, 2016. [CrossRef]
8. McNabola, A.; Coughlan, P.; Corcoran, L.; Power, C.; Williams, A.P.; Harris, I.; Gallagher, J.; Styles, D. Energy recovery in the
water industry using micro-hydropower: An opportunity to improve sustainability. Water Policy 2014, 16, 168–183. [CrossRef]
9. Cabrera, E.; Pardo, M.A.; Cobacho, R.; Cabrera, E. Energy Audit of Water Networks. J. Water Resour. Plan. Manag. 2010, 136,
669–677. [CrossRef]
10. Ramos, H.M.; Mello, M.; De, P.K. Clean power in water supply systems as a sustainable solution: From planning to practical
implementation. Water Sci. Technol. Water Supply 2010, 10, 39–49. [CrossRef]
11. Filion, Y.R.; MacLean, H.L.; Karney, B.W. Life-Cycle Energy Analysis of a Water Distribution System. J. Infrastruct. Syst. 2004, 10,
120–130. [CrossRef]
12. Chae, K.J.; Kim, I.S.; Ren, X.; Cheon, K.H. Reliable energy recovery in an existing municipal wastewater treatment plant with a
flow-variable micro-hydropower system. Energy Convers. Manag. 2015, 101, 681–688. [CrossRef]
13. Gallagher, J.; Harris, I.M.; Packwood, A.J.; McNabola, A.; Williams, A.P. A strategic assessment of micro-hydropower in the UK
and Irish water industry: Identifying technical and economic constraints. Renew. Energy 2015, 81, 808–815. [CrossRef]
14. Corcoran, L.; McNabola, A.; Coughlan, P. Optimization of water distribution networks for combined hydropower energy recovery
and leakage reduction. J. Water Resour. Plan. Manag. 2016, 142, 1–8. [CrossRef]
15. McNabola, A.; Coughlan, P.; Williams, A.P. The technical & economic feasibility of energy recovery in water supply networks.
Renew. Energy Power Qual. J. 2011, 1, 1123–1127. [CrossRef]
16. Power, C.; McNabola, A.; Coughlan, P. Development of an evaluation method for hydropower energy recovery in wastewater
treatment plants: Case studies in Ireland and the UK. Sustain. Energy Technol. Assess. 2014, 7, 166–177. [CrossRef]
17. Griffin, F.M. Feasibility of energy recovery from a wastewater treatment scheme. Proc. Inst. Mech. Eng. Part A J. Power Energy
2000, 214, 41–51. [CrossRef]
18. Pérez-Sánchez, M.; Sánchez-Romero, F.J.; Ramos, H.M.; López-Jiménez, P.A. Optimization strategy for improving the energy
efficiency of irrigation systems by micro hydropower: Practical application. Water 2017, 9, 799. [CrossRef]
19. Crespo Chacón, M.; Rodriguez Díaz, J.A.; García Morillo, J.; McNabola, A. Pump-as-turbine selection methodology for energy
recovery in irrigation networks: Minimising the payback period. Water 2019, 11, 149. [CrossRef]
20. García Morillo, J.; McNabola, A.; Camacho, E.; Montesinos, P.; Rodríguez Díaz, J.A. Hydro-power energy recovery in pressurized
irrigation networks: A case study of an Irrigation District in the South of Spain. Agric. Water Manag. 2018, 204, 17–27. [CrossRef]
21. Fecarotta, O.; Ramos, H.M.; Derakhshan, S.; Del Giudice, G.; Carravetta, A. Fine Tuning a PAT Hydropower Plant in a Water
Supply Network to Improve System Effectiveness. J. Water Resour. Plan. Manag. 2018, 144, 04018038. [CrossRef]
22. Da Silva, B.L.A.; Lafay, J.M.S.; Tofoli, F.L.; Scartazzini, L.S. Case study: Hydroelectric generation employing the water distribution
network in Pato Branco, Brazil. Proc. IASTED Int. Conf. Power Energy Syst. Eur. 2011, 2011, 50–54. [CrossRef]Water 2021, 13, 691 14 of 14
23. Fecarotta, O.; McNabola, A. Optimal Location of Pump as Turbines (PATs) in Water Distribution Networks to Recover Energy
and Reduce Leakage. Water Resour. Manag. 2017, 31, 5043–5059. [CrossRef]
24. Bousquet, C.; Samora, I.; Manso, P.; Rossi, L.; Heller, P.; Schleiss, A.J. Assessment of hydropower potential in wastewater systems
and application to Switzerland. Renew. Energy 2017, 113, 64–73. [CrossRef]
25. Novara, D.; Carravetta, A.; McNabola, A.; Ramos, H.M. Cost Model for Pumps as Turbines in Run-of-River and In-Pipe
Microhydropower Applications. J. Water Resour. Plan. Manag. 2019, 145, 1–9. [CrossRef]
26. Fujii, M.; Tanabe, S.; Yamada, M.; Mishima, T.; Sawadate, T.; Ohsawa, S. Assessment of the potential for developing mini/micro
hydropower: A case study in Beppu City, Japan. J. Hydrol. Reg. Stud. 2017, 11, 107–116. [CrossRef]You can also read