Water and climate Francis Chiew and Ian Prosser - CSIRO Publishing
←
→
Page content transcription
If your browser does not render page correctly, please read the page content below
© CSIRO 2011. All rights reserved.
Chapter 3.                                    View complete contents

Water and climate
Francis Chiew and Ian Prosser

 Key messages
  ✽✽ Floods, droughts, and climate change are the three most important influences of climate on Australia’s
     water resources.

  ✽✽ Water resources are vulnerable to both climate variability and change; for example, runoff into
     Perth’s reservoirs has declined by 55% since the 1970s and the 1997 to 2009 drought resulted in
     unprecedented decline in runoff and water use in the southern Murray–Darling Basin.

  ✽✽ Climate change has played a part in recent reductions in rainfall and water resources, however its
     specific contribution is difficult to quantify.

  ✽✽ Climate change by 2030 is likely to reduce average river flows by 10% to 25% in some regions of
     southern Australia but further climate change could produce even more profound reductions of water
     resources in southern Australia.

  ✽✽ The relationships between climate and runoff are now being used to provide more accurate seasonal
     forecasts of water resources useful for irrigators, dam operators, and environmental managers.

Weather and climate are the primary influences on Australia’s water resources. Extreme storms
and cyclones produce floods that can rise and fall within hours or that can last for months, while
yearly variability in rainfall can produce droughts that may last for a decade or longer. Longer-
term climate change increases or decreases average rainfall and evaporation, fundamentally
changing the amount of water resources available. This chapter describes the influences of
climatic events, variability, and change on water resources through their influence on floods,
droughts, and water resources.
  ‘Weather’ is the brief, rapidly changing daily and seasonal conditions in the atmosphere, while
‘climate’ is the average weather experienced over years to decades. ‘Climate variability’ is the
year to year and decade to decade noise or variability around the average climate, while ‘climate
change’ is the longer term change in average conditions over several decades to centuries. The
noise of weather and climate variability can occur around a changing average climate, making it
difficult to detect long-term trends, especially for rainfall, which, in Australia, is highly variable
from year to year.

                                                                                                              29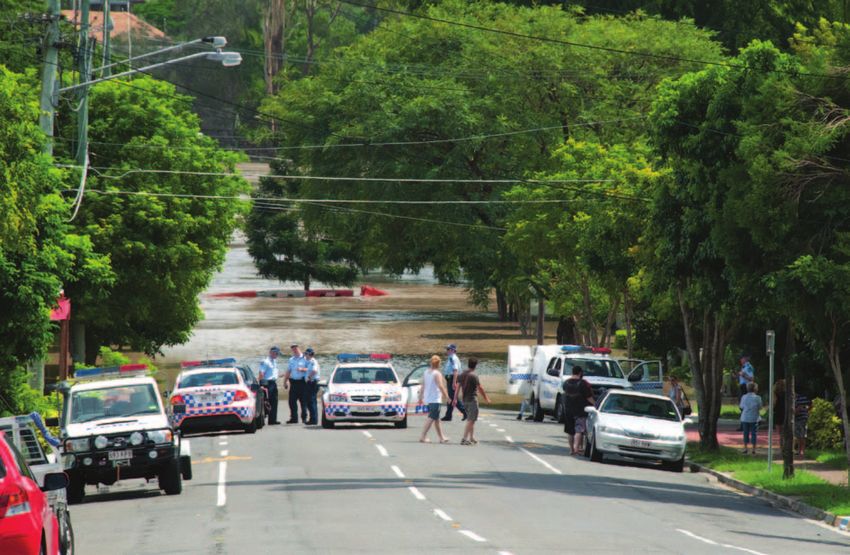
© CSIRO 2011. All rights reserved.
                                       View complete contents

     Yearly variations in rainfall, or changes between centuries are amplified as even greater changes
to runoff and river flows, making impacts on water resources one of the greatest concerns about
climate change. Annual variations in rainfall are typically amplified as two- to three-times larger
variations to annual runoff. So a 10% reduction in rainfall typically leads to a 20 to 30% reduction
in runoff.1 This amplification applies to climate change as well, so small reductions in average
rainfall as a result of climate change will lead to two- to three-times larger reductions in water
resources.

Weather and climate drivers
Floods, drought, and climate change are all driven by a number of processes in the atmosphere
and oceans (Figure 3.1), but the changes are driven at different timescales. The drivers shown in
Figure 3.1 interact with each other and influence different parts of the continent to bring local
weather and climate. The drivers include circulation patterns in the Pacific Ocean that bring El
Niño conditions associated with drought in eastern Australia and La Niña conditions that are
associated with floods. The Indian Ocean Dipole is a similar pattern in the Indian Ocean that
can bring drought to south-west and south-east Australia, and the Southern Annular Mode is a

                                                                           Figure 3.1: The major
                                                                             influences on rainfall
                                                                             (and thus runoff) in
                                                                             Australia.2 (Reproduced with
                                                                             permission from Australian
                                                                             Bureau of Meteorology. ©
                                                                             Commonwealth of Australia.)

30     Chapter 3.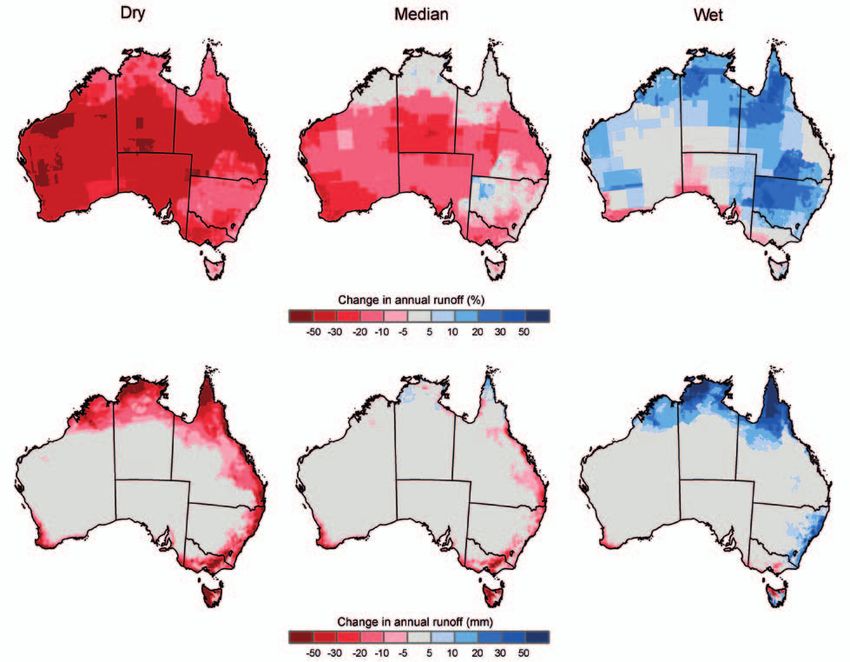
© CSIRO 2011. All rights reserved.
View complete contents
Rainfall decile ranges
Highest on
record
Very much
10 above average
8–9 Above average
4–7 Average
Figure 3.2: Rainfall
2–3 Below average
conditions across Australia
Very much
1
from 1 January 1997 to 31 below average
Lowest on
December 2009 relative to the record
1900–2009 climate, showing
the extreme dry conditions
across the south-east, the far
south-west of Australia, and
south-east Queensland.3
feature of the Southern Ocean that affects weather and climate in southern Australia. Atmospheric
patterns such as the monsoon winds and southern ocean frontal systems bring rain, whereas
southerly tracks of blocking highs and the subtropical ridge tend to bring dry weather.
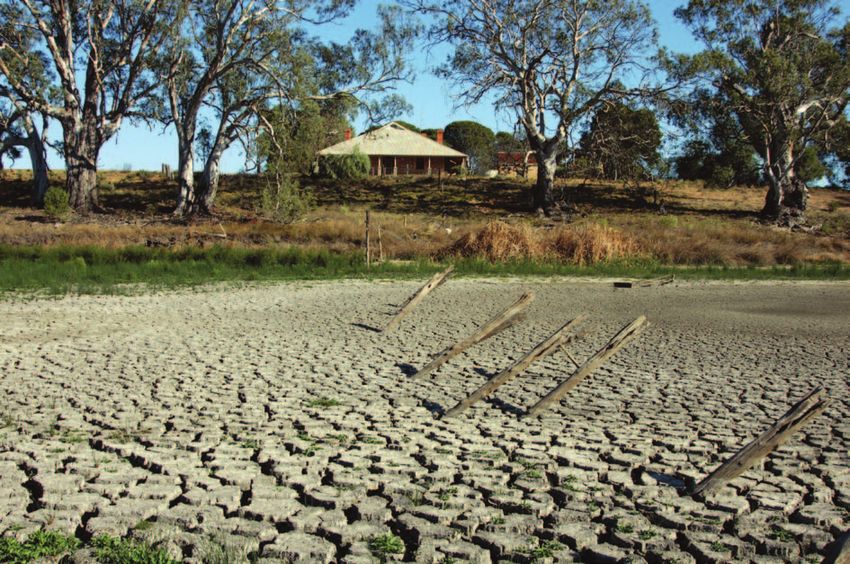
Recent drought in southern Australia
From 1997 to 2009, large areas of southern Australia, in particular the southern Murray–Darling
Basin, Victoria, south-west Australia, and South East Queensland experienced prolonged drought,
often referred to as the millennium drought (Figure 3.2, Figure 3.3).
The millennium drought in the southern Murray–Darling Basin was unprecedented in the 110
years of reliable rainfall records.4 It resulted in declining storage levels in reservoirs, several
years of severe water restrictions in cities, and years of low water allocations to irrigators in the
southern Murray–Darling Basin and elsewhere in Victoria. Water sharing arrangements for the
Murray, Murrumbidgee, and Lachlan Rivers were suspended because they were not designed for
such extreme conditions.
The drought had major environmental impacts.5 For example, the Lower Lakes of the Murray
River fell more than 1 m below previously record low levels, exposing potentially toxic acidic
sediments and increasing salinity in the lakes. Across the Murray–Darling Basin, there was either
extensive death or stress to river red gums on floodplains, and low river flows led to the isolation
of fish communities and a decline in fish breeding. Water use for irrigation fell by 64%6 and it was
the first time that drought had caused a major fall in use for an extended period (see Chapter 8).
Most of Australia’s water use is in southern Australia, so the drought had a substantial economic,
environmental, and social impact.
Water and climate 31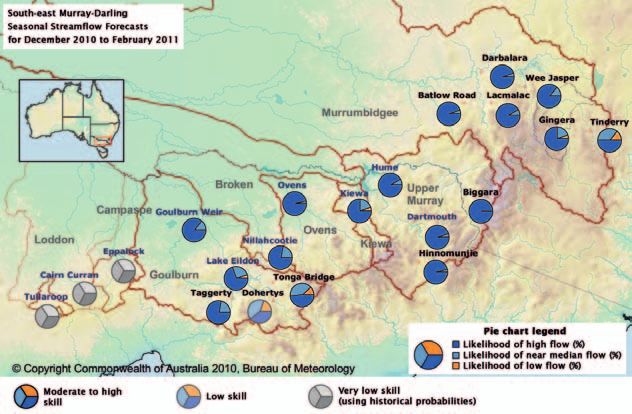
© CSIRO 2011. All rights reserved.
                                                                       View complete contents

                       35 000
                                                      Long-term average
                                                     8853 GL (total period)
                       30 000
                                Federation drought                                                             Millenium drought
                                     5115 GL                                                                        4454 GL
                       25 000
Annual Inflow (GL/y)

                                                                   World War II drought
                                                                        6140 GL
                       20 000

                       15 000

                       10 000

                        5000

                          1891/92      1906/07        1921/22       1936/37      1951/52   1966/67   1981/82       1996/97    2008/2009

                                                                                   Year
                       Figure 3.3: Annual total inflows into the Murray River showing the high year to year
                       and decade to decade variability and the low inflows from 1997 to 2009 and during
                       earlier droughts. (Data provided by the Murray–Darling Basin Authority.)

                       Figure 3.4: Percentage difference between recent (1997–2008) rainfall and runoff in south-
                       eastern Australia and the long-term (1895–2008) averages.8 Although rainfall in Victoria and
                       southern NSW was only 10–30% below average, runoff was 30–60% below average.

 32                     Chapter 3.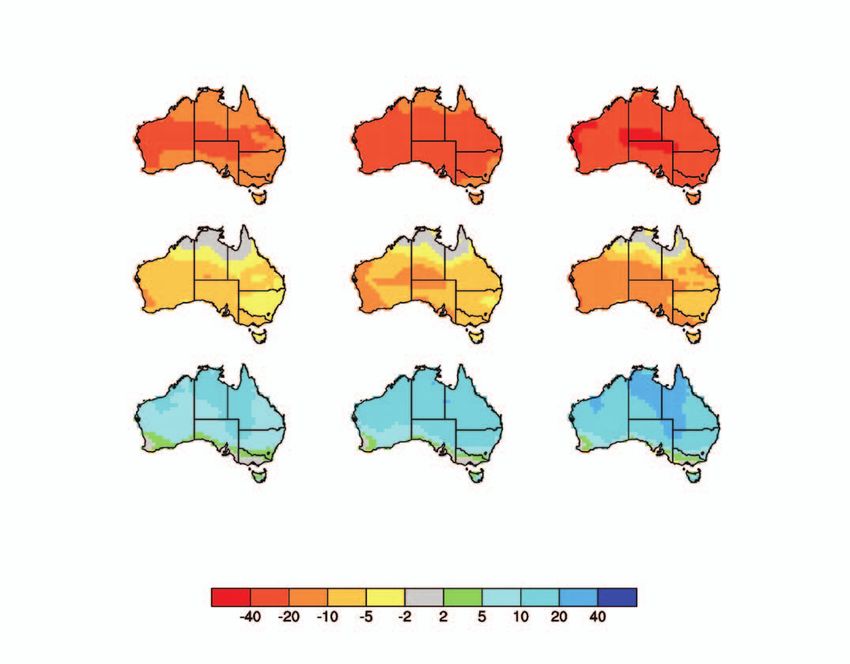
© CSIRO 2011. All rights reserved.
                                                                                                           View complete contents

Total annual runoff to Perth reservoirs (GL)

                                               1000
                                                900
                                                800
                                                700
                                                600
                                                500
                                                400
                                                300
                                                200
                                                100
                                                 0
                                                      1910

                                                                    1920

                                                                           1925

                                                                                  1930

                                                                                         1935

                                                                                                          1945

                                                                                                                 1950

                                                                                                                        1955

                                                                                                                               1960

                                                                                                                                      1965

                                                                                                                                             1970

                                                                                                                                                    1975

                                                                                                                                                           1980

                                                                                                                                                                  1985

                                                                                                                                                                         1990

                                                                                                                                                                                1995

                                                                                                                                                                                       2000

                                                                                                                                                                                              2005

                                                                                                                                                                                                     2010
                                                             1915

                                                                                                1940

                                                                                                                               Year

                                               Figure 3.5: Annual series of runoff into Perth reservoirs showing a persistent decline in inflows since the
                                               mid-1970s.10

                                               There had been earlier multi-year droughts in the southern Murray–Darling Basin such as the
Federation drought of 1895 to 1903 and the depression drought of the late 1930s and early 1940s
(Figure 3.3), but none were as severe in terms of reduced runoff as the millennium drought.
In places, runoff was less than half of the long-term average, even though average rainfall had
decreased by less than 20% (Figure 3.4).7 The amplification of change from rainfall to runoff was
greater than expected from previous droughts. Possible reasons include: a disproportionate
rainfall decline in autumn resulting in dry soil at the start of the runoff season; rainfall decline
in winter when most of the runoff occurs; the lack of any high rainfall years, which produce
disproportionately high runoff; and higher temperatures driving greater evaporation.3
                                               In the South West region of Western Australia, the very low rainfall from 1997 to 2009 has
been part of a longer 35-year trend of gradually declining rainfall.9 The average runoff to Perth
reservoirs was 338 GL/year before 1975 but from 1975 to 2009 it was only 181 GL/year, or 55%
lower than before, as a result of a 16% fall in average annual rainfall (Figure 3.5). The higher
runoff years are now nowhere near as high as previously (i.e. since 1975, no annual runoff to
Perth reservoirs was above the pre-1975 average). This persistently low runoff led the Western
Australian Government to secure additional water supplies for Perth, leading to a greater reliance
on groundwater and the opening of Australia’s first desalination plant for supply of water to major
city (see Chapter 7). Whether the change since the 1970s is a result of global warming or whether
it reflects long-term natural variation in climate is discussed below.
                                               The decline in rainfall around Perth has been attributed to changes in weather patterns across
south-west Australia (Figure 3.6). Since the 1970s, high pressure systems and associated cold
fronts have moved south bringing less rainfall than their previous more northerly track across
southern Australia.11 These changes most strongly affect autumn and winter rainfall and are the
same sort of changes predicted to intensify with increasing global temperatures in future.

                                                                                                                                                                         Water and climate           33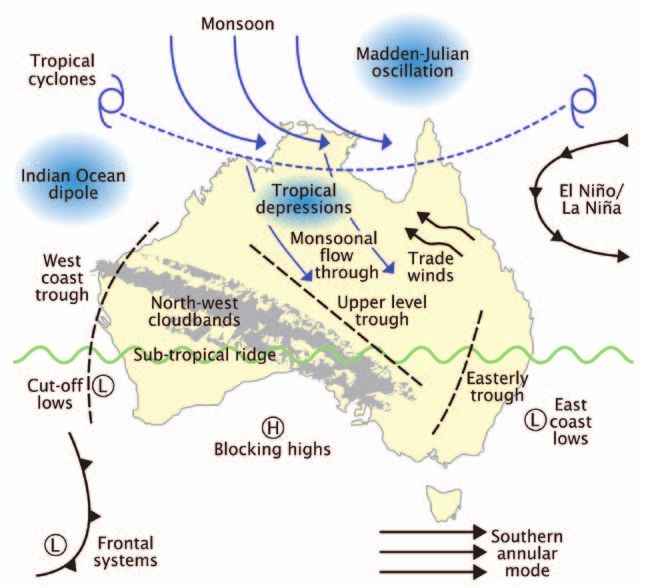
© CSIRO 2011. All rights reserved.
                                                                           View complete contents

 Type 3: Wet west & central                                                                 Type 5: Dry everywhere

 H                                                                 H
                                                                                                                       H

                                                     Probability                                                                 Probability
                                                     of rain (%)                                                                 of rain (%)

                                                       100                                                                           100
                                                       80                                                                            80
                                                       60                                                                            60
                                                       40                                                                            40
                                                       20                                                                            20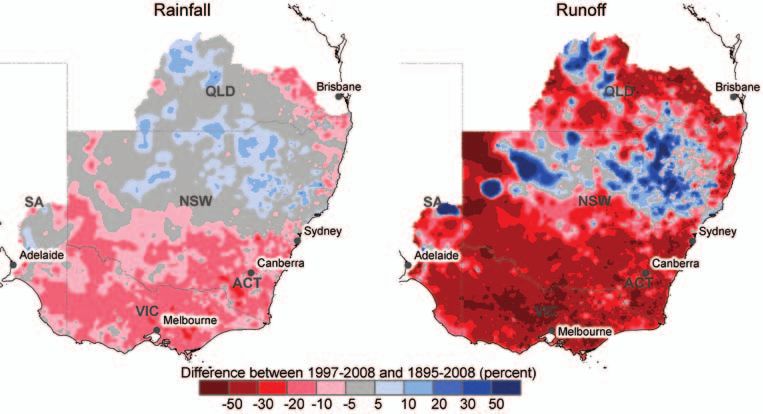
© CSIRO 2011. All rights reserved.
                                         View complete contents

Floods
At the opposite end of the range of climate variability are floods such as those experienced in 2010
and 2011 across eastern Australia. These were associated with one of the strongest La Niña events
on record, the opposite to the El Niño conditions that were associated with drought. During La
Niña conditions, the eastern Pacific Ocean is unusually cool as a result of upwelling of deep ocean
water, strengthening the easterly trade winds coming to Australia from the western Pacific Ocean.
This brings warm moist air over eastern Australia, causing widespread above-average rainfall.
  Floods are the most costly natural disaster in Australia. The average direct annual cost of
flooding between 1967 and 1999 has been estimated at $314 million.12 Costs vary widely between
flood events (depending on flood volumes and infrastructure affected); for example, the Brisbane
floods of 1974 caused $700 million damage at that time, while the damage from the 2011 floods
is likely to be in the vicinity of $10 billion in current value. Moderate floods also have several
benefits – they infill reservoirs, recharge groundwater, and replenish natural environments (see
Chapter 9). These benefits can accrue for several years after the flood has subsided.
  The Bureau of Meteorology issues flood warnings based on continuous monitoring and reporting
of rainfall and river levels, rainfall forecasts, and hydrological modelling. Floods on small rivers
generally have warning periods lasting from several hours to a couple of days. Large regional floods
on lowland rivers occur with warning periods of days or weeks as they flow gradually downstream
from runoff that is generated in tributaries. The most unpredictable form of flooding is local flash
flooding in creeks and small rivers. This type of flooding is caused by locally intense storms that
can cause a creek to rise to a major torrent in less than an hour. Flooding in Toowoomba and the
Lockyer Valley in January 2011 were examples of flash flooding with tragic consequences.
  Statistical analysis of historical floods shows that decades of higher than average rainfall, such
as the 1950s to 1970s, can have higher magnitude floods than under average climatic conditions.
A flood expected once every 100 years or so on average can be twice as large in these wetter
decades than in drier decades.13 The same could happen with global warming. The warmer ocean
temperatures will produce stronger convection and the ability of the air to hold more moisture,
which could increase the intensity of storms and cyclones.14 Climate modelling also shows that
extreme rainfall events such as cyclones are likely to be more intense in future, although less
frequent,15 resulting in bigger floods and greater costs from flooding.
  Many large dams, such as the Wivenhoe Dam in Brisbane, are managed to store water supplies
and to retain some empty storage capacity to absorb and mitigate floodwaters, protecting
downstream communities. These two functions may appear in conflict but the level of water to
be stored is determined well in advance. Better seasonal forecasts of inflows (see below) offer
the prospect of increasing the flood storage volume in dams when the forecasts predict a high
probability of flooding.

                                                                                  Water and climate    35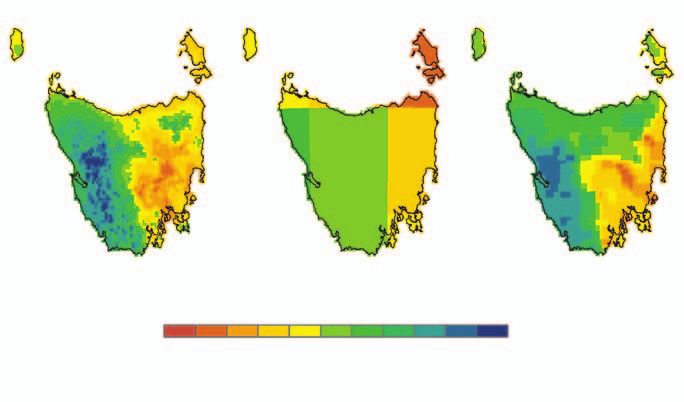
© CSIRO 2011. All rights reserved.
                                                     View complete contents

Brisbane floods, January 2011. Photo: Glenn Walker.

Short-term and seasonal forecasting of river flow
A paradox of Australia’s highly variable rainfall and runoff is that it can be predicted several
months in advance from the signals of global circulation such as El Niño and La Niña and other
indicators. River flows can be forecast several months or seasons ahead using information on
the soil moisture in the catchment, and the state of the ocean and atmosphere (e.g. droughts in
eastern Australia are often linked to El Niño events in the equatorial Pacific Ocean).16 Seasonal
rainfall and runoff forecasts can help irrigators plan, support trade of water, and make water use
more efficient, and help decide when to release water from reservoirs.
     The Bureau of Meteorology has been issuing seasonal weather outlooks since the 1990s, and
in 2010 it launched a new service on seasonal river flow forecasting.17 This forecasting system
is based on models developed by CSIRO18 that give probabilistic forecasts of river flow several
months ahead, in particular flows to major water storages (e.g. Hume and Dartmouth Dams in the
upper Murray; Figure 3.7).
     The Bureau of Meteorology is also responsible for issuing flood warnings and is planning to
extend its current flood warning service to forecast river flows continuously up to 10 days ahead.
The Bureau of Meteorology and CSIRO are jointly developing and testing a modelling system for
this purpose combining hydrological and weather prediction models that use real-time data from
climate stations, river flow gauging sites, and satellite data.

36     Chapter 3.
© CSIRO 2011. All rights reserved.
View complete contents
Figure 3.7: Seasonal
forecast of runoff into the
upper catchments of the
Murrumbidgee and Murray
Rivers issued in December
2010 for the 3-month period
from December 2010 to
February 2011.19 Dark blue
indicates the probability of
markedly above average
runoff; light blue indicates
the probability of average
runoff, and orange indicates
the probability of markedly
below average runoff. The
prediction was for high flow
across the region as a result of
wet catchment conditions and
the forecast for continuing La
Niña conditions. High flows did
persist through the summer.
Impacts of climate change on river flows
Global temperatures of both the atmosphere and the oceans have been rising since the 1950s, and
rising more rapidly than has been recorded in the geological past.20 Many studies have linked most
of the global warming to increasing greenhouse gas emissions.20,21 There is less certainty whether
human-induced increases in temperature are the cause of the decline in rainfall in south-west
Australia since the 1970s and the historically unprecedented conditions of the recent millennium
drought in south-east Australia. This is because the huge natural variability (or noise) in rainfall
from year to year makes it difficult to detect an overall trend. Rainfall is also controlled by
regional weather and climate patterns (Figure 3.1), which have a complex relationship with global
temperatures.
Climate modelling indicates that the persistent dry conditions in the far south-west and the
millennium drought in south-east of Australia are at least in part a result of climate change.3,11,22
The dry conditions are associated with the shift of storm tracks towards the southern ocean.
Climate models indicate that such changes are likely to intensify and become more persistent in
future, so the dry conditions experienced are consistent with the trajectories of future climate for
those regions.
Extended droughts and decades of wetter conditions are also a natural feature of southern
Australia’s climate. With only a little over a century of measurements, it is hard to establish
patterns that span several decades so proxy records from tree rings, corals, and caves are used
to describe longer term climate patterns. These proxies are correlated for recent times with the
Water and climate 37© CSIRO 2011. All rights reserved.
View complete contents
historical measurements of the oceans and atmosphere and then used to extend those records
further back in time. At shorter time scales, we know that El Niño and La Niña influence rainfall
and runoff 23 and now additional longer decade cycles are being found of increased frequency of
El Niño events followed by decades of increased frequency of La Niña events. Decades of high
frequency of El Niño events are associated with extended periods of drier-than-average conditions
in eastern Australia, such as in the last few decades, and vice versa for wetter than average
conditions, such as in the 1950s and 1970s.24
It is possible that the millennium drought was a combination of natural variability and climate
change and it is only through continued observations in coming years that any long-term trend in
rainfall can be confirmed or not, and then, if the connection is evident, be attributed unequivocally
to human-induced climate change. Regardless of the cause, though, a decade or more of drier
conditions is enough to put water users, including ecosystems, under considerable stress and has
tested whether water management is well adapted to such harsh conditions.
Predicting climate change impact on river flows involves three main components. Firstly, global
climate models are used to project future climate change. Secondly, the results from these global
climate models are ‘downscaled’ to the region of interest and its weather patterns, and finally,
these regional weather patterns are used to run hydrological models to predict future river flows.
Global climate models simulate complex global and regional climate systems. The Bureau of
Meteorology and CSIRO have combined climate process understanding with global climate model
simulations from the Intergovernmental Panel on Climate Change (IPCC)20 to provide climate
projections for Australia.25 Figure 3.8 is an example of the range of projected changes in average
annual rainfall by 2070 relative to 20th century rainfall.
There is a considerable difference in the projected rainfall in each of the maps in Figure 3.8.
This is because of two key uncertainties about future climate. The first is the future level of
greenhouse gas emissions, which will be determined by future industrial development and
mitigation of emissions. The world is currently tracking toward the high end of emissions shown
on the right hand column of Figure 3.8. The second uncertainty is how future rainfall in Australia
will respond to changes in global temperature. Future rainfall is predicted from global climate
models, through changes to conditions in the atmosphere and ocean, such as those shown in
Figure 3.1. Figure 3.8 shows the range in projections from the various global climate models used
by the IPCC.
Most climate models indicate that southern Australia, where most water is consumed, is on
average likely to be drier in the future. The model projections are consistent with the patterns
observed during the last decade or so, with a shift of autumn and winter storm tracks towards the
South Pole. In northern Australia, the direction of change in average rainfall is uncertain, with as
many models predicting a wetter future as a drier future.
38 Chapter 3.© CSIRO 2011. All rights reserved.
View complete contents
Figure 3.8: Projections for percentage change in average annual rainfall in Australia by 2070
relative to 20th century rainfall. Nine projections are shown. The columns of maps show projections
for low, medium, and high future greenhouse gas emissions, showing the effects of different amounts
of global warming. The rows of maps show the range of projections from different global climate
models. The top row shows the drier model results, the middle row is the mid-range of results and
the bottom row shows the wetter projections of average annual rainfall from the models.26
Global climate models produce results at a very coarse spatial resolution. Victoria is typically
represented by less than five grid cells in a global climate model and Tasmania is equivalent in
area to a single grid cell. Although driven by global circulation patterns, rainfall and river flows
are regional phenomena influenced by local topography, proximity to the coast, and local weather
patterns. For regional and catchment hydrological modelling, the global climate model simulations
need to be scaled down to catchment-scale rainfall and other climate variables.27
Water and climate 39© CSIRO 2011. All rights reserved.
View complete contents
Dynamic downscaling models are fine-scale climate models nested inside the coarse-scale global
climate models. They are able to represent fine-scale topography, vegetation, and weather patterns
to produce more detailed patterns of rainfall and other climate variables. Figure 3.9 shows a
dynamic downscaling example used for hydrological modelling in the CSIRO Tasmania Sustainable
Yields project.
Statistical downscaling models statistically relate regional patterns of rainfall and other climate
variables to its large-scale drivers in the atmosphere or oceans. Statistical relationships are built
between regional rainfall observations and the larger scale properties of the atmosphere. These
are then used to predict future regional rainfall under the changed atmospheric conditions of
human-induced climate change. Figure 3.6 is an example of statistical downscaling, showing how
rainfall across south-west Australia is related to larger scale patterns of atmospheric circulation.
The results from climate downscaling are used to run hydrological models to predict future
catchment runoff and river flows.29,30 Changes to the average annual runoff (and hence river flow)
for a 1ºC global warming (median warming by 2030 relative to 1990) across Australia have been
modelled (Figure 3.10, Table 3.1). The considerable range in runoff projections is mainly because
of uncertainty of future rainfall under a changed climate. In the far south-west and south-east, a
large majority of the climate models project a drier future and this translates to runoff declines
of 25% in the south-west and 10% in southern Murray–Darling Basin and Victoria for a 1ºC global
warming in the median projection. The hydrological models also simulate changes to other flow
characteristics, such as the variability of reservoir inflows and floods and low flows. The low flows
and loss of connectivity in the more frequent long dry periods in the future will affect aquatic
ecosystems5 and may exacerbate water quality problems. Larger changes than those shown are
predicted to occur beyond 2030 as climate change continues (Figure 3.11); for example, if there is
2ºC or more of global warming, which now seems highly likely.20,21
Figure 3.9: An example of
(a) Output derived (b) Global climate (c) Downscaling
from rain gauge date model output model output the need to downscale rainfall
from global climate models.
(a) The observed patterns of
rainfall across Tasmania. (b) A
global climate model prediction
of rainfall that portrays only
the coarsest patterns. (c)
Rainfall downscaled from the
global climate model using a
regional climate model that
represents the topography
observed modelled and other influences on
regional rainfall, producing
Mean annual rainfall (mm)
patterns similar to those
300 400 500 600 800 1000 1200 1600 2000 2400 2800 4200 observed across Tasmania.28
40 Chapter 3.© CSIRO 2011. All rights reserved.
View complete contents
Figure 3.10: Change in average annual runoff for 1ºC of global warming (~2030 relative to ~1990) across
Australia. The top row shows percentage change in runoff and the bottom row shows change in runoff
depth (mm). The median, dry and wet extremes of the range of climate projections are shown.28,29,31,32
Table 3.1: Projected changes to average annual runoff for a 1ºC global
warming from Figure 3.10.
Region Modelled changes in average annual runoff
(%)
Dry extreme Median Wet extreme
projection
North-east Australia –15 –1 +20
North-west Australia –18 0 +16
South West of Western Australia –37 –25 –12
Tasmania –6 –3 0
Northern Murray–Darling Basin –15 –5 +12
Southern Murray–Darling Basin and Victoria –20 –10 +1
Water and climate 41© CSIRO 2011. All rights reserved.
View complete contents
Although climate change is likely to reduce average rainfall and runoff in southern Australia, the
climate will still be experienced largely as floods and droughts. The interactions between climate
change, floods, and droughts are illustrated in Figure 3.11 for the southern Murray–Darling Basin
and Victoria. A useful indicator for the use of water resources is the 10-year average of runoff.
Large dams are able to buffer water supplies against the year to year variations in runoff and
provide reliable supplies. However, they are unable to maintain supplies if there is a long drought
with low runoff, as was seen in the millennium drought. Similarly, ecosystems have evolved to
cope with floods and droughts, but a decade of drought in addition to other pressures can place
them under stress.
Figure 3.11 shows that the impact of climate change on runoff by 2030 is small relative to the
year to year and decadal variability in runoff, where flood years can have 10 times the runoff of
drought years. The climate in 2030 will still be one that produces floods and droughts, but with
a lower average annual runoff: the droughts may be more intense and the floods less frequent.
Projecting out to 2050 and 2070, more profound changes to average runoff are possible, with
the prospect that the average runoff could be similar to that experienced in the decade of the
millennium drought. Floods and droughts would still be superimposed on that, giving periods
of very severe droughts in future. The experience of the millennium drought suggest that such
a large reduction in average runoff and more severe droughts on top of that would have severe
impacts on water use and on river ecosystems.
Water management and planning in a changing climate
As well as reducing runoff, a warmer climate could increase potential evaporation and hence
increase the demand for water in irrigated agriculture, cities, and for use by wetlands and other
water-dependent ecosystems. Evaporation though, like runoff, has a complex relationship with
global warming and is influenced by other factors such as wind speeds and cloud cover. Thus
climate change could not only reduce water availability in these regions but could further increase
the gap between water supply and demand. Essentially, climate change intensifies the water
scarcity challenge facing cities and rural catchments and intensifies the challenge of achieving
environmentally sustainable levels of usage.
Water managers and policy makers in Australia are developing and updating plans to cope with
a variable and changing water future. Most capital cities are investing in additional water supply
infrastructure to meet the needs of growing populations. Some cities are moving away from their
traditional reliance on catchment runoff and groundwater, because these sources are most sensitive
to climate change and drought. Instead they are diversifying by investing in desalination plants
and water reuse. Water demand per capita is reducing as a result of water use efficiencies, water-
42 Chapter 3.© CSIRO 2011. All rights reserved.
View complete contents
sensitive urban design, and water conservation by communities (see Chapter 6). In rural areas, the
increased use of water markets, improvements in irrigation efficiency (see Chapter 8), and return of
water to degraded ecosystems (see Chapter 9) are all improvements in water management that will
also make water management more adaptable to climate change and variability.
It should not be assumed that under conditions of climate change all users of water, including
the environment, will bear the reductions in runoff equally. In the highly managed rivers of the
Murray–Darling Basin, and city water supplies, flows in the river are largely determined by the
operation of dams in accordance with water plans. These river operations and plans are designed
to provide reliable supplies, buffering users against a drop in runoff during dry years and storing
more water during wet years to compensate. The plans also tend to pass on impacts of reduced
flows to regions downstream. They were not designed to deal with long-term reductions in runoff
due to climate change. Under the plans, long-term reductions in runoff would be largely borne
by the environment and downstream regions.33 In the Murrumbidgee River system, the median
climate projection for 2030 predicts a 9% reduction in runoff, which under the existing water
sharing plan would reduce water supply to irrigation districts by only 2%, whereas outflows to the
Murray River would reduce by 17% and water for the major wetlands would reduce by over 30%.
New arrangements would be needed to share the impacts of climate change more evenly while still
providing reliable supplies to water users.
200
150
Runoff (mm)
100
50
0
1900 1910 1920 1930 1940 1950 1960 1970 1980 1990 2000 2010 2020 2030 2040 2050 2060 2070
Year
Figure 3.11: Annual runoff across the southern Murray–Darling Basin and Victoria (blue bars) and the
moving average of the previous 10 years runoff (black line) showing large year to year and decade to
decade variability in runoff. The long-term average runoff from 1895 to 2008 (red line), is projected
forward using the median climate change projection for mean annual runoff (1990 to 2070). The two
dashed lines are the dry and wet extremes of projected average runoff under climate change.33 By
2030 the change in average annual runoff is small compared to the variability in runoff, but by 2070
the average runoff could be as low as that experienced in some of the worst historical droughts.
Water and climate 43© CSIRO 2011. All rights reserved.
View complete contents
Dried-out lagoon on old station property at Big Bend, South Australia. Photo: Greg Rinder, CSIRO.
Advances in climate and hydrological sciences and modelling tools can be used to guide water
management and planning in a changing climate. The predictions of future water availability are
improving as more data become available and the science progresses, but the range of possible
future runoff is likely to remain large. Water plans at present are almost exclusively based
upon historical rainfall, runoff, and groundwater recharge measurements34 because these data
provide some confidence for assessing water resources and they encompass a range of historical
conditions. However, the prospect of climate change and the experience of the millennium
drought suggest that relying on history alone is insufficient. Formal risk management techniques
can incorporate several future scenarios and the high uncertainties associated with them. These
approaches can show how impacts from climate change would be shared among users and give
certainty over how plans will be adapted to deal with new conditions if they emerge. Water
planning can be made more effective by ongoing research to better understand climate, its
relationship to water resources, and consequent impacts on water users and ecosystems.
44 Chapter 3.© CSIRO 2011. All rights reserved.
View complete contents
Conclusions
Relatively small changes in rainfall are amplified to much larger changes in runoff and
groundwater recharge, which make Australia’s water resources the most variable in the world.
Water management is highly adapted to this variability, but the millennium drought in south-east
Australia and the sharp drop in runoff in the South West of Western Australia since 1975 have
tested the effectiveness of these adaptations. New measures are being introduced such as urban
water supplies that are less dependent on runoff and the return of water to the environment to
make it more sustainable. Climate change is occurring on top of that variability and in southern
Australia it is likely to further reduce water resources. For the moderate climate change predicted
to occur by 2030, the adaptation to droughts and floods can be effective, because the worst
consequences are likely to be more intense droughts and less frequent but more intense floods.
For further climate change, projected to occur by 2050 or 2070, the conditions of the millennium
drought might become the average future water availability, which would have profound
consequences for the way water is used and for ecosystems. The understanding of how climate
influences water can help make water management more adaptable, such as through improved
seasonal forecasts, and it can help communities plan how they will respond to reduced water
availability in future.
Further reading
Cleugh H, Stafford-Smith M, Battaglia M and Graham P (2011) Climate Change: Science and Solutions
for Australia. CSIRO Publishing, Melbourne, .
CSIRO (2010) ‘Climate variability and change in south-eastern Australia: a synthesis of findings
from Phase 1 of the South Eastern Australian Climate Initiative (SEACI)’. CSIRO, Australia.
CSIRO/Bureau of Meteorology (2010) ‘State of the climate: observations and analysis of Australia’s
climate’, .
Garnaut R (2008) ‘The Garnaut climate change review: final report’. Cambridge University Press,
Melbourne, Australia, .
Garnaut, R (2011). ‘Update Paper 5 – The science of climate change. Garnaut climate change
review – Update 2011’. Commonwealth of Australia, Canberra, .
Water and climate 45© CSIRO 2011. All rights reserved.
View complete contents
Intergovernmental Panel on Climate Change (2007) Summary for policymakers. In: Climate Change
2007: The Physical Science Basis. Contribution of Working Group I to the Fourth Assessment
Report of the Intergovernmental Panel on Climate Change. (Eds S Solomon, D Qin,
M Manning, Z Chen, M Marquis, KB Averyt, M Tignor and HL Miller). Cambridge University
Press, Cambridge, UK and New York, USA, .
46 Chapter 3.You can also read