TOURISM FORECASTS 2019 - Tourism Forecast report 2019
←
→
Page content transcription
If your browser does not render page correctly, please read the page content below
TOURISM FORECASTS 2019

2 TOURISM FORECASTS 2019
TOURISM RESEARCH AUSTRALIA
ACKNOWLEDGMENTS
As part of the forecasting process, Tourism Research Australia (TRA) established the Tourism Forecasting Reference Panel (the
Panel) comprising experts from industry and government. Its key purpose is to review and provide feedback on TRA’s draft tourism
forecasts before results are finalised. TRA acknowledge the contribution of the following Panel members:
Heather Cotching Chief Economist, Australian Trade and Investment Commission
Daniel Gschwind Chief Executive Officer, Queensland Tourism Industry Council
Karen Halbert Executive General Manager (Corporate Affairs, Government and Industry),
Tourism Australia
Lindsay Hermes Policy and Government Relations Manager, Tourism & Transport Forum
Peter Shelley Managing Director, Australian Tourism Export Council
Tapas Strickland Director, Economics, National Australia Bank
Dr Tony Webber Managing Director, Airline Intelligence and Research Pty Ltd
Tourism Research Australia
Australian Trade and Investment Commission (Austrade)
Email: tourism.research@tra.gov.au
Web: www.tra.gov.au
Publication date: September 2019
This work is licensed under a Creative Commons Attribution 4.0 International licence. To the extent that copyright subsists in third
party quotes and diagrams it remains with the original owner and permission may be required to reuse the material.
This work should be attributed as Tourism Forecasts 2019, Tourism Research Australia, Canberra.
Enquiries regarding the licence and any use of work by Tourism Research Australia are welcome at tourism.research@tra.gov.au
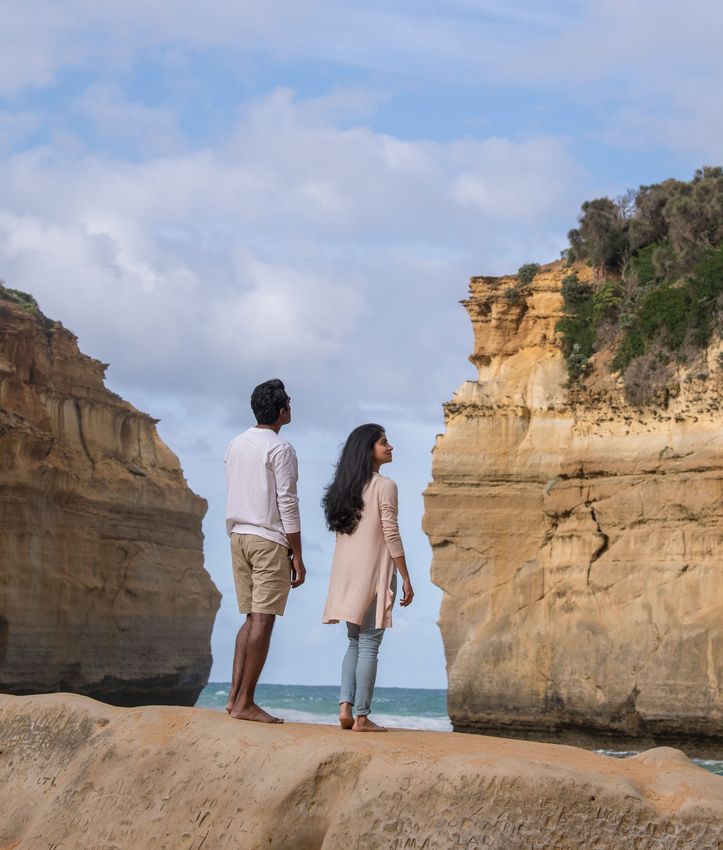
Cover image: Loch Ard Gorge, Victoria. Image courtesy of Visit Victoria.
TOURISM FORECASTS 2019
                                                                                  TOURISM RESEARCH AUSTRALIA                       3

CONTENTS
ACKNOWLEDGMENTS................................................................................2

1. INTRODUCTION ....................................................................................4
      PURPOSE OF FORECASTS ............................................................................................ 4
      KEY FINDINGS ............................................................................................................. 4

2. NATIONAL FORECASTS .........................................................................6
      INTERNATIONAL VISITOR ARRIVALS ............................................................................. 6
      DOMESTIC TRAVELLERS................................................................................................ 8
      AUSTRALIANS TRAVELLING OVERSEAS.......................................................................... 9
      SPEND BY INTERNATIONAL VISITORS AND DOMESTIC TRAVELLERS..............................10

3. STATE AND TERRITORY FORECASTS...................................................11

4. THE ECONOMIC FACTORS INFLUENCING THE FORECASTS...................14
      GLOBAL ECONOMIC OUTLOOK WEAKENING..................................................................14
      AUSTRALIA IS ON A SLOWER GROWTH TRACK..............................................................15
      WORLD OIL PRICES......................................................................................................15
      OTHER INFLUENCES ON THE FORECASTS....................................................................16
      AVIATION.....................................................................................................................16
      ACCOMMODATION .......................................................................................................17

5. RISKS ................................................................................................18

6. DATA SOURCES.................................................................................18
4 TOURISM FORECASTS 2019
TOURISM RESEARCH AUSTRALIA
1. INTRODUCTION nn Growth from emerging Asian markets will gain momentum,
with India, Malaysia and Indonesia collectively contributing
Tourism is one of Australia’s fastest growing industries. In 16.7% of growth over the next two years. India is on track
2017–18, tourism Gross Domestic Product grew at 5.0% in to overtake Japan as one of Australia’s top five source
real terms, much faster than the 2.8% growth reported for the markets by 2023–24. Other top five markets will remain
economy as a whole. unchanged.
nn Traditional source markets, such as the US, the United
To ensure that the industry continues to grow in a sustainable Kingdom (UK) and New Zealand (NZ) are expected to grow
way, clear strategies are required from government and solidly over the next two years.
industry to cater not just for the economic aspects of tourism,
but for environmental and social impacts as well. With a more nn The lower Australian dollar will make Australia more
competitive international environment, changing traveller competitive with overseas destinations, and contributes
behaviours and new opportunities from emerging markets, it is to solid growth in domestic tourism and modest growth in
more important than ever to have highly informed and targeted outbound travel.
advice to inform future planning and investment decisions.
Based on this short-term outlook, total overnight spend at the
end of 2020 is forecast to be around $134 billion. This would
PURPOSE OF FORECASTS place the industry towards the higher end of the $115 billion to
$140 billion spend target set under government and industry’s
Tourism Research Australia’s (TRA) forecasts support these
tourism strategy, Tourism 2020.
goals by providing policymakers, planners and investors with a
ten-year view on changes in the following indicators:
TABLE 1: SHORT-TERM GROWTH IN VISITOR
nn inbound arrivals, focusing on Australia’s main international SPEND
markets
2018–19 2019–20 2020–21
nn purpose of travel for inbound arrivals
nn visitor nights and spend for international and domestic $49.3b $53.1b
International $45.7b
travellers 8% 7.5%
nn international and domestic visitor nights in Australia’s states $80.9b $84.1b
Domestic
and territories overnight $78.4b
3.2% 3.9%
nn outbound travel by Australian residents, and the main
country they visit. $25.3b $26b
Domestic day $24.6b
2.7% 2.7%
$155.6b $163.1b
KEY FINDINGS Total $148.7b
4.6% 4.9%
SHORT-TERM OUTLOOK LONG-TERM OUTLOOK
Tourism spend is forecast to increase 4.6% from $148.7 billion
Total spend is forecast to grow 59% from $148.7 billion to
in 2018–19 to $155.6 billion in 2019–20. Spend will then
$236.5 billion between 2018–19 and 2028–29, with an
increase by a further $7.5 billion to $163.1 billion in 2020–21.
average annual growth rate of 4.7% (Figure 1).
The short-term outlook has been compiled based on the
following assumptions:
Over this period, international tourism spend will more than
double to $94.9 billion in 2028–29, capturing a 40% share of
nn Chinese visitation will continue to rise but transition to a
the visitor dollar. This is nine percentage points higher than its
more sustainable trajectory as the country’s economic
31% share in 2018–19. International tourism’s strong growth is
growth slows and the impacts of trade tensions with the
driven by a forecast 56.4% increase in annual visitation from
United States (US) continue to play out. China’s large
9.4 million visitors to 14.6 million between 2018–19 and
market share has a significant effect on forecasts of visitor
2028–29, and a 32.8% increase in average visitor spend from
numbers and spend.
$4,881 to $6,484.TOURISM FORECASTS 2019
TOURISM RESEARCH AUSTRALIA 5
For domestic tourism, this same timeframe will see the nn Day trip spend will grow 29.7% to $31.9 billion. This will
following results: come on the back of a 12.1% increase in day trips, from
224.4 million to 251.5 million and an increase in average
nn Average spend per overnight visitor will increase from
visitor spend from $110 to $127. Day trips are forecast to
$702 to $875, with total visitor nights growing 13.1%
account for 13.5% of total visitor spend in 2028–29, three
from 398.6 million to 450.7 million. This will result in total
percentage points lower than in 2018–19.
domestic overnight spend growing 39.8% to $109.6 billion,
accounting for 46.4% of all visitor spend. This represents
a seven percentage point fall from the 52.7% share for
2018–19.
FIGURE 1: GROWTH IN VISITOR SPEND, 2018–19 TO 2028–29
17%
120 31%
2018–19
100 $148.7B
53%
80
$BILLION
60
40
14%
20
2028–29 40%
0 $236.5B
46%
INTERNATIONAL DOMESTIC OVERNIGHT DOMESTIC DAY
HOW TRA DEVELOPS THE NATIONAL …AND THE STATE AND TERRITORY FORECASTS
FORECASTS…
1. A
ustralia is divided into thirteen metropolitan and
1. E
stimates of tourist activity and spend are regional locations.1
produced using a combination of econometric
time series models and market intelligence based 2. A
djustments are made for each location to
on: compensate for extreme peaks and troughs in
historical visitor nights data, and for structural
nn global and domestic economic conditions breaks in this data. The most recent visitor nights
data is used to produce forward trend estimates.
nn aviation capacity and airfares
3. S
easonal projections are produced for each
nn domestic accommodation supply and room
location based on long-term growth patterns.
rates
4. T
he seasonal projections and forward trend
nn significant events likely to affect source
estimates are combined to produce forecasts
markets.
for each location, then converted to state and
2. A
n industry sentiment survey is sent out to gain territory forecasts.
further insights on the most influential factors for
5. F
inal checks are made to ensure that the state
the coming year.
and territory forecasts match the national
3. D
raft tourism forecasts are presented to the forecasts when added together.
Tourism Forecasting Reference Panel for its
consideration and feedback. 1 These locations comprise Sydney, regional New South Wales,
Melbourne, regional Victoria, Brisbane/Gold Coast, regional
Queensland, Perth, regional Western Australia, Adelaide, regional
South Australia, Northern Territory, Tasmania and the Australian
Capital Territory.TOURISM FORECASTS 2019
TOURISM RESEARCH AUSTRALIA 6
2. NATIONAL FORECASTS FIGURE 2: VISITOR GROWTH BY MARKET,
2018–19 TO 2020–21
INTERNATIONAL VISITOR ARRIVALS
INDIA 21
Over the next two years, international visitor arrivals to Australia
are expected to increase 9.7%, from 9.4 million in 2018–19 to INDONESIA 14
9.8 million in 2019–20 and 10.3 million in 2020–21.
CHINA 12
ASIAN MARKETS US 11
These forecasts have resulted in a significant downward MALAYSIA 11
revision for the China market from the previous forecast, with
visitor numbers only expected to increase 12% from 1.4 million CANADA 10
visitors in 2018–19 to 1.6 million in 2020–21. This result is due
to visitation transitioning to a more sustainable growth trajectory FRANCE 8
as the market matures. Further, over the short and medium
JAPAN 8
term, the outlook is affected by the ongoing US-China trade
tensions along with an economic slowdown and moderation HONG KONG 8
of aviation capacity growth. Despite this, the China market
will continue to be Australia’s largest inbound source market, THAILAND 7
both economically and in terms of volume. Overall, Asian
markets will tend to outperform other overseas markets over
GERMANY 7
the forecast period on the back of increased prosperity and SINGAPORE 6
consumerism (Figure 2). Markets expected to experience the
greatest growth over the next few years include: NZ 6
nn India – up 20.9%, from 0.37 million visitors in 2018–19 to UK 5
0.45 million in 2020–21
KOREA 3
nn Indonesia – up 13.5%, from 0.22 million visitors in
2018–19 to 0.25 million in 2020–21 0 5 10 15 20 25
GROWTH (%)
nn Malaysia – up 11.1%, from 0.40 million visitors in 2018–19
to 0.44 million in 2020–21.
More traditional Asian markets such as Japan and Singapore TRADITIONAL MARKETS – US, UK AND NZ
are expected to follow a more modest growth trajectory:
By comparison, growth prospects for Australia’s largest
nn Japan – up 8.3%, from 0.48 million visitors in 2018–19 to traditional markets are mixed.
0.52 million in 2020–21
Visitor numbers from the US are expected to grow strongly
nn Singapore – up 6.4%, from 0.45 million visitors in 2018–19 – up 11.1% from 0.80 million in 2018–19 to 0.89 million
to 0.48 million in 2020–21. in 2020–21. Expected improvements in the US domestic
economy, very low unemployment rates and the strengthening
Overall, the volume of Asian visitors is expected to grow 11.8% US dollar relative to Australian currency will continue to drive
in the two years to 2020–21, from 4.7 million in 2018–19 to this growth.
5.0 million in 2019–20 and 5.3 million in 2020–21.
Due to ongoing uncertainty around a post-Brexit economy,
Because it is outpacing other markets, Asia will consolidate its visitation from the UK is expected to record modest growth
market share, accounting for 51.2% of visitation to Australia during the forecast period, up 5.3% from 0.72 million visitors in
in 2020–21, compared with a 50.2% share in 2018–19. Asia 2018–19 to 0.76 million in 2020–21.
will also account for 61% of all visitor growth between 2018–19
and 2020–21, with China alone contributing almost one-fifth Meanwhile, NZ is expected to experience above-trend visitor
(19%), followed by India (8.6%) and Malaysia (4.9%). growth, increasing from 1.40 million in 2018–19 to 1.49 million
in 2020–21 – growth of 6% over the two years.7 TOURISM FORECASTS 2019
TOURISM RESEARCH AUSTRALIA
TOP 5 – CHINA, NZ, US, UK AND JAPAN
Box 1: The scope of international forecasts
Over the longer term, Australia will continue to have a high
These international forecasts are reliant on proportion of visitors from the top five inbound markets –
data from the International Visitor Survey (IVS). China, NZ, US, UK and Japan. Collectively, these five countries
However, while the IVS is limited to people aged are forecast to provide nearly half (46%) of the additional
15 years and over, these forecasts use Australian 5.3 million arrivals expected in 2028–29. Around 1.1 million,
Bureau of Statistics’ overseas arrival data which or almost 21.2% of these additional arrivals, will be from China.
includes visitors aged under 15. These forecast This will see an increase in the importance of Chinese tourism,
adjustments are applied to holiday visitors, as their share of arrivals grows from 15.3% in 2018–19
international education visitors and those visiting to 17.4% in 2028–29. The growing significance of China
friends and relatives (VFR). Forecasts for the other will result in the relative importance of most other markets
reasons for travel – business, employment and declining over this period (Figure 3).
other categories – remain based on IVS estimates.
FIGURE 3: CHANGE IN VISITOR MARKET SHARE, 2018–19 TO 2028–29
2028–29 INCREASE ON
CHANGE IN MARKET SHARE (PERCENTAGE POINTS)
('000) 2018–19 ('000)
CHINA 2,554 1,121
INDIA 879 507
INDONESIA 406 187
US 1,288 484
MALAYSIA 653 253
FRANCE 220 74
THAILAND 130 30
CANADA 265 76
HONG KONG 451 138
KOREA 403 120
GERMANY 284 74
JAPAN 651 168
SINGAPORE 594 142
UK 940 219
NZ 1,829 420
-3.0 -2.0 -1.0 0.0 1.0 2.0 3.0TOURISM FORECASTS 2019
TOURISM RESEARCH AUSTRALIA 8
TRAVEL PURPOSE DOMESTIC TRAVELLERS
International leisure travel – comprising holiday travel and
In 2019–20, modest increases are forecast for domestic visitor
travel to visit friends and relatives (VFR) – dominates Australian
nights, up 1.4% to 404 million nights, and day trips up 1.2%
inbound tourism, making up more than three-quarters (77%)
to 227 million trips. This reflects a situation where Australian
of total traveller volumes in 2018–19. This dominance is
economic growth is expected to remain at below its historical
expected to continue over the next two years, with growth of
average, and where discretionary spend is limited by sluggish
5% forecast for 2019–20 and 4.9% for 2020–21 (Figure 4).
wage growth.
FIGURE 4: GROWTH IN INTERNATIONAL TRAVEL Domestic travel costs, particularly for accommodation in
BY CATEGORY capital cities, are also likely to remain high, while low growth
in domestic air capacity could result in higher airfares in the
next two years. There is, however, the strong likelihood that
5.7% petrol prices will remain at, or near, current levels, reflecting
6.6% weakening global oil demand.
EDUCATION
As economic growth picks up through 2019–20 due to record
low interest rates and the impact of income tax cuts, there will
5.3% be a slight increase in growth rates, with domestic overnight
VISITING FRIENDS 5.3% visitor trips up 1.1% and day trips up 1.2%.
AND RELATIVES
Over the longer term, both overnight and day trips are forecast
to increase for the 10 years to 2028–29 by an average annual
4.7%
rate of 1.2% and 1.1%, respectively.
HOLIDAY 4.8%
3.3%
Box 2: The impact of National Visitor Survey (NVS)
changes on domestic tourism forecasts
BUSINESS 3.5%
With 97% of the Australian population aged
15 years or over owning a mobile phone, TRA has
3.2% transitioned NVS sampling to 100% mobile phone
EMPLOYMENT 0.9%
interviewing and discontinued landline sampling.
This new data series will improve the accuracy
of national, state and territory estimates, but the
transition from the original 50% mobile phone and
TOTAL
4.7% 50% landline split creates an unavoidable break in
4.7% series between 2018 and 2019 NVS data.
To address this issue, TRA has adopted a new
2020–21 2019–20 methodology for forecasting domestic tourism.
Under this approach, travel propensities of all
age groups were calculated from the new NVS
data series. This was combined with demographic
These forecast growth rates will see leisure travel volumes
increase from 7.2 million arrivals in 2018–19 to 11.5 million in
growth projections for the Australian population to
2028–29.
forecast growth rates of domestic overnight and
day trips.
Outside the leisure category, there is expected to be relatively
slow growth in business travel and employment-related travel,
extending a longer running trend. By contrast, education-
related travel – a major export for Australia – will continue to
grow strongly in 2019–20 (up 6.6%) and 2020–21 (up 5.7%).9 TOURISM FORECASTS 2019
TOURISM RESEARCH AUSTRALIA
AUSTRALIANS TRAVELLING FIGURE 5: AUSTRALIAN RESIDENT DEPARTURES,
GROWTH BY MAIN DESTINATION, 2019–20 AND
OVERSEAS 10-YEAR AVERAGE TO 2028–29
Domestically, subdued economic conditions combined with
low wages growth and the lower value of the Australian dollar
are having a negative impact on discretionary spend, including CHINA
international travel.
The net effect is expected to be a slight slowdown in growth INDONESIA
in outbound travel for the next two years, with departures
expected to increase 4% to 11.7 million in 2019−20 and a
further 4% to 12.2 million in 2020–21 (Figure 5). HONG KONG
The fastest growing outbound destinations over this two-year
period are expected to be: SINGAPORE
nn Other Europe2 – up 10.5%, from 1.3 million departures in
2018–19, to 1.33 million in 2019–20, and 1.4 million in THAILAND
2020–21
nn China – up 10%, from 0.61 million in 2018–19, to
UK
0.64 million in 2019–20, and 0.67 million in 2020–21
nn Indonesia – up 9.8%, from 1.3 million in 2018–19, to
1.36 million in 2019–20, and 1.43 million in 2020–21 US
nn Other Asia (including Japan and Vietnam) – up 9.3%, from
1.91 million in 2018–19, to 2.0 million in 2019–20, and
FIJI
2.1 million in 2020–21
nn Hong Kong – up 7.3%, from 0.25 million in 2018–19, to
0.26 million in 2019–20, and 0.27 million in 2020–21. NZ
Slower growth is expected for the following traditional
destination markets: MALAYSIA
nn UK – up 5.7%, from 0.68 million departures in 2018–19, to 0.0 1.0 2.0 3.0 4.0 5.0 6.0
0.7 million in 2019–20, and 0.7 million in 2020–21
GROWTH (%)
nn US – up 6.6%, from 1.1 million in 2018–19, to 1.13 million
in 2019–20, and 1.16 million in 2020–21 2019–20 GROWTH 10-YEAR AVERAGE ANNUAL GROWTH
nn Thailand – up 6.6%, from 0.56 million in 2018–19, to
0.58 million in 2019–20, and 0.6 million in 2020–21
These differing rates of growth will see some changes in the
nn NZ – up 5.8%, from 1.44 million in 2018–19, to top five outbound destinations, with China expected to overtake
1.47 million in 2019–20, and 1.52 million in 2020–21. the UK as our 4th largest single outbound market in 2024–25.
Over a longer 10-year horizon, the average growth rate for
outbound travel is forecast to be 3.6%. This will result in
outbound departures reaching 16 million by 2028–29. Under
this future growth scenario, Australia’s top five destinations (in
order) will be Indonesia, NZ, US, China and UK.
2 Europe excluding UK, France and GermanyTOURISM FORECASTS 2019
TOURISM RESEARCH AUSTRALIA 10
SPEND BY INTERNATIONAL VISITORS Due to these differing growth rates, there will be substantial
changes in shares for each type of travel. Therefore, by
AND DOMESTIC TRAVELLERS 2028–29, the forecast total visitor spend of $236.5 billion is
expected to comprise a:
Total tourism spend (including spend by international visitors,
plus overnight and day trip spend by Australian residents) is nn 40.1% share of spend from international visitors, up from
forecast to increase 4.6% to $155.6 billion in 2019−20. Total 30.7% in 2018–19
spend will then increase a further 4.9% to $163.1 billion in
2020–21. Over this period, the most rapidly growing spend nn 46.4% share of spend from domestic overnight travel,
segment will be international travel (Figure 6). down from 52.7% in 2018–19
nn 13.5% share of spend from day trips, down from 16.6% in
These trends are expected to persist over the longer term, with 2018–19.
the 10-year average growth rate of 4.7% being the net effect of:
nn 7.6% average annual growth in international spend, from By 2028–29, the five largest inbound markets in terms of
$45.7 billion in 2018–19 to $94.9 billion in 2028–29 visitor spend will be China, US, India, UK and Japan, which
collectively will contribute over 55% of inbound visitor spend
nn 3.4% average annual growth in domestic overnight spend, (Figure 7). China’s importance as a key tourism market is
from $78.4 billion in 2018–19 to $109.6 billion in 2028–29 expected to continue over the next decade, accounting for 31%
nn 2.6% average annual growth in day trip spend, from of the increase in spend between 2018–19 and 2028–29.
$24.6 billion in 2018–19 to $31.9 billion in 2028–29.
FIGURE 7: SHARE OF SPEND BY MARKET,
2018–19 AND 2028–29
FIGURE 6: SPEND GROWTH BY TRAVEL CATEGORY
27%
8.0%
INTERNATIONAL 7.5%
7.6% 42%
2018–19
9%
8%
3.2% 4% 5% 6%
DOMESTIC 3.9%
OVERNIGHT
3.4%
2.7% 29%
DAY TRIPS 2.7%
2.6% 41%
2028–29
2019–20 GROWTH
2020–21 GROWTH 9%
10-YEAR AVERAGE GROWTH TO 2028–29
6%
6%
4% 4%
CHINA US UK NZ JAPAN
INDIA OTHER11 TOURISM FORECASTS 2019
TOURISM RESEARCH AUSTRALIA
3. STATE AND TERRITORY nn Victoria – up 3.5% to 164 million nights due to a 2.8%
increase in domestic nights and a 4.2% increase in
FORECASTS international nights
Nationally, total visitor nights in Australia are forecast to nn Western Australia (WA) – up 3.3% to 74.2 million nights
increase by 2.8% to 708.5 million in 2019–20 and increase due to a 9.8% increase in international nights
by a further 3.3% to 731.5 million in 2020–21. At 2020–21, nn Queensland – up 3.2% to 163.3 million nights due to a
around 44% of nights will be from international visitors, 2.3% increase in domestic nights and a 4.7% increase in
with the remaining 56% from domestic overnight travel by international nights.
Australian residents.
Visitor growth rates for 2019–20 (Figure 8) will be largest for: For other states and territories, forecast growth in visitor nights
for 2019–20 is between 0.5% for Tasmania and 2.6% for
nn Australian Capital Territory (ACT) – total visitor nights will South Australia (SA).
increase 3.6% over the year to 14.3 million nights. This will
be the result of a 3.5% increase in domestic nights and a For 2020–21, the best performing states are expected to be
3.8% increase in international nights Tasmania, ACT, Victoria, NSW and Queensland, with growth
rates between 3.2% and 5.8% (Figure 9).
FIGURE 8: GROWTH OF VISITOR NIGHTS, BY STATE AND TERRITORY, 2019–20
9.8%
4.6% 4.7% 4.5%
4.2% 3.8%
3.5% 3.7% 3.3% 3.6%
3.2% 2.9% 3.5%
2.2% 2.8% 2.6%
2.3% 2.2%
0.5% 1.2%
0.0%
-0.2%
-0.9%
-3.8%
NSW VIC QLD SA WA TAS NT ACT
INTERNATIONAL DOMESTIC TOTAL
FIGURE 9: GROWTH OF VISITOR NIGHTS, BY STATE AND TERRITORY, 2020–21
8.6%
7.5% 7.5%
6.4%
5.8%
4.6% 4.8% 4.7% 4.9%
4.5%
3.6%
2.7%
2.2%
1.8% 1.7%
0.7%
0.3%
0.0%
-0.4%
-1.6% -1.4% -1.5%
-2.3%
-4.9%
NSW VIC QLD SA WA TAS NT ACT
INTERNATIONAL DOMESTIC TOTALTOURISM FORECASTS 2019
TOURISM RESEARCH AUSTRALIA 12
Over a ten-year time frame, a 34.8% increase is forecast in FIGURE 10: 10-YEAR AVERAGE ANNUAL GROWTH
total visitor nights from 689 million in 2018–19 to 928.5 million FOR VISITOR NIGHTS, BY STATE AND TERRITORY,
nights in 2028–29. Over the same period, domestic nights are 2018–19 TO 2028–29
expected to increase 13% from 398.6 million to 450.7 million
nights – an average annual growth rate of 1.2%.
3.5%
In comparison, international nights will increase at an average ACT 2.0%
5.1% annually from 290.4 million to 477.8 million nights. Due
5.1%
to this more rapid growth, international visitation will account
for a 51.5% share of all visitation in 2028–29; up
9.3 percentage points from its 42.1% share in 2018–19. 1.6%
NT 1.3%
Among the states and territories, there will be above average
2.3%
growth in visitor nights between 2018–19 and 2028–29
(Figure 10) for:
2.8%
nn Victoria – growing 3.5% annually to 224.8 million nights, TAS 1.6%
increasing its share of total nights from 23% to 24.2%
5.6%
nn ACT – growing 3.5% annually to 19.5 million nights,
increasing from a 2.0% to 2.1% share of total nights 2.0%
nn NSW – growing 3.3% annually to 304.9 million nights, WA 0.4%
increasing its share of total nights from 31.9% to 32.8%.
4.6%
2.1%
SA 1.4%
3.7%
2.8%
QLD 1.4%
4.9%
3.5%
VIC 1.5%
5.4%
3.3%
NSW 1.1%
5.3%
0.0% 1.0% 2.0% 3.0% 4.0% 5.0% 6.0%
TOTAL DOMESTIC INTERNATIONAL
Image courtesy of Destination NSW13 TOURISM FORECASTS 2019
TOURISM RESEARCH AUSTRALIA
Below average growth over this period will be experienced for: Between 2018–19 and 2028–29, ‘Other travel’ is forecast to
account for a substantially greater share of total visitor nights
nn Tasmania – 2.8% annual growth to 22.8 million nights, – growing from an 18.7% share in 2018–19 to a 21.5% share
maintaining its share of total nights at 2.5% in 2028–29. The growth will be driven by an increase in
employment-related travel and education travel, and will make
nn Queensland – 2.8% annual growth to 208.6 million nights,
a substantial contribution to forecast spend. The share of VFR
decreasing its share of total nights from 23% to 22.5%
travel will remain approximately the same (moving from 29.5%
nn SA – 2.1% annual growth to 44.5 million nights, decreasing to 29.8% of visitor nights); holiday travel will fall from 37.5% to
its share of total nights from 5.2% to 4.8% a 35.4% share; and business travel will drop from a 14.3% to
a 13.3% share. The shares attributable to these types of travel
nn WA – 2.0% annual growth to 87.7 million nights, decreasing
vary among different states and territories (Figure 11).
its share of total nights from 10.4% to 9.4%
nn NT – 1.6% annual growth to 15.8 million nights, decreasing
its share of total nights from 2.0% to 1.7%.
FIGURE 11: CHANGES IN TYPES OF TRAVEL, 2028–29 COMPARED TO 2018–19
13% 11% 11% 9% 4%
16% 17% 16% 18% 16%
21% 25% 22%
25% 12% 29% 33%
12%
34%
15% 15% 18% 24% 33%
11% 11% 17% 19%
11% 10%
24% 22%
18%
16%
26% 26% 28%
31% 31% 30% 31% 17%
34% 33% 27% 17%
31%
55% 32%
53% 45%
43% 42% 45%
38% 36%
36% 34% 33% 31% 35% 34%
21%
19%
9
9
9
9
9
9
9
9
9
9
9
9
9
9
9
9
–2
–2
–2
–2
–2
–2
–2
–2
–1
–1
–1
–1
–1
–1
–1
–1
28
28
28
28
28
28
28
28
18
18
18
18
18
18
18
18
20
20
20
20
20
20
20
20
20
20
20
20
20
20
20
20
NSW VIC QLD SA WA TAS NT ACT
HOLIDAY VISITING FRIENDS BUSINESS OTHER
AND RELATIVES
Image courtesy of Tourism and Events Queensland/Vince Valitutti14 TOURISM FORECASTS 2019
TOURISM RESEARCH AUSTRALIA
4. THE ECONOMIC FACTORS THE US
INFLUENCING THE This economy has demonstrated remarkable resilience in the
FORECASTS face of global and domestic disturbances, with the most recent
data showing better-than-expected economic growth and
unemployment at near-record lows. Wealth effects generated
GLOBAL ECONOMIC OUTLOOK by record highs in the US stock market are also buoying
WEAKENING consumer confidence.
The global economic outlook has weakened since TRA However, long-term economic prospects will be dampened by
released its last issue of tourism forecasts in August 2017, challenging trade relationships. Increased tariffs will reduce
with conditions softening across both advanced and consumer confidence and discretionary spend.
emerging economies. US-China trade tensions, the Brexit
deal uncertainty and political and economic challenges in the Under these circumstances the US economy is expected
Eurozone have triggered some prominent economic agencies to follow a modest growth path over the next two years,
to downgrade their outlook for global economic growth. For increasing by 2.1% in 2019–20 and 1.8% in 2020–21.
instance, in its latest World Economic Outlook update, the
International Monetary Fund (IMF) projects the global economy THE UK AND EUROZONE
to grow at 3.3% in 2019 and 3.6% in 2020, 0.4 and
0.1 percentage points, respectively, below its previous The UK economy gained momentum during the first quarter
projections.3 of 2019 despite concerns around Brexit and a general global
slowdown. However, the UK’s medium-term economic outlook
The downward revisions of the economic growth forecasts have continues to be overshadowed by Brexit uncertainty. On this
weighed down these tourism forecasts significantly. basis, the UK economy is forecast to grow by 1.6% in 2019–20
and 1.7% in 2020–21.
CHINA
In the Eurozone, economic recovery is continuing with signs of
China’s economy is moving towards a slower growth trajectory improved employment and consumer confidence. That said,
as it pivots from investment and export-led growth to one growth among key European economies remains uneven,
more driven by consumption and services. This presents ranging from to 1.6% for Germany to 0.6% for Italy in
both opportunities and challenges for the Australian 2019–20. Over the longer term, UK’s exit from the European
tourism industry. On one hand it will encourage increased Union will have a negative impact on the region’s economy.
consumerism, which will translate into greater demand for
outbound tourism. However, cyclical fluctuations in the Chinese JAPAN
economy and ongoing trade tensions will affect consumer
confidence in the near term. Slow economic growth is expected to continue, with forecasts
of 0.6% both for 2019–20 and 2020–21 – well below that of
Against this backdrop, China’s economy is forecast to grow other advanced economies. The main factors slowing growth
6.2% in 2019–20, and 5.8% in 2020–21; substantially lower are a persistently low inflation rate, high government debt and
than during recent periods. a shrinking labor force brought about by an aging population.
Economic prospects are further clouded with the country’s
NZ consumption tax scheduled to increase from 8% to 10% in
October 2019.
Economic growth has been subdued largely due to a cooling
housing market and lower business confidence. This has INDIA
reduced household consumption, including discretionary
spend on tourism. Spectacular growth has been reported in recent years, with
the Indian economy growing 7.4% in 2018. In coming years,
However, there are some positive economic signs with net India is expected to be the fastest growing economy among
exports at record highs and falling unemployment – due in Australia’s top 10 tourism source markets, largely due to its
part to changes in monetary policy. These should support young and rapidly urbanising workforce. The higher economic
growth in consumer spending, with flow-on effects to outbound growth will flow on to wider society, increasing the size of
travel in the medium term. The NZ economy is forecast to grow middle-income groups, and adding to travel propensities.
by 2.5 % in 2019–20 and 2.4% in 2020–21. India’s economy is projected to increase by 7.3% in 2019–20
and in 2020–21.
3 World Economic Outlook, April 2019: Growth Slowdown, Precarious
Recovery, International Monetary Fund
https://www.imf.org/en/Publications/WEOTOURISM FORECASTS 2019
TOURISM RESEARCH AUSTRALIA 15
AUSTRALIA IS ON A SLOWER WORLD OIL PRICES
GROWTH TRACK
World oil prices have dipped from late 2018 highs of over
Despite sluggish wage growth and falling house prices in large US$70 per barrel to range between US$50 and US$60 per
cities, the Australian economy continues to grow. Treasury is barrel through most of 2019 (Figure 12).
expecting the domestic economy to pick up from estimated
growth of 2.3% in 2018–19, to 2.8% in 2019–20 and Trade tensions, a slowdown in China's industrial production
2020–21. and greater energy efficiency in major developed markets have
restrained demand and forced prices down. On the supply
Supporting the economic recovery will be historically low side, US oil production will reach another record high in 2019.
interest rates and the effects of personal income tax offsets. However global oil supply is capped by OPEC members and
The forecasts assume an unemployment rate of 5.0% disruptions in oil producing countries such as Iran, Venezuela
throughout 2019–20 and 2020–21, with wage growth and Libya. On balance, world oil prices are expected to be
expected to improve over the same period. As a result, real around US$60 in the short and medium term.
household consumption is expected to grow from 2.3% in
2018–19, to 2.8% in 2019–20 and 2020–21.
TRA adopts the consensus forecast of the Australian dollar at
US$0.71 in 2019–20 and US$0.74 in 2020–21. This is well
below the annual average rate of US$0.79 over the past five
years, making travel to Australia more attractive to international
markets. This will also drive growth of international visitor
spend in Australia in coming years.
FIGURE 12: WORLD OIL PRICES: HISTORICAL AND FORECASTS
FORECAST
110
100
90
80
US$ PER BARREL
70
60
50
40
30
2008–09
2009–10
2010–11
2011–12
2012–13
2013–14
2014–15
2015–16
2016–17
2017–18
2018–19
2019–20
2020–21
2021–22
2022–23
2023–24
2024–25
2025–26
2026–27
2027–28
2028–2916 TOURISM FORECASTS 2019
TOURISM RESEARCH AUSTRALIA
OTHER INFLUENCES ON THE FIGURE 13: INBOUND AIR CAPACITY: HISTORICAL
AND FORECAST, AVERAGE ANNUAL GROWTH
FORECASTS
AVIATION INDIA
INTERNATIONAL AVIATION
Due to weakening demand for international air travel, growth MIDDLE EAST
in inbound aviation capacity to Australia has slowed. The first
three-quarters of 2018−19 saw a 3.2% increase in inbound
aviation capacity; the slowest growth rate since 2008. INDONESIA
Looking forward, TRA expects inbound air capacity to grow
4.7% in 2019–20 and 2020–21, while a longer term average
annual growth of 4.7% is projected for the period between THAILAND
2018–19 and 2028–29.
SHORT-TERM OUTLOOK FOR AIR CAPACITY CHINA
The growth of inbound air capacity to Australia in 2019–20
and 2020–21 is expected to be below the long-run average
HONG KONG
for a number of key markets, mainly due to higher oil and jet
fuel prices (Figure 13). Despite crude oil prices falling recently,
world prices remain at an elevated level compared to those that
prevailed between 2015–16 and 2016–17. During this earlier US
period, inbound air capacity to Australia grew 14.4%, while
inbound air capacity from China increased 66.2%.
NZ
World oil prices are expected to stay at around US$60 over the
next few years. These higher prices will squeeze international
airlines’ profit margins, leading to slowing capacity growth. In
this environment, some airlines will reduce seat capacity to SINGAPORE
generate higher yields and restore profit margins. Capacity
growth from key markets over the next two years is forecast as
follows (Figure 13): MALAYSIA
nn China to grow 6.1% per year on average, compared to long-
run average growth of 18%
UK
nn Singapore to grow 3.8% per year versus long-run growth of
3.8%
nn Middle East to grow 6.9% versus long-run growth of 12.8% KOREA
nn NZ to grow 3.8% versus long-run growth of 3.3%
nn UK to grow 2.5% per year versus long-run growth of -7.8%.
JAPAN
-10.0% -5.0% 0.0% 5.0% 10.0% 15.0% 20.0%
2008–09 TO 2018–19 2019–20 T0 2020–21TOURISM FORECASTS 2019
TOURISM RESEARCH AUSTRALIA 17
LONG-TERM OUTLOOK FOR AIR CAPACITY ACCOMMODATION
GROWTH
There are a number of markets in which the average annual ACCOMMODATION PERFORMANCE
forecast growth rate between 2018–19 and 2028–29 differs
The accommodation sector remains a key driver for the tourism
from the long-run historical compound annual growth rate over
industry, with a total revenue of $8.6 billion in 2017–18. At the
the previous 10 years.
same time:
The most significant change lies in the China market, which
nn national room supply increased 2.5% to 284,680 rooms
sees the forecast growth rate slow to 6.6% on average between
2018–19 and 2028–29 from average annual growth of 18% nn occupancy rates increased to 76.0%, driven by strong rates
over the previous 10 years. Aside from the economic slowdown across capital cities (79.8%)
in China, the change reflects a large, maturing market,
nn the average daily room rate increased to $188, up $3.40.
where double-digit growth cannot be sustained indefinitely,
particularly given the very high increases in demand over the
last 10 years. Outside of the traditional accommodation sector, the sharing
economy continues to grow across Australia, with almost
The Middle Eastern market will experience a similar pattern 90,000 properties listed on Airbnb in December 2017. The
of change, but causes will differ. Seat capacity for Middle effect of this on the accommodation sector is mixed. While it
Eastern airlines, notably Emirates, Etihad and Qatar, have does compete with traditional accommodation providers, it
grown substantially in the Australian market over many years. helps address gaps in supply during periods of high demand
However, the weakened profitability of these airlines over the and the competitive pricing and diversity of options opens up
past two years may inhibit their abilities to expand capacity in travel to more Australians and overseas visitors.
the short term.
ACCOMMODATION OUTLOOK
By comparison, the India market is expected to grow at a
stronger pace, simply because of a much greater take-up of air The accommodation sector is expected to maintain strength
travel by the country’s middle class, starting with more travel over the next three years on the back of strong investment and
to domestic destinations and then shifting to more overseas demand prospects.
destinations over time.
nn Growth in new capacity is forecast to continue, with more
Many of the South East Asia markets – including Thailand, than 50,000 rooms in the pipeline. Almost 33,000 of these
Singapore and Indonesia – will see long-run growth rates are expected to be added over the next three years – half
reduce as their growth is occurring off a much higher base. of these are expected to be hosting guests by the end of
The Malaysian market will take some time to recover from the 2020.
major air incidents involving two Malaysian Airlines and Air nn New stock will be concentrated in the capital cities,
Asia. especially Perth, Sydney and Melbourne. Almost 6,500
new rooms are expected to come online in Melbourne by
Prospects for the Japanese market are more buoyant, largely 2020 via 32 new properties.
due to the strong and growing interest from Australian residents
travelling to Japan. nn The influx of new supply should see national occupancy
rates fall slightly in 2020 as this wave of new supply enters
DOMESTIC AVIATION the market, before returning to current rates.
nn Even with increased supply, average room rates are
In 2019, about one-quarter of Australian domestic overnight
expected to increase approximately 2.4% per year over the
trips involved air transport. Domestic air capacity influences
next three years, surpassing the $200 mark by 2021.
the business travel segment more than any other travel
segment.
The growth of domestic air capacity has been low since
2013–14, following strong growth during the peak of the mining
boom. In more recent years, major domestic carriers have
reduced seat capacities in order to increase passenger loads
and maintain yields. In this context, TRA expects flat growth
for 2019–20 and 2020–21, before picking up to 3.5% in
2022–23.18 TOURISM FORECASTS 2019
TOURISM RESEARCH AUSTRALIA
5. RISKS 6. DATA SOURCES
TRA’s tourism forecasts represent the most likely outcomes Airport Coordination Australia, S2019 Scheduling
given past trends, current information and the impact of policy
changes. The current information includes macroeconomic Australian Bureau of Statistics
and industrial (mainly aviation and accommodation) forecasts
and sentiment indices, plus external specialist agencies and nn Overseas Arrivals and Departures, May 2019 (ABS Cat. No.
market intelligence. As with all forecasts, any variations in the 3401.0)
assumptions or any disruptive events could produce risks that
nn Tourism Satellite Account, 2017–18 (ABS Cat. No. 5249.0)
may drive tourism forecasts either upward or downward.
A range of uncertainties centre around the global economic Bureau of Infrastructure, Transport and Regional Economics
outlook, which have the potential to pose downside risks to (BITRE)
TRA’s inbound tourism forecasts:
nn Domestic Airline Activity (April 2019 issue)
1. There is considerable uncertainty surrounding China’s
nn International Airline Activity (March 2019 issue)
smooth transition to the consumption and services-driven
growth model. A scenario of much-lower-than expected
growth for China’s economy will not only put risks to Consensus Economics Inc.
consumers’ income, but will also exacerbate capital
outflows. nn Asia-Pacific Consensus Forecasts (various issues)
nn Consensus Forecasts (various issues)
2. The uncertainty about the US-China trading relationship.
Any inward shift in policies towards protectionism through nn Foreign Exchange Consensus Forecasts (various issues)
high tariffs would lower global economic growth by
restraining trade and investment flows. Commonwealth Treasury, Budget Strategy and Outlook
2019–20, Budget Paper No. 1
3. In Europe, any unexpected outcome surrounding the post
Brexit UK-EU negotiation would cast a shadow over the Deloitte Access Economics (DAE), Tourism and Hotel Market
outlook for European economic growth. Outlook, 2019
4. While TRA adopts Consensus Economics’ forecasts of Department of Home Affairs, Overseas Arrivals and Departures
exchange rates and advice from its Tourism Forecasting (unpublished database)
Reference Panel, there is diversity of opinion on the
subject, reflecting varying views on the significance of International Monetary Fund, World Economic Outlook (April
future policy change. Any further interest rate cuts in 2019 issue)
Australia could drive the value of the Australian dollar lower
than what has been assumed, boosting tourism beyond Reserve Bank of Australia
what has been forecast.
Tourism Research Australia (TRA)
5. Major geopolitical events, which are both difficult to predict
and to quantify, will also disrupt underlying assumptions. nn International Visitor Survey – March 2019 Quarterly Results
of the International Visitor Survey
nn Travel by Australians – March 2019 Quarterly Results of the
National Visitor Survey
nn Tourism Investment Monitor, 2018
nn Tourism Forecasts (various issues)You can also read