Fourth Quarter 2020 Earnings Presentation and 2021 Perspectives - GlobeNewswire
←
→
Page content transcription
If your browser does not render page correctly, please read the page content below
Fourth Quarter 2020
              Earnings Presentation
              and 2021 Perspectives

www.pgs.com
Cautionary Statement

     ▪ This presentation contains forward looking information

     ▪ Forward looking information is based on management
       assumptions and analyses

     ▪ Actual experience may differ, and those differences may be material

     ▪ Forward looking information is subject to significant uncertainties
       and risks as they relate to events and/or circumstances in the future

     ▪ This presentation must be read in conjunction with the press release
       for the fourth quarter and preliminary full year 2020 results and the
       disclosures therein

                                                                               -2-
Agenda

  Q4 and preliminary full year 2020 results

  2020 Review and 2021 Perspectives

  2021 Financials

                                              3
Fourth Quarter 2020
              Earnings Presentation
              EVP & CFO Gottfred Langseth

www.pgs.com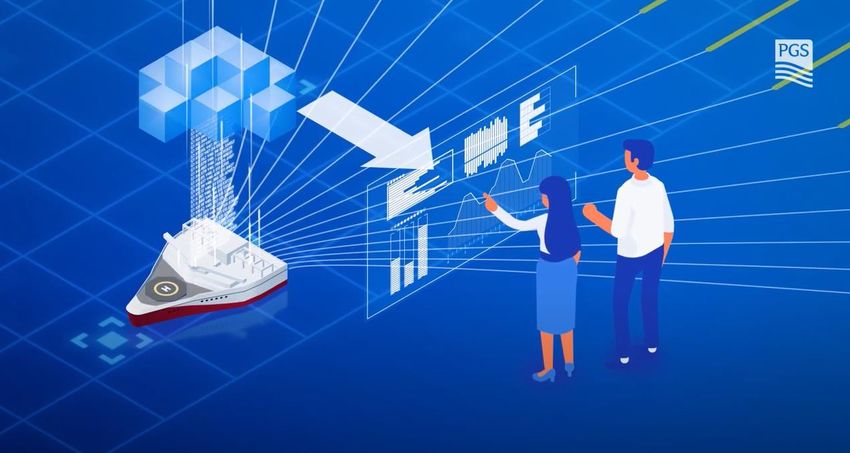
Q4 2020 Takeaways:
Actively Addressing a Challenging Market

                                    ▪ Seismic market remained challenging in Q4
                                          –       Limited new program activity leading to weak vessel utilization
                                          –       Muted client spend due to reduced 2020 budgets

                                    ▪ 70%* sequential revenue increase driven by
                                      MultiClient
                                          –       Usual year-end increase
                                          –       Sales from license round activity in West Africa and Brazil

                                    ▪ Q4 Gross Cash Costs of USD 80.5 million

                                    ▪ Strong order book increase

                                    ▪ Agreements with lenders proceeding towards
                                      completion following Court sanctioning February 2

                                     *Segment revenues excluding government grants relating to Covid-19 pandemic.   -5-
Financial Summary
Segment Revenues Segment EBITDA*
and Other Income
194
300 288 200
245 160
234 155
216 150 136 133 135
198 199 130
USD million
USD million
200 192
168 173
99
142 100 92 88
139
81
116
67
100
50
0 0
100 Segment EBIT** Cash Flow from Operations
200
176
80 70
152
60 150 133
48 122 119
117
USD million
38 108
40
USD million
95
20 100
20 14 18 73
7 68 66
0.5 57
0 50
-3
-20 -16
-23
-29 0
-40
*EBITDA, when used by the Company, means EBIT excluding Other charges, impairment and loss/gain on sale of long-term assets and depreciation and amortization as defined in Note 14 of the Q4 2020 earnings release published on February 4, 2021
**Excluding impairments and Other charges. -6-
Consolidated Key Financial Figures
                                                                                                                                                              Q4                          Q4                            Full year          Full year
                           USD million (except per share data)                                                                                               2020                        2019                             2020               2019
                           Profit and loss numbers Segment Reporting
                           Segment revenues and Other Income                                                                                                         172.8                        288.4                            595.9          880.1
                           Segment EBITDA                                                                                                                            129.6                        194.1                            397.7          556.1
                           Segment EBIT ex. Impairment and other charges, net                                                                                         20.5                         70.1                            12.2           96.4

                           Profit and loss numbers As Reported
                           Revenues and Other Income                                                                                                                 207.7                        332.6                            512.0          930.8
                           EBIT                                                                                                                                     (21.6)                        54.2                           (188.0)          54.6
                           Net financial items, other                                                                                                               (31.3)                       (25.7)                          (118.4)         (92.2)
                           Income (loss) before income tax expense                                                                                                  (52.9)                        28.5                           (306.4)         (37.6)
                           Income tax expense                                                                                                                         (7.4)                      (17.8)                           (15.1)         (34.1)
                           Net income (loss) to equity holders                                                                                                      (60.3)                        10.7                           (321.5)         (71.7)
                           Basic earnings per share ($ per share)                                                                                                  ($0.16)                       $0.03                           ($0.85)        ($0.21)

                           Other key numbers
                           Net cash provided by operating activities                                                                                                 57.1                         94.8                            366.5           474.3
                           Cash Investment in MultiClient library                                                                                                    33.0                         41.3                            222.3           244.8
                           Capital expenditures (whether paid or not)                                                                                                11.4                         17.7                             36.1            59.1
                           Total assets                                                                                                                           2,093.8                      2,301.7                          2,093.8         2,301.7
                           Cash and cash equivalents                                                                                                                156.7                         40.6                            156.7            40.6
                           Net interest bearing debt                                                                                                                937.6                      1,007.5                            937.6         1007.5
                           Net interest bearing debt, including lease liabilities following IFRS 16                                                               1,096.2                      1,204.6                          1,096.2         1,204.6
The accompanying unaudited financial information has been prepared under IFRS. This information should be read in conjunction with the unaudited fourth quarter and preliminary full year 2020 results, released on February 4, 2021.                     -7-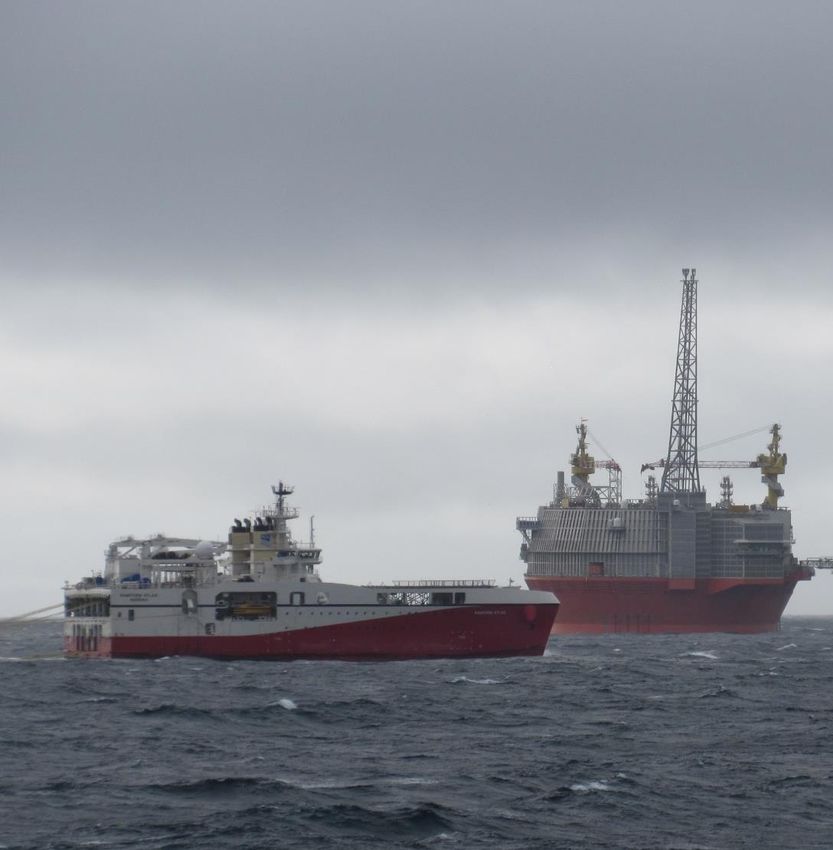
Impairments and Other Items Impacting Q4 Financials
▪ Impairments
   – USD 30.0 million of impairments on seismic vessels
       • Primarily driven by increase of WACC used for impairment testing to 12%
   – MultiClient impairment of USD 18.2 million

▪ Government grants reported as Other Income
   – Recorded USD 15.5 million in Q4 of estimated government grants for September – December
   – USD 23.2 million recorded in Q3 relating to March – August

▪ Agreement to re-schedule debt
   – All debt involved classified as short term at December 31, 2020 pending sanctioning by the UK Court
   – Will be re-classified in Q1
   – Deferred debt issuance cost relating to the refinancing in Q1 2020 charged to expense in Q4, USD
     4.2 million

                                                                                                           8
Q4 2020 Operational Highlights
Contract revenues Segment MultiClient revenues
200 200%
120.0 100%
104 90%
100.0 94
80% 150 150%
85
70%
USD million
76 69
80.0
USD million
56 54 113
164
60%
100 84
70 100%
60.0 50% 46
36
45 41 44 40%
40.0 34 28
31 61 34
30 30%
50 94 96 95 50%
21
20% 67 65 66
20.0 59 61
9 50
10% 34 41
30
0.0 0% 0 0%
Q1 18 Q2 18 Q3 18 Q4 18 Q1 19 Q2 19 Q3 19 Q4 19 Q1 20 Q2 20 Q3 20 Q4 20 Q1 18 Q2 18 Q3 18 Q4 18 Q1 19 Q2 19 Q3 19 Q4 19 Q1 20 Q2 20 Q3 20 Q4 20
Contract revenues % active 3D capacity allocated to contract MultiClient pre-funding MultiClient late sales Pre-funding as % of MC cash investments
Targeted pre-funding level 80-120%
▪ Contract revenues of USD 20.8 million ▪ Total Segment MultiClient revenues of USD
– 8% of total time used for Contract acquisition 131.1 million
– Pre-funding level of 185% impacted by sales of
surveys in the processing phase
– Late sales of USD 70.1 million
-9-
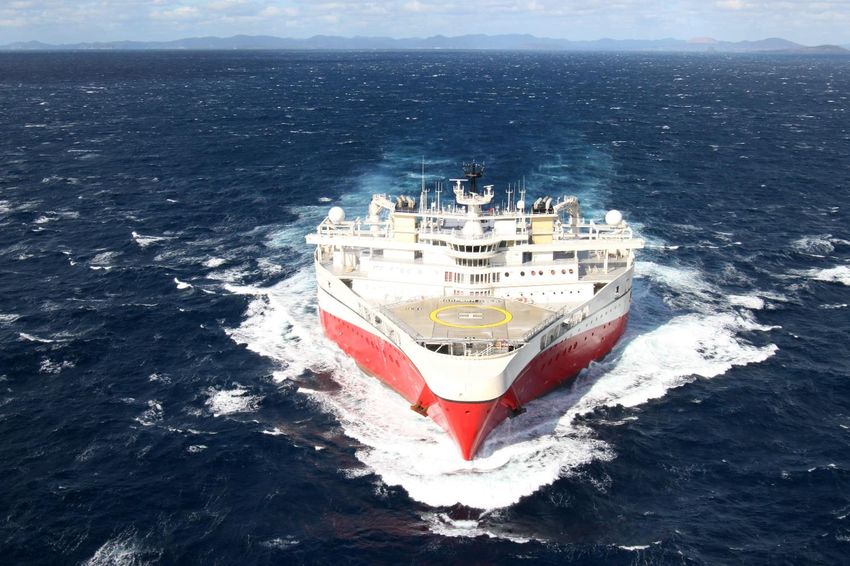
Seismic Streamer 3D Fleet Activity in Streamer Months:
 Vessel Allocation* and Utilization
                                                     Quarterly vessel allocation

   100%

    80%

                                                                                                                                    ▪ 49% active vessel time in Q4 2020
    60%

                                                                                                                                        – 5 active vessels

    40%

                                                                                                                                    ▪ Utilization will improve significantly in
                                                                                                                                      Q1 2021
    20%

     0%
             Q1 18      Q2 18      Q3 18     Q4 18         Q1 19       Q2 19   Q3 19     Q4 19     Q1 20    Q2 20   Q3 20   Q4 20

                                        Contract         MultiClient     Steaming      Yard      Stacked/Standby

* The vessel allocation excludes cold-stacked vessels.
                                                                                                                                                                                  -10-
Balance Sheet Key Numbers As Reported
December 31 December 31
USD million 2020 2019
Total assets 2,093.8 2,301.7
MultiClient Library 616.1 558.6
Shareholders' equity 396.4 637.1
Cash and cash equivalents (unrestricted) 156.7 40.6
Restricted cash 76.6 43.0
Liquidity reserve 156.7 210.6
Gross interest bearing debt 1,170.9 1,091.1
Gross interest bearing debt, including lease liabilities following IFRS 16 1,329.5 1,288.2
Net interest bearing debt 937.6 1,007.5
Net interest bearing debt, including lease liabilities following IFRS 16 1,096.2 1,204.6
▪ Liquidity reserve of USD 156.7 million held in cash
▪ MultiClient library of USD 616.1 based on IFRS - USD 546.4 million according to Segment Reporting
▪ All interest-bearing debt, excluding lease liabilities, classified as current at year-end 2020 pending
finalization of the debt rescheduling
– Will be re-classified to long term when completed in Q1 2021
The accompanying unaudited financial information has been prepared under IFRS. This information should be read in conjunction with the unaudited fourth quarter and preliminary full year 2020 results released on February 4, 2021. -11-Consolidated Statements of Cash Flows Summary
Q4 Q4 Full year Full year
USD million 2020 2019 2020 2019
Cash provided by operating activities 57.1 94.8 366.5 474.3
Investment in MultiClient library (33.0) (41.3) (222.1) (244.8)
Capital expenditures (9.0) (11.6) (32.8) (62.0)
Other investing activities (18.0) (3.0) 0.3 54.3
Net cash flow before financing activities (2.9) 38.9 111.9 221.8
Net proceeds from issuance of debt - - 124.2 -
Interest paid on interest bearing debt (19.1) (18.0) (73.7) (60.9)
Repayment of interest bearing debt - (12.7) (240.3) (51.2)
Net change drawing on RCF - 10.0 170.0 (85.0)
Payment of lease liabilities (recognized under IFRS 16) (12.8) (13.6) (53.8) (58.6)
(Increase) in non-current restricted cash related to debt service (2.2) - (14.1) -
Proceeds from share issue - - 91.9 -
Net increase (decr.) in cash and cash equiv. (37.0) 4.6 116.1 (33.9)
Cash and cash equiv. at beginning of period 193.7 36.0 40.6 74.5
Cash and cash equiv. at end of period 156.7 40.6 156.7 40.6
▪ Cash flow reduction driven by lower revenues
▪ Working capital impacted by ~USD 30 million of Q2/Q3 sales with payment agreed early 2021. Will benefit
Q1 2021
▪ Q4 “Other investing activities” includes a legal deposit of USD 17.7 million relating to a tax case in Brazil
The accompanying unaudited financial information has been prepared under IFRS. This information should be read in conjunction with the unaudited fourth quarter and preliminary full year 2020 results released February 4, 2021. -12-2020 Review
2021 Perspectives
President & CEO Rune Olav Pedersen
www.pgs.com2020 Review – Navigating Through Market Disruptions
1000
PGS Segment Revenues
900 ▪ 2020 developed very differently than
800
expected
700 37%
▪ 37%* revenue reduction caused by Covid-
USD million
600
19 pandemic
500
400
▪ Swift PGS response:
300
– Substantial cost reduction
200
– 50% CAPEX reduction
100
– Two-year maturity extension and
0 amortization holiday on debt
2019 2020
90
PGS capex reduction 700 PGS cost reduction ▪ Strong vessel and Imaging project execution
80
70
600
500 33%
despite Covid-19 restrictions and challenges
~50%
USD million
60
400
50
40
30
300
200
▪ Digital transformation milestones delivered
20
100
10
▪ Capitalizing on integrated offering
0 0
2020 initial plan Actual 2020 capex 2020 Initial Plan Annualized run rate from Q3 2020
with 5 vessels
*Segment revenues excluding government grants relating to the Covid-19 pandemic
14Improving Cash Flow Triggers Increased Spending
80
Brent blend
60
▪ Current oil price and outlook supports
USD/boe
40
market recovery
20
▪ Cash flow positive with a Brent blend
price above USD 50/bbl
0
30-12-2019 30-04-2020 31-08-2020 31-12-2020
160 Oil Majors cash flow break even*
▪ Seismic spending expected to
140
increase gradually in 2021 vs. 2020
120 – Slow increase of overall E&P spending
100 expected in 2021**
USD/boe
80 – Seismic typically an early cycle mover
60 e.g. 2018 offshore E&P dropped ~7%
40 and seismic spending increased
20 ~5%***
0
2013 2014 2015 2016 2017 2018 2019 2020 2021 2022
Break even oil price Break even oil price after capex and dividend Brent oil price
*Source: SB1 Markets and FactSet. Majors included are Equinor, ENI, BP, Total, Shell, Repsol, Chevron, Exxon, ConocoPhillips.
**Average estimates from recent E&P spending reports published by Barclays, DNB, SB1 Markets and SEB.
**Source: Average estimates from E&P spending reports published by Barclays, SEB, DNB, Pareto Securities, SB1 Markets and JPMorgan. See PGS CMD 2020 presentation slide 16. 15Increasing 2021 Contract Leads Volume
2500
▪ Bids and leads withdrawn from the market in
2000
2020 re-emerging for execution in 2021
1500
USD million
▪ Industry order books increasing
1000
▪ Increasing 4D tender activity
500
▪ Majority of PGS 2021 vessel capacity
0
allocated to Contract acquisition
Active Tenders Marine Contract All Sales Leads Marine Contract (Including Active Tenders)
PGS In-house Contract Bids+Leads
Contract bids to go (in-house PGS) and estimated $ value of bids + risk weighted leads as of end September 2020
16Increasing Order Book
300
▪ Order book of USD 202 million on
December 31, 2020
– USD 89 million relating to MultiClient
200 – Further backlog added after quarter-end
USD million
▪ Vessel booking*
– Q1 21: 15 vessel months
100
– Q2 21: 13 vessel months
– Q3 21: 10 vessel months
0
*As of January 30, 2021. -17-Fundamentals Intact for Cash Flow Generation
7000 Consolidated marine seismic revenues*
▪ 2020 was a likely low point for the
6000
marine seismic industry
5000
USD million
4000 70%
3000
▪ Seismic supply continuously reduced
2000
– Approaching balancing point into 2021
1000
summer season
0
▪ PGS operating cost significantly down
2013 2014 2015 2016 2017 2018 2019 2020
700 Industry streamer capacity 1200 PGS gross cash cost
600 1000 ▪ Energy transition expected to impact
500
800
>60% seismic revenue potential
~60%
– However, oil & gas will continue to be a
USd million
400
300
600
large part of the energy mix
400
200
100 200 ▪ No need for 2013 demand-level to
0 0
generate healthy future cash flow
2013 2014 2015 2016 2017 2018 2019 2020 2013 2014 2015 2016 2017 2018 2019 2020
*Including PGS, WesternGeco, CGG, Fugro, Polarcus, Dolphin Geophysical, Shearwater Geoservices and TGS. Estimate for Polarcus 2020 revenues. ABG Sundal Collier provided historical numbers for Fugro and Dolphin Geophysical. 18Integrated Services Position PGS for Energy Transition
▪ Energy transition drives oil companies
to focus on producing fields and
proven hydrocarbon basins
▪ Seismic market is developing towards
Field
more near-field exploration and 4D
Development,
Monitoring and
reservoir optimization
Near-Field Optimization:
Exploration: Production 4D
3D Contract seismic and
Targeted
work and 3D
MultiClient
reservoir
monitoring
▪ Access to high-capacity vessels and
Exploration: projects with
High-density strong pre- differentiating technology is
3D MultiClient funding
fundamental to the growing
Frontier 4D reservoir segment
Exploration:
2D and 3D
MultiClient
work
LOW Importance of vessels and technology HIGH
19Marine Seismic Market Leadership Through Integrated Service Offering
PGS Business Strategy
Leadership in production (4D) seismic
Joint Contract and MultiClient approach
Grow MultiClient in proven hydrocarbon areas with high pre-funding
Optimize operating cost & efficiency
R&D focus on digital solutions for imaging and acquisition
20Leadership in Production (4D) Seismic:
Proven 4D Technology Differentiation and Customer Adoption
30 Number of companies with 4D experience
25
▪ The number of companies applying 4D to one or more fields
20 have increased 5-fold
15
▪ PGS acquired the world’s largest 4D baseline survey in 2019
10
5
▪ All new major discoveries now generally considered for 4D
production optimization early in the development cycle
0
2008 2009 2010 2011 2012 2013 2014 2015 2016 2017 2018 2019 2020 2021
Est
30
Number of towed streamer 4D surveys
25
▪ Multi-sensor technology dominates the towed streamer 4D
20 seismic segment
15
▪ GeoStreamer® technology regarded by major oil companies
10
as the benchmark 4D acquisition system
5
▪ 4D surveys shot with multi-sensor baselines, remain multi-
0
sensor throughout the 4D campaign life-cycle
2011 2012 2013 2014 2015 2016 2017 2018 2019 2020 2021 Est
Multi-sensor Conventional
21Joint Contract and MultiClient Approach:
Mediterranean Success with Integrated Service Offering
▪ Manifesting PGS leading position in Egypt by
securing 15 vessel months of Titan-class acquisition
– Multiple surveys acquired under PGS MultiClient permit
– One large survey acquired as a Contract program
▪ Programs primarily cover held acreage awarded in
recent license round
– Acquisition commenced shortly after block ratification
providing significant timing advantage
▪ Integrated service offering makes PGS agnostic to
the MultiClient or Contract business model
– Playing across both models delivers the best
commercial value for the client and PGS
▪ Will have two vessels in Egypt well into Q2 2021
22Joint Contract and MultiClient Approach:
Integrated Service Offering Maintains PGS Position as a Key Player in Angola
▪ PGS is a trusted industry partner in Angola with a long-
standing track record of commitment and investment
▪ Integrated service offering spans the E&P seismic value chain:
‒ Exploration 3D supports License Rounds, leveraging MultiClient
agreement delivers a substantial acceleration of project timelines
to explore faster
‒ Near-field exploration 3D in mature producing basins helps
stimulate renewed exploration activity with low marginal costs per
barrel
2019
2020
‒ Reservoir/4D optimization, delivers short-cycle ROI
2021
2023
2025
23Grow MultiClient with High Pre-funding: PGS MultiClient Library PGS MultiClient data library comprise of > 950 000 sq.km MC3D ~ 580 000 km MC2D > 900 000 sq.km MegaSurvey
Grow MultiClient with High Pre-funding:
PGS MultiClient Library – Potential Areas of Activity 2021
                                                        Norway
                                                        − APA 2020 awards announced
                                                        − 25th License Round – mainly blocks in the Barents Sea
                                                        − Tax changes support investment

                                                   Canada
                                                   − Call for Bids
                                                     Labrador South

                                                                                                                                   Egypt
 US GoM?                                                                                                                           − Exploration deals
 − Uncertainty of Lease Sale 257 – Mar 2021                                                                                          with 9 E&P Co’s to
 − 14,954 unleased blocks in Western &                                                                                               spend USD 1bn &
   Central areas                                                                                                                     17 wells.                                   Malaysia
                                                                                                                                                                                 − Sabah MBR2021
                                                                            Trinidad & Tobago                                                                                    − Sarawak MBR2021
 Brazil
                                                                            − LR for DW blocks
 − 17th Round - Oct 2021                                                                                          Nigeria
 − New frontier basins model (“regional blocks”)                                                                  − Potential 2021 DW licensing
 − Petrobras asset divestment creates opportunity for                                                               round                                                          Timor-Leste
   E&P Co’s                                                                                                       − PIB moving forward                                             − 2nd Licensing Round
 − Petrobas new investment strategy for Equatorial
   Margins                                                                                                            Angola
                                                                                                                      − Limited Public Tenders
        Potential acreage in license                                                                                    for several DW blocks
        rounds 2020-2021                                                                                                in 2021

                                                                                                                            South Africa                  Australia
                                                                                                                            - Luiperd discovery affirms   − 42 release areas, bidding
                                                                                                                            new basin floor play            open until June

    PGS MultiClient data library comprise of > 950 000 sq.km MC3D ~ 580 000 km MC2D > 900 000 sq.km MegaSurvey
Grow MultiClient with High Pre-funding:
PGS MultiClient Library – Potential Areas of Activity 2021 and PGS 2020 MC Projects
Norway
− APA 2020 awards announced
− 25th License Round – mainly blocks in the Barents Sea
− Tax changes support investment
Canada
− Call for Bids
Labrador South
Egypt
US GoM? − Exploration deals
− Uncertainty of Lease Sale 257 – Mar 2021 with 9 E&P Co’s to
− 14,954 unleased blocks in Western & spend USD 1bn &
Central areas 17 wells. Malaysia
− Sabah MBR2021
Trinidad & Tobago − Sarawak MBR2021
Brazil
− LR for DW blocks
− 17th Round - Oct 2021 Nigeria
− New frontier basins model (“regional blocks”) − Potential 2021 DW licensing
− Petrobras asset divestment creates opportunity for round Timor-Leste
E&P Co’s − PIB moving forward − 2nd Licensing Round
− Petrobas new investment strategy for Equatorial
Margins Angola
− Limited Public Tenders
Potential acreage in license for several DW blocks
rounds 2020-2021 in 2021
2020 PGS MC surveys South Africa Australia
- Luiperd discovery affirms − 42 release areas, bidding
new basin floor play open until June
PGS MultiClient data library comprise of > 950 000 sq.km MC3D ~ 580 000 km MC2D > 900 000 sq.km MegaSurveyGrow MultiClient with High Pre-funding:
Diversity Hedges Market Uncertainty
Net book value Segment Reporting Q3
2020 Segment revenues LTM Q4 2020 160 Total MultiClient Segment Revenues
140
120
USD million
100
80
60
40
20
0
PGS Peer group (TGS, WG, CGG) Q1 20 Q2 20 Q3 20 Q4 20
PGS Peer group (TGS, WG, CGG)
PGS TGS WG CGG
800 Revenue / investment ratio 3.0 Total MultiClient Segment Revenues
400 Continued strong pre-funding levels 160% 1000
700
2.5 Revenues / Investment ratio 350 140%
600 800
300 120%
2.0
500
USD million
250 100%
Pre-funding %
600
USD million
USD million
400 1.5
200 80%
300 400
1.0 150 60%
200
100 40%
0.5 200
100 50 20%
0 0.0 0 0%
2013 2014 2015 2016 2017 2018 2019 2020 0
2013 2014 2015 2016 2017 2018 2019 2020 2018 2019 2020
Segment revenues Cash investments
Segment revenues / Cash investments Segment pre-funding Late sales Pre-funding % rhs PGS TGS WG CGG
27Grow MultiClient with High Pre-funding:
Segment Total MultiClient Revenues by Region
225
200
▪ Africa and Middle East
175
main contributors to
150 pre-funding revenues
USD million
125
in 2020
100
▪ Europe and Africa main
75
contributors to late
50 sales revenues in 2020
25
0
Q1 Q2 Q3 Q4 Q1 Q2 Q3 Q4 Q1 Q2 Q3 Q4 Q1 Q2 Q3 Q4 Q1 Q2 Q3 Q4 Q1 Q2 Q3 Q4 Q1 Q2 Q3 Q4 Q1 Q2 Q3 Q4
13 13 13 13 14 14 14 14 15 15 15 15 16 16 16 16 17 17 17 17 18 18 18 18 19 19 19 19 20 20 20 20
Europe Africa Middle East N. America S. America Asia Pacific
28Low Exposure to Gulf of Mexico
PGS Segment MultiClient revenues from Gulf of Mexico
20
▪ Annual revenues from Gulf of Mexico account
18 for 1-3% of total annual MultiClient revenues
16
over the period 2016-2020
14
▪ PGS has not acquired seismic data in Gulf of
12 Mexico since 2014
USD million
10
8 ▪ Segment MultiClient book value of PGS GoM
data library of USD 19.2 million as of
6
December 31, 2020
4 – Relate to Flex Vision reprocessing from 2018-
2
2020
0
2016 2017 2018 2019 2020
29Solid MultiClient Geographic Diversity and Client Mix
15% 12%
Client 1 spending > $20m Africa
23%
27%
7% Asia
Client 2 spending > $20m
13% Europe
Client 3 spending > $20m
12%
9% Middle East
8 Clients each spending $10-20m
12% North America
6% 7 Clients each spending $5-10m
South America
34% 64 Clients each spending < $5 million 30%
Sold MultiClient data to >80 different clients in 2020 with good geographical sales
diversity
30Progressing on Digital Transformation to Accelerate Strategy Execution
▪ Substantial progress on Cloud based MultiClient
sales platform and plan to launch during first
half 2021
– Strategic partnership with TGS and CGG for a
shared MultiClient market place announced
▪ Tangible results in optimizing vessel operations
– Energy efficiency and optimal vessel speed
– Predictive maintenance
– Improved HSEQ
▪ Imaging in the Cloud
– Machine learning to assist imaging and
accelerate data delivery
– Flexible and scalable compute and lower capex
exposure
312021 Guidance
▪ Group gross cash cost to be below USD 400 million
– With 5 active vessels
▪ MultiClient cash investments of ~USD 150 million
– ~45% of 2021 active 3D vessel time allocated to MultiClient
▪ Capital expenditures of approximately USD 40 million
-32-Summary
▪ Proactively addressing a challenging 2020 seismic
market
▪ 2021 likely to show recovery
– Higher oil price
– Positive cash flow among majors
– Deferred activity from 2020
▪ Positioned for earnings improvement with low cost
and lowest industry supply for decades
▪ Integrated service offering position PGS for energy
transition
▪ Digital transformation to accelerate strategy
execution
332021 Financials
EVP & CFO Gottfred Langseth
www.pgs.comFinancial Strategy
Profitability before Return on Capital Capital structure to
growth Employed sustain future downturns
Focus on profitability and ROCE targeted to be Debt reduction from cash
cash flow higher than cost of capital flow in an improving market
over the cycle
Debt reduction prioritized Targeting a net debt level
over growth not to exceed USD 500-600
million*)
Financial Strategy Remains Unchanged
2020 developments extend the expected time to achieve targeted capital structure
*) Amount does not include debt relating to capitalized leases (Ref. IFRS 16). The target, including debt relating to leases, is net debt level not to exceed USD 600-700 million 35Extension of all Debt Maturities and Amortizations to September 2022
▪ In Q4 2020 amendments agreed with all parties to the Export Credit Facilities (ECF) and all
but one lender to the Revolving Credit and Term Loan B Facilities (RCF, TLB)
– A Scheme of Arrangement required to make the amendments effective for all lenders
– Scheme sanctioned by the UK Court on February 2, 2021
– Expect to close/implement all agreements during February 2021
▪ Deferral of all scheduled debt maturities and amortizations to September 2022 and beyond
▪ Fees to lenders:
– USD 8.0 million of cash fees to lenders
– USD 8.4 million of PIK (payment in kind) fees (fees added to loan balance and repaid with the loan)
▪ NOK 116.2 million Convertible Bond to be issued to lenders
– NOK 67.1 (~USD 7.9) million settled by conversion of corresponding RCF/TLB amount
– NOK 49.1 (~USD 5.8) million against cash payment to PGS
36Main Terms of the Transaction
▪ No scheduled debt maturities until September 2022
– The $350 million RCF(1) to be converted into a new TLB on the same terms as the 2024 TLB
– The 5% annual amortization in 2021 and 2022 on the existing 2024 TLB is removed
– The combined TLB facilities of ~$873 million(2) maturing in March 2024 will have following amortization profile:
• ~$135 million amortization payment in September 2022
• $200 million amortization payment in September 2023
• ~$9 million quarterly amortization starting March 2023
– ECF amortization totalling ~$106 million due over the next two years deferred and repaid over four quarters starting December 2022
▪ Excess liquidity sweep
– Excess liquidity sweep for liquidity reserve above $200 million at each quarter end to be applied to the deferred amortization amounts under the ECF and the ~$135
million TLB amortization until both have been repaid
– Thereafter, excess liquidity sweep for liquidity reserve above $175 million to be applied against the remaining TLB
▪ Financial maintenance covenants
– Maximum net leverage ratio of 4.5x through June 30, 2021, 4.25x through December 31, 2021, 3.25x through December 31, 2022 and 2.75x thereafter
– Minimum liquidity reserve of $75 million
▪ Convertible Bond
– Issuance of a NOK 116.2 million 3-year 5% unsecured convertible bond (the “CB”) convertible into new PGS shares at NOK 3 per share (maximum of 38,720,699
shares/10% of the currently outstanding shares)
– PGS can require that bondholders convert the CB into shares if the PGS share price exceeds NOK 6 for 30 consecutive trading days
▪ Other
– Fees to lenders of $8.0 million payable in cash and USD 8.4 million payable in kind (excludes costs for legal and financial advisors for PGS and the lender groups)
– Strengthening of security package
(1) $135 million maturing September 2020 and $215 million maturing September 2023
(2) Includes increase in principal due to payment-in-kind fees and reduction in principal due to lenders electing to exchange part of their existing debt into convertible bonds. The net effect of these two adjustments is not material
37Rescheduled Debt Maturities to Preserve Liquidity
Pre-existing amortization profile New amortization profile
USD millions USD millions
600 600
14
47
500 500
47
400 400
300 300 138
47
501
26 439
200 200
24 28
3
237
100 215 100
215
135 135
47
24 24 42 42
26 13 13 26 18 26 18
0 0
2H 20 2021 1H 22 2H 22 2023 2024 2025 2026 2027 2H 20 2021 1H 22 2H 22 2023 2024 2025 2026 2027
2020 RCF 2023 RCF TLB ECF TLB ECF CB
▪ Quarterly excess liquidity sweep above USD 200 million to TLB and ECFs until the first USD 135 million amortization for TLB and deferred
amortizations for ECFs are repaid in full
▪ Thereafter, TLB to benefit from a quarterly excess liquidity sweep above USD 175 million, which will replace the current excess cash flow sweep
38IFRS 16 Lease Liability
▪ Leasing arrangements are reported as assets (and depreciated over the lease term) and debt (with
payments being reported as interest cost and instalments)
▪ New leasing arrangements, or extensions of existing arrangements, will be reported as part of CAPEX
Estimated amortization table based on existing agreements Composition of December 31, 2020 lease liability
Year Lease liability Instalment Interest
(start of year)
2021 ~$159M ~$40M ~$9M
2022 ~$119M ~$39M ~$6M
2023 ~$80M ~$35M ~$4M
2024 ~$46M ~$23M ~$1M
2025 ~$23M ~$13M ~$1M
2026 ~$9M ~$4M ~$1M
Thereafter ~$5M ~$1M Vessels Office/Other USD NOK Other
39Cost* Focus Delivers Results
Gross cash cost ex. steaming deferral
156 156 154
148
154 154 ▪ Q4 2020 cost benefited from
150
142
136 136 cost initiatives implemented
and was impacted by low
110
survey activity
USD million
100
82 80
▪ Q4 2020 cost below run-rate
level
50
– Sequential increase expected
in Q1 2021
– Utilization of the 5 active
-
Q1 18 Q2 18 Q3 18 Q4 18 Q1 19 Q2 19 Q3 19 Q4 19 Q1 20 Q2 20 Q3 20 Q4 20
vessels increased early Q1
Cost of Sales Research and development costs Selling, general and administrative costs
*Gross cash cost are defined as the sum of reported net operating expenses (excluding depreciation, amortization, impairments, deferred steaming and Other charges) and the cash operating costs capitalized as investments in the MultiClient library as wel l as capitalized development costs”
-40-Gross Cash Cost Development
Gross cash cost
700 ▪ 2020 gross cash cost of USD 426 million
600 580 – Down from ~USD 600 million initial plan
500
426
▪ 2021 gross cash cost below USD 400 million
USD million
400
300 – Assuming 5 active vessels
200
100 ▪ Continuously assessing cost
0
2019 2020 2021 E
The 2020 gross cash cost estimate is based on operating the currently 5 active vessels and market prices as of early 2021, including a brent oil price of ~$55 per barrel and a NOK/USD exchange rate of ~8.55
41Capital Expenditure and Depreciation Trends
CAPEX excluding new build capex for earlier years
70
▪ Full year 2020 CAPEX of USD 36 million
60
50 ▪ 2021 CAPEX plan of ~USD 40 million*
– ~USD 20 million in streamer investments,
USD million
40
including next generation GeoStreamer
30
20
▪ Gross depreciation cost expected to be
10
~USD 150 million in 2021
– ~ USD 50 million to be capitalized as part of
0
2015 2016 2017 2018 2019 2020 2021 E MultiClient investments
Seismic equipment Vessel upgrades/yard Processing equipment/compute infrastructure Other
* CAPEX guidance excludes any capitalized asset as a result of new or extended lease arrangements recognized in accordance with IFRS 16. As of today no material changes are committed or planned -42-2021 MultiClient Financials
180% Pre-funding/MC investments
160%
▪ Pre-funding (as a percent of MultiClient
140% cash investments) targeted to be 80-120%
120%
100%
▪ 2020 MultiClient cash investments of USD
80% 155%
125%
140% 222.3 million with a pre-funding level of
60% 119% 121%
40%
110%
97%
84%
102% 105%
98% 98%
20%
0% ▪ MultiClient cash investments in 2021
2010 2011 2012 2013 2014 2015 2016 2017 2018 2019 2020
Targeted pre-funding level 80-120% expected to be approximately USD 150
400 Marine MultiClient investment
million
350
300 ▪ Approximately 45% of 2021 active 3D fleet
250 capacity currently planned for MultiClient
USD million
200
373
344
150 297 303
277
243
▪ 2021 Segment MultiClient amortization
213 222
204
100
166
201
expense expected to be approximately USD
50
275 million
-
2010 2011 2012 2013 2014 2015 2016 2017 2018 2019 2020 2021 E
-43-PGS’ Tax Position
40
PGS' income taxes paid in MUSD ▪ Tonnage Tax regimes
(cash flow statement)
– PGS’ Ramform Titan-class vessels are operated
35 within the Norwegian tonnage tax regime
▪ Current tax/cash tax has typically been in the range
30
25
of USD ~10-35 million annually
– Mainly withholding taxes and local taxation in
USD million
20 countries of operation where PGS has no tax losses
to utilize
15
– Will vary depending on area of operation
10
▪ Substantial deferred tax assets
5
– 100% valuation allowance
0
2014 2015 2016 2017 2018 2019 2020
-44-Foreign Exchange and Sensitivity
CASH FLOW RELATING TO OPERATING PAYMENTS
OTHER
EUR
GBP
▪ A significant portion of operating payments
(cash cost and CAPEX) is in non USD currencies
USD
– A 10% change of USD vs. NOK has an annual net
EBIT impact of USD 10-12 million
NOK
– A 10% change of USD vs. GBP has an effect of USD
5-6 million
CASH FLOW RELATING TO OPERATING RECEIPTS
OTHER
▪ Leasing commitments in NOK generally
NOK
not hedged
.
Assuming NOK/USD of 8.55 and NOK/GBP of 11.67 USD -45-Summary
▪ Extended debt maturities and amortizations to
September 2022 and beyond
▪ Focus on cash flow to reduce debt
▪ Cost and CAPEX discipline
46Questions? www.pgs.com
Appendix
  Main Yard Stays* Next Six Months

                                     Vessel    When      Expected   Type of Yard
                                                         Duration   Stay

                                     Ramform   Q2 2021   19 days    7.5 year docking
                                     Atlas

*Subject to changes                                                                    -48-
Appendix:
Summary Terms of the Transaction (1)
Heading ECF TLB (including former 2020 RCF and former 2023 RCF)
▪ Deferral of quarterly amortization starting from Sep-20 ▪ The $135m RCF due 2020, the $215m RCF due 2023 and the c.$2m TLB due 2021 will each be converted into
until and including Sep-22 (total of $106m) with regular a new TLB on the same terms as the c.$520m 2024 TLB with the post transaction total debt under these credit
quarterly amortizations to resume from Dec-22 facilities of $873m (2) maturing in March 2024 with the following amortization profile payable pro-rata to all TLB
lenders:
– Deferred amounts to be repaid on earlier of (i)
Repayment refinancing of $200m TLB amortization payment and - $135m amortization payment due in September 2022
schedule (ii) four quarterly payments from Dec-22 to Sep-23
amendments - $200m amortization payment due in September 2023
- $9m quarterly amortization starting March 2023
▪ Quarterly amortization payments of up to 5% per year of original principal amount of the ~$520m 2024 TLB due
until December 2022 will be deferred and replaced by the new amortization schedule described above
▪ ECF to benefit from share of excess liquidity sweep ▪ Current excess cash flow sweep to be replaced by excess liquidity sweep
together with TLB Lenders (see under TLB)
▪ From first quarter-end post-closing to full repayment of deferred amounts for ECFs and the first $135m TLB
amortization, quarterly excess liquidity sweep of any amount above $200m liquidity to be used to repay TLB
Excess and ECF deferred amounts (to be allocated pro rata based on outstanding amount at the time of (i) $135m TLB
liquidity amortization due Sep-22 and (ii) accumulated deferred amortizations for ECFs)
sweep
▪ Following full repayment of deferred amounts for ECFs / $135m TLB amortization, quarterly excess liquidity
sweep of any amount above $175m liquidity for repayment of TLB only
▪ All liquidity sweep applied against amortizations in a chronological order
Notes:
1. Only main economic terms shown
2. Includes increase in principal due to payment-in-kind fees and reduction in principal due to lenders electing to exchange part of their existing debt into convertible bonds. The net effect of these two adjustments is not material.
49Appendix:
Summary Terms of the Transaction (1)
Heading ECF TLB (including former 2020 RCF and former 2023 RCF)
▪ Unchanged ▪ 2021 TLB / 2020 RCF / 2023 RCF margins amended to equal current 2024 TLB terms (see below)
▪ Accrued default interest waived ▪ Accrued default interest waived
Applicable Margin for Term Loans(2)
Total Gross Leverage Ratio ABR Loans Term Loan LIBOR Rate Loans
Interest
≤ 1.25x 5.00% 6.00%
> 1.25x,
5.50% 6.50%
≤ 1.75x
> 1.75x 6.00% 7.00%
▪ Strengthening of security package through, among other things, new intermediate holding companies share pledges and enhanced asset security
Security
▪ Financial covenants to apply to both TLB and ECF (the latter until repayment of the deferred amortization amount)
▪ $75m minimum liquidity covenant (at all times, reported quarterly)
Financial
Covenants ▪ Quarterly net leverage covenant re-profiled as follows: i. 4.50x until 30-Jun-21 (inclusive), ii. 4.25x until 31-Dec-21 (inclusive), iii. 3.25x until 31-Dec-22 (inclusive), iv. 2.75x
thereafter
▪ Financial covenant breach capable of cure through equity injection
Notes:
1. Only main economic terms shown
2. In addition, for so long as the corporate rating of the Norwegian Borrower is not at least B3 and B- from Moody’s and S&P, respectively (in each case with a stable outlook), the Applicable Margin with respect to the Term Loans shall be 6.50% for ABR Loans and 7.50% for LIBOR
Loans (it being understood that the pricing grid above will not apply). For so long as the corporate rating of the Norwegian Borrower is at least B3 and B- from Moody’s and S&P, respectively (in each case with a stable outlook) but not at least B2 and B from Moody’s and S&P,
respectively (in each case with a stable outlook), the Applicable Margin with respect to the Term Loans shall not be lower than 5.50% for ABR Loans and 6.50% for LIBOR Loans (it being understood that if Level I in the above chart would otherwise apply, Level II shall apply
instead). Each change in the Applicable Margin pursuant to the foregoing sentence with respect to the Term Loans shall be effective on and after the first Business Day following a public announcement by Moody’s and/or S&P of a change in the corporate rating of the Norwegian
Borrower that would give rise to any required change in the Applicable Margin with respect to the Term Loans. Notwithstanding the foregoing, for so long as the Norwegian Borrower is unable to obtain ratings, then the Applicable Margin with respect to the Term Loans shall be
6.50% for ABR Loans and 7.50% for LIBOR Loans
50Appendix:
Summary Terms of the Transaction (1)
Heading ECF TLB (including former 2020 RCF and former 2023 RCF)
▪ 25bps early bird fee lenders who sign Consent and ▪ 25bps early bird fee payable at closing on all amounts locked-up at closing to lenders who sign Lock-up
Amendment Agreement by applicable early bird fee Agreement by applicable early bird fee deadline and comply with its undertakings to support the implementation
deadline of the transaction
Early bird fee
▪ 71bps consent fee in cash ▪ 40bps consent fee including 15bps in cash and 25bps in PIK
Consent fee
▪ Aggregate $1.2m work fee to be shared amongst certain members of TLB ad hoc group
Work fee
▪ A choice of (i) 1% PIK fee, or (ii) 50bps PIK fee + a pro rata preferential right to subscribe with a portion of
existing debt for a PGS convertible bonds (see next page)
Additional
fees ▪ 57.8% of lenders, by amount, elected option (ii)
Notes:
1. Only main economic terms shown. Lenders are advised to refer to the full legal term sheet
51Appendix:
Convertible Bonds Summary Terms
Heading Terms
Issuer ▪ PGS ASA
Aggregate nominal value ▪ NOK 116,162,097
Maturity ▪ 3 year from issuance (at completion)
Conversion price ▪ Conversion price NOK 3 / share (i.e. aggregate up to maximum of 38,720,699 PGS ASA shares (10% of current outstanding shares))
Conversion period ▪ Any time until maturity, subject to customary notice periods
▪ PGS to have option to force conversion of the Convertible Bonds should the PGS share price be at NOK 6 / share or higher for 30
Issuer call
consecutive trading days
Coupon ▪ 5% per annum, paid semi-annually
Security ▪ Unsecured
▪ 57.8% of lenders elected to subscribe for the CB by converting a corresponding amount of TLB. The remaining amount will be settled in
Backstop
cash by certain lenders under the TLB who have backstopped the CB issuance
52You can also read