INTRODUCTION TO THE AA - Investor presentation H1 17 Interims - AA plc

Page created by Audrey Sherman
 
CONTINUE READING
INTRODUCTION TO THE AA - Investor presentation H1 17 Interims - AA plc
INTRODUCTION
TO THE AA
Investor presentation
H1 17 Interims
INTRODUCTION TO THE AA - Investor presentation H1 17 Interims - AA plc
CONTENTS, IR CONTACTS AND DEFINITIONS
CONTENTS                    IR CONTACTS                              DEFININTIONS THAT APPLY THROUGHOUT
                            Jill Sherratt                            •   Trading Revenue: Revenue excluding
                            Head of Investor Relations                   discontinued operations, business held for
Fundamentals       2 – 16
                            Email:        jill.sherratt@theaa.com        sale and exceptional revenue item

                            Telephone: +44 (0) 20 7395 7301          •   Trading EBITDA (earnings before interest,
H1 17 results     17 – 45   Mobile:       +44 (0) 7791 137738
                                                                         tax, depreciation and amortisation): excludes
                                                                         exceptional items, items not allocated to a
                                                                         segment and discontinued operations
Transformation              James Curran                             •   Cash conversion: net cash flow from
                            Investor Relations Manager and Analyst       continuing operating activities before tax and
(as at 20.4.15)   47 – 56
                            Email:      James.curran@theaa.com           exceptional items divided by Trading
                                                                         EBITDA
                            Telephone: +44 (0) 20 7395 4443
FY16 results                                                         •   Adjusted basic continuing EPS: Earnings per
                            Mobile:     +44 (0) 77387 71835
                                                                         share excluding discontinued operations
(in summary)      58 - 63                                                adjusts for a number of one-offs of which the
                            Lisa Shailer                                 largest are exceptional items, items not
                            Investor Relations Assistant                 allocated to a segment, the amortisation of
                                                                         debt issue fees, penalties on early
                            Email:      lisa.shailer@theaa.com
                                                                         repayment of debt and double-running
                            Telephone: +44 (0) 20 7395 7442              interest costs on Class B/B2 notes
                            Mobile:     +44 (0) 7950 868371          •   Personal Members and Business
                                                                         Customers: measured as the number at the
                            www.theaaplc.com                             period end

                                                                                                                      1
INTRODUCTION TO THE AA - Investor presentation H1 17 Interims - AA plc
FUNDAMENTALS
INTRODUCTION TO THE AA - Investor presentation H1 17 Interims - AA plc
PROVIDING SERVICES TO AA MEMBERS FOR MORE THAN 110 YEARS

                                                                                                                Brought under
                                                                                                                common
Founded by           Patrols on            35% share               Launched              Patrols issued         ownership with      DriveTech and
motoring             bicycles and          of 2m cars on the       Roadwatch and         with diagnostics       Saga in the         Auto Windshields      IPO
enthusiasts          uniforms              road                    Relay                 equipment              Acromas Group       acquired              26 June

  1905        1907    1909          1912      1939        1949           1973      1992           1999       2003      2004      2007    2009          2010     2014

1st AA insurance        Launched                  New fleet                 Launched                     AA members              Acquired by              BSM acquired,
policy                  AA Routes and             to enable four            AA Driving                   voted to                private equity           launch Home
                        AA Stars                  wheel patrols             School                       demutualize the         groups CVC and           Services
                                                                                                         AA and join             Permira Fund
                                                                                                         Centrica Group

                                                                                                                                                                          3
INTRODUCTION TO THE AA - Investor presentation H1 17 Interims - AA plc
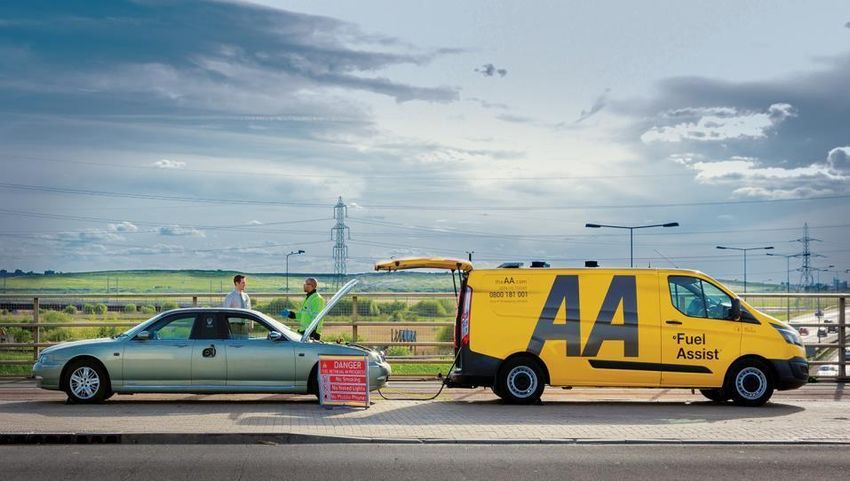
ROADSIDE ASSISTANCE AT THE CORE

    Segment
                 Roadside Assistance               Insurance Services                      Driving Services                 Ireland⁴

                                                                     17%                                  4%                       3%
 FY16 Trading
  EBITDA %1

                                  76%

                       £361m3                              £78m                                   £19m                      £13m
                 3.7m personal Members           Leading insurance broker               Provides driver awareness    Leading branded
                 and 10.2m B2B customers                                                training, fleet management   breakdown provider
                                                 Offers Motor, Home,
                                                                                        and driver training          and leading insurance
                 c3,000 dedicated patrols;       Travel and other specialist
                                                                                                                     broker in Ireland
                 c10,000 breakdowns              insurance                              Largest driving school in
    Highlights

                 per day                                                                the UK² - AA and BSM         Insurance lead with
                                                 Cross-sell to existing
                                                                                        brands                       breakdown usually ad
                 No 1 with market share of       customers
                                                                                                                     additional benefit
                 c40%                                                                   11% of the highly
                                                 Also includes Home
                                                                                        fragmented market
                 81% personal Member             Services and Financial
                 retention rate                  Services

1. Segment Trading EBITDA has been expressed as a % of Group Trading EBITDA excluding Head Office Costs
2. By total UK driving pupils.
3. Excluding Glass business disposed of
4. Ireland business sold on 11 August 2016 for EUR 156.6m                                                                                    4
INTRODUCTION TO THE AA - Investor presentation H1 17 Interims - AA plc
THE LEADERSHIP TEAM

         Bob Mackenzie                                               Martin Clarke
         Executive Chairman                                          Chief Financial Officer
         Previously Chairman and CEO of National Car Parks           Previously Partner and Global Head of Consumer for
         and its subsidiary Green Flag                               Permira
         Prior to that CEO of Sea Containers                         Prior roles at Cinven, Silverfleet and
         and Chairman of PHS Group                                   board member of New Look and Gala Coral

         Mike Lloyd                                                  Janet Connor
         Commercial Director                                         Restructuring and Insurance Director
         Previously Partner at Oliver Wyman focused on               Previously Managing Director at More Than; MD at
         Consumer Service businesses in FS, Energy, Home,            Ageas-owned over-50s broker RIAS from 2006 to 2011
         TV and Telecoms                                             Accountable for broking operating as CEO of AAISL
         Responsible for Roadside Assistance and Insurance
         Services, marketing and digital functions

         Oliver Kunc                                                 Kirsty Ross
         Operations Director                                         Membership Services Director
         Previously Managing Director of Central Heating             Previously Strategy and Innovations Director;
         Installations at British Gas; prior roles at Barclays, BA   Principal at Oliver Wyman
         and LEK consulting                                          Responsible for Motoring Services, Media and Driving
         Responsible for operations including patrols,               School businesses, connected car strategy and
         deployment, call centres and technical development          Group strategy

                                                                                                                            5
INTRODUCTION TO THE AA - Investor presentation H1 17 Interims - AA plc
THE INVESTMENT CASE

                Strong fundamentals          Strong, stable margins and cash conversion
                                             High barriers to entry, scale cost advantage

                Trusted brand                The UK’s most trusted commercial brand1
                                             Over 50% of households hold an AA product

                Market leadership            3.7m personal Members, 10.2m B2B customers
                                             No 2 motor insurance broker, No 1 driving school

                Retention and loyalty        High Member retention, long-term B2B contracts
                                             Significant revenues from repeat business

                Operational excellence       3.4m breakdowns attended pa
                                             Sophisticated deployment IP and services

                Options for growth           Trusted brand lends to relevant extensions
                                             20m marketing contacts, strong cross-sell ability

1. Y&R Brand Asset Valuator Survey (2014).

                                                                                                 6
INTRODUCTION TO THE AA - Investor presentation H1 17 Interims - AA plc
RELATIVE RESILIENCE OF MEMBERSHIP SINCE 1975

 Broad based under
 investment; eg in systems,      AA Members (m)                  AA Membership vs GDP Growth                        UK GDP growth (%)
 brand and capabilities
 and legacy of short-term       5.0                                                                                              20%
 decision making

 Premium position not
                                4.0                                                                                              15%
 underpinned by continuous                                                           Membership run-up and
 investment in proposition                                                           reduction following
 and no investment in brand                                                          demutalisation
 marketing for many years       3.0                                                                                              10%

                                                                    US savings and
 IT platform, except patrol                                           loan crisis                            Financial
 deployment, dated and                Oil Crisis
                                2.0                                                                            crisis            5%
 constraining growth; limited
 and inflexible CRM systems
                                1.0                                                                                              0%
 Individual business unit
 optimisation restricts
 commercial opportunity
                                0.0                                                                                              -5%
                                      1975         1980   1985    1990      1995         2000        2005    2010         2015

                                                                                                                                   7
INTRODUCTION TO THE AA - Investor presentation H1 17 Interims - AA plc
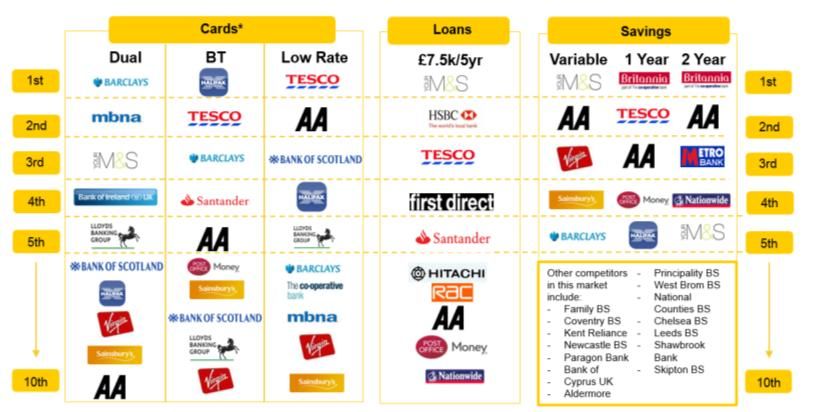
FINANCIAL RESILIENCE THROUGH THE ECONOMIC CYCLE

£1,200                                                     Revenue and Trading EBITDA

                                                                                                  979          971            974         967         963
£1,000                                                                 931          943
                                                         893
                              794          808
  £800          755

  £600

                                                                                                                       423          429         415
                                                                 369          371                        395
  £400                                                                                      366
                                                   334
                        273          292
          219
  £200

     £0
             Year to      Year to 13 months            FY09         FY10          FY11         FY12          FY13         FY14        FY15        FY16
            Dec 2005     Dec 2006 to Jan 2008

                                                               Trading EBITDA             Revenue
Note: 2005, 2006, 2008 and 2009 unaudited; FY15 and FY16 Revenue and Trading EBTIDA excludes the Glass business disposed of

                                                                                                                                                            8
INTRODUCTION TO THE AA - Investor presentation H1 17 Interims - AA plc
EXCEPTIONAL CASH GENERATION

                                       Cash flow generation (£m)

                                            102%         97%        101%
                               94%

                                                                                  Trading EBITDA
                               £395m       £423m        £430m       £415m
                                                                                  Cash Conversion

Net cash flow from operating   FY13         FY14        FY15        FY16
activities before tax and
exceptional items              £371m       £433m        £431m       £416m

  Favourable working capital dynamics as a function of upfront payments by customers

  Underlying maintenance capital expenditure of c£40m pa

                                                                                                    9
A HIGHLY TRUSTED COMMERCIAL BRAND

                                         Highest test score for a major
        “Which?” total test score 2015   provider from ‘Which?’ every
              Major providers            year since 2007

  74%                                     Widely recognised and trusted brand
                                          High level of customer satisfaction

                 66%                      50% of households hold an AA product
                                   64%    September 2015: AA ‘Recommended
                                          provider’ in “Which?” survey for both
                                          consumer and manufacturer cover for
                                          10th consecutive year

                                                                                10
SCALE, LEADING MARKET POSITION AND BARRIERS TO ENTRY

Large and resilient roadside market                                             Scale and barriers to entry
   Relatively stable market                                                          Economies of scale: c3,000; 10,000 breakdown per
                                                                                     day; c3.4m breakdowns pa
   High recurring revenue
                                                                                     New entry barriers from investment required in
                                                                                     systems – eg deployment
                                                                                     B2B relationships: 10.2m B2B customers; partner of
                                                                                     choice for major OEMs

         Consumer market share                                         B2B market share                     Breakdowns attended
            Others                                                                                         3.4m
             19%
                                       40%                                                                  B2B       2.5m

          GF                                                      67%          63%                                              0.7m1
                                                                                             50%         Consumer
         14%

             RAC                                               Motor          Fleets         AVA
             27%                                            manufacturers
Source: Industry sources;
Note 1: The number of breakdowns for GreenFlag is last year’s number

                                                                                                                                          11
HIGH MEMBER RETENTION AND LOYALTY

Large personal Membership base                                    Strong loyalty
 3.7m personal Members
                                                                  Membership tenure
 Rate of decline slowing
 • FY16: -2.6%
 • FY15: -4.5%
                                                     1,500,000
 3.3m paid personal Members                                                        800,000

 • H117: -0.6%
                                                     > 10 years                    >20 years
 Stable over medium/longer term
                                               Average tenure of c12 years
 Proprietary long-standing database of c21m
 individuals                                   Rising retention rate (81% for FY16)
 Competitive advantage for cross-selling
 Sophisticated customer rating and pricing
 capability based on proprietary information

                                                                                               12
LONG TERM B2B CONTRACTS

Selected B2B client base

                                        Recent contract wins:
 Added                                  Volkswagen Group, Porsche,
 Value                                  Lex Autolease
Accounts
                                        Recent renewals: Toyota,
                                        Northgate, Subaru, Isuzu,
 Fleet &
 leasing                                MG, Lexus (Bentley, Ford,
                                        Honda and Jaguar Land
                                        Rover in FY15)

                                        Extended contracts: BT and
 OEMs
                                        Vauxhall (Lloyds Banking
                                        Group and TSB in FY15)
 Tenure                                 Other developments: VW
 with AA       0–5         5-10   >10
                                        emissions programme and
                                        JLR mobile servicing pilot

                                                                     13
OPERATIONAL EXCELLENCE

Technical assets and expertise
                                                            High levels of customer service
  Unique deployment IP

  Modern multi-vehicle service technology

  80% of breakdowns repaired at roadside

  Skilled and experienced colleagues
                                                            AA “moment of truth” survey (%)
  Average of 11 years tenure with the AA
                                                                              22%
                                                      26%                                           31%

Call handling            80% in 20 seconds            57%                     66%
                                                                                                    53%
Repair rate                            82%
App usage
STRONG BRAND IN INSURANCE

Insurance Services

            Core insurance revenue breakdown           Brand consideration³ for switching Motor Insurance

                   Other
                    6%

            Home
            38%                       Motor
                                      56%

   No 1 motor insurance broker in the UK private car
                                                       Jan-12 Jun-12 Nov-12 Apr-13 Sep-13 Feb-14 Jul-14 Dec-14 May-15 Oct-15
   insurance market
                                                                      Admiral              AA                    Direct Line
   No 2 private home insurance broker in the UK                       Churchill            Hastings Direct       Axa
                                                                      Tesco                Saga
Source: GfK FRS Study March 2016

                                                                                                                               15
TRANSFORMATION STRATEGY
THE CHALLENGES

 Core business performance flat
 Several years of under-investment under previous ownership

THE STRATEGY
 Three years of investment and consolidation to position AA for renewed growth
 Refinancing to free up additional cashflow and facilitate dividends
 Strengthening the foundations and revolutionising customer experience
 • Investment in brand marketing - £10m pa additional marketing spend
 • Investment in IT systems and digital capability - £128m over 3 years
 • Restructuring and cost initiatives – Savings of £40m off FY15 cost base in FY19; cost of £45m over 3 years
 • Investment in Membership growth and price
 • Developing new business models – Financial Services and Insurance Underwriter
 • New business initiatives – building on the strength of the brand and opportunities in the wider market

Transformation creates the UK’s pre-eminent Membership services organisation

                                                                                                                16
H117 INTERIM
RESULTS
28 SEPTEMBER 2016
GOOD PROGRESS TO DATE IN YEAR 2 OF THE TRANSFORMATION

 Results in line with expectations
                                                TRANSFORMATION GAINING MOMENTUM
 Transformation firmly on track
                                                 Growth in paid personal Members since April
 Ireland sold; £106m for debt pay down           Roadside retention up to 81%
                                                 App usage increased to 14% of personal
 Recommend interim dividend of 3.6p per share    breakdowns
                                                 Productivity improved
                                                 Cost savings on target
                                                 IT investment on plan
                                                 Transformation capex – c. £10m saving
                                                 Normalised capex levels in sight

Transforming the AA into the UK’s pre-eminent Membership services organisation

                                                                                               18
FINANCIAL HEADLINES

 Trading Revenue¹ up 2.2% at £467m despite IPT increase
 • Roadside Trading revenue up 3.1% to £370m due to improved mix

 Trading EBITDA¹ flat at £192m
 • Roadside Trading EBITDA up 4.1% to £179m

 Trading EBITDA margin¹ 41.1% (H116: 42.0%)

 Adjusted EPS 10.3p (H116: 10.1p)

 Cash conversion 99% (H116: 114%); Net debt of £2,677m³ (6.7x Trading EBITDA²) post Ireland
 disposal in August

 Interim dividend of 3.6p per share declared

In line with market expectations
¹ Excluding the Glass and Ireland businesses and exceptional revenue item
² Trading EBITDA for the last 12 months                                                       19
³ Net debt at 31 July 2016 plus the net proceeds from the sale of Ireland
P&L

£m                                               H117    H116      YoY   Items not allocated to segment reflect
Trading Revenue                                   467     457     +2%    pension and share based payments
                                                                         impact

Trading EBITDA                                    192     192        -   Exceptional items comprise mainly
Items not allocated to a segment                  (10)     (9)   +11%    restructuring activities and provision for
                                                                         potential refund of customers with
Depreciation & amortisation                       (28)    (25)   +12%
                                                                         duplicate cover
Exceptional items                                 (22)    (26)    -15%
Operating profit                                  132     132        -   Decline in net finance cost reflects
                                                                         reduced interest on external borrowings
Net finance cost                                  (84)   (201)    -58%
                                                                         and the absence of one-off costs from the
Profit/(loss) before tax                           48     (69)   +170%   prior year refinancing
Tax (expense)/credit                              (10)     13    +177%
                                                                         Tax expense reflects current tax charge of
Profit/(loss) for the period from continuing       38     (56)   +168%
operations                                                               £10m, in line with current statutory rate
Basic EPS – continuing operations (p/share)       6.2    (9.6)   +165%
                                                                         Adjusted basic EPS of 10.3p reflects the
Adj Basic EPS –continuing operations (p/share)   10.3    10.1     +2%    capital structure in place since July 15

                                                                                                                  20
ROADSIDE ASSISTANCE

 Trading Revenue¹ up 3.1% to £370m                                                                         H117    H116    YoY   FY16 H1 on
                                                                                                                                        FY
 • Retention 81% (H116: 80%)
                                                               Personal Members (‘000s)                    3,599   3,726   -3%   3,673   -2%
 • Paid personal Members -0.6% YoY;
                                                               Average income per Member (£)                145     138    +5%    141    +3%
   -0.3% on FY16
                                                               Personal paid² Members (‘000s)              3,321   3,340   -1%   3,331    flat
 • Average income per personal paid
   Member +1.9% to £157 (net of 3.5%                           Average income per paid² Member (£)          157     154    +2%    156    +1%
   uplift in IPT)
                                                               Business customers (‘000s)                 10,179   9,981   +2% 10,216     flat
 • Ancillary revenue up 14%
                                                               Average income per business customer (£)      19      18    +6%     18    +6%
 Trading EBITDA¹ up 4.1% to £179m
                                                               Breakdowns attended (‘000s)³                1,759   1,662   +6%   3,459   n/a
 • Growth in income per personal Member
   and B2B revenue; lower H1 advertising
   spend (£5m vs £7.5m in H116)
 • Partially offset by increased workload
   from higher level of breakdowns attended

¹ Excluding items held for sale and exceptional revenue item
² Paid Members: Personal Members excluding free Memberships
³ Relevant period basis                                                                                                                   21
INSURANCE SERVICES

 Trading Revenue flat at £64m - lower core                      (000s)               H117    H116    YoY   FY16 H1 on FY

 insurance offset by increased FS                               Total insurance      1,962   2,131   -8%   2,074     -5%
                                                                policies
 Trading EBITDA down £2m to £35m –                              Motor policies        572     618    -7%    592      -3%
 managed decline of total insurance policies
                                                                Home insurance        891     913    -2%    899      -1%
 • Motor policies down - lower renewal volumes in               policies
   high rate increase market environment                        Average income per     67      63    +6%     63     +6%
 • Decline in Home Services policies as we cease                policy (£)
   free policies                                                Financial Services     82      na     na     33    +148%
                                                                Products
 Motor responding positively in last two months
 • Successful retention initiatives; direct sales initiatives
 • Additional motor policies through in-house
   Underwriter

  Financial Services
  • Performance to plan: matched book of £160m
    assets, £160m liabilities
  • Revenue up £3m due to marketing and product
    development services provided to BoI
                                                                                                                      22
IN-HOUSE UNDERWRITER
DRIVING SERVICES

 Underwriter                                                           H117    H116    YoY   FY16 H1 on FY

 • Progressing well                                     Policies         25      na     na     na      na
                                                        underwritten
 • Motor launched 30 January – 54k policies to date     (‘000s)
 • Home insurance underwriting launched in August

 Driving Services
                                                                       H117    H116    YoY   FY16 H1 on FY
 • Trading Revenue down 3% but EBITDA flat at £9m
                                                        Driving        2,516   2,602   -3%   2,574    -2%
   – Fewer driving school franchisees                   instructors
     reflecting market conditions
   – DriveTech police speed awareness
     courses stable
   – Cost savings support EBITDA
   – Short term initiatives to improve driving school
     performance

                                                                                                        23
STRONG OPERATIONAL CASHFLOW

£m                                                     H117    H116
Net cash flows before tax and exceptional items¹        190     218                                    Capex
Tax, exceptional items and discontinued operations       (6)    (14)
Net operating cash flows                                184     204
Transformation capex                                    (20)    (21)
Underlying IT capex                                      (8)    (10)
Non-IT capex                                             (7)     (9)
Capex accruals                                           (2)     (1)
                                                                           FY 15          FY 16         FY 17e         FY 18e         FY 19e
Capital repayment of Finance Lease net of disposal
                                                        (14)     (6)
proceeds                                                                     Transformation capex
Other                                                    (2)     (3)         Maintenance capex

Net cash flows before refinancing, purchase of own      131     154    Note: Capex includes finance lease capital spend net of vehicle proceeds
shares, interest and dividends

Refinancing transactions                                   -   (186)
Purchase of own shares                                   (2)     (7)
Interest paid                                           (76)   (107)
Dividend paid                                           (33)       -
Net increase/(decrease) in cash and cash equivalents     20    (146)

 ¹Continuing Operations                                                                                                                           24
DEBT STRUCTURE

Fixed interest rates                                                                         Leverage 6.7x net debt/EBITDA¹
with LIBOR hedged for Senior Term Facility
                                                                                             Blended cost of debt 4.97%;
Interest          4.36%        4.72%   6.27%      4.25%      3.78%      5.50%                increased to 5.07% following pay
rate                                                                                         down of £106m of STF in August
Effective          2019         2018   2025       2020       2019       2022                 Weighted average maturity 5 years
maturity
                                                                                             Run rate cash interest cover* close
Final              2019         2043   2043       2043       2043       2043                 to 3x
maturity
                                                                                             Class A FCF to DSCR** 3.4x
                                          £2,914m                                            (covenant > 1.35x)
                                                                                             Class B FCF to DSCR** 2.3X
                                                                         £735m
                                                                                             (covenant > 1.0x)

                               £475m   £500m      £500m                                      Senior debt all investment grade
                 £454m
                                                                                   £158m     Next bond refinancing due July
                                                             £250m                           2018 (Class A1 notes)
               Senior Term Class A1    Class A2   Class A3   Class A4     New      Cash
                 Facility   notes       notes      notes      notes     Class B2           *Run rate cash interest: Trading EBITDA
                                                                         notes             **Free cash flow: debt service cover ratio

 ¹Trailing 12 month trading EBITDA                                                                                                      25
PENSIONS

 IAS 19 pension deficit of £622m (31 July 15: £329m)
 • Increase in deficit driven by decline in corporate bond yields, particularly since UK referendum
   vote to leave the EU

 Triennial review of AA UK pension scheme commenced
 • Anticipate a significant increase from previous valuation of £202m (31 March 2013) due to
   reduction in long term gilt yields
 • Deficit likely to be materially below IAS 19 valuation
 • Review completion due by June 2017

 Review of options to mitigate current and future liabilities
 Decline in bond yields provides refinancing opportunity

                                                                                                      26
FINANCIAL IMPLICATIONS OF THE TRANSFORMATION

 Transformation capex: c.£10m saving allowing investment in other areas
 Investment in marketing and brand: £10m plus additional spend on the product
 proposition
 IT opex: c£8m pa
 Post-transformation capex run rate: IT c£10m; property & equipment c£10m; net
 vehicle costs c£20m
 Restructuring costs: £45m over three years
 Cost savings: at least £40m in respect of the FY15 cost base in FY19
 • Cost savings on target; phase 2 to commence once IT is in place

Driving revenue and earnings growth

                                                                                 27
STRATEGY
BUILDING MOMENTUM IN YEAR 2 OF TRANSFORMATION

THE STRATEGIC PRIORITIES                    THE TIME LINE

1.   Strengthen the AA to become the pre-
     eminent membership services            Year 1 FY16 Stronger foundations delivered
     organisation in the UK

2.   Revolutionise customer experience      Year 2 FY17 Building momentum for change
     through investing in the brand and
     embracing new technologies
                                            Year 3 FY18 Realise the transformation
3.   Reduce Group borrowings and the
     associated interest costs              Year 4 FY19 Delivering growth

 Transforming the AA into the UK’s pre-eminent Membership organisation

                                                                                         29
ROADSIDE PERSONAL MEMBERSHIP – REVERSING THE DECLINE

                                               MONTHLY PAID NEW BUSINESS VOLUMES
 Growth in paid personal membership numbers
 since April and continuing since July
                                                          YoY growth (%)
 Retention improved to 81% (80% last year)

 Stay AA since inception
 • Calls to Stay AA down 9%
 • Save rate up 7 percentage points
 • Discount rate down 7 percentage points

 Double-digit growth in new business volumes
 • Re-invigorated marketing approach
 • Improved digital capabilities
 • Lower price increases to drive retention
 • Advertising gaining traction

                                                                                   30
PRODUCTIVITY IMPROVEMENTS

                                                      ROLLING 12 MONTH VARIABLE COST PER CASE*
  Productivity improved since the full
  implementation of new practices
  Which? Recommended provider
  for 11th successive year                                                                                                                                                                       Roadside
                                                                                                                                                                                                 training
  Investments in productivity
  • New technology (Bosch diagnostics, Battery

                                                                           Sep-14

                                                                                                                         Feb-15

                                                                                                                                                                                        Sep-15

                                                                                                                                                                                                                            Feb-16
                                                        Jul-14
                                                                 Aug-14

                                                                                                               Jan-15

                                                                                                                                                                      Jul-15
                                                                                                                                                                               Aug-15

                                                                                                                                                                                                                            Jan-16

                                                                                                                                                                                                                                                                            Jul-16
                                                                                    Oct-14

                                                                                                                                                                                                 Oct-15
                                                                                                                                  Mar-15

                                                                                                                                                                                                                                        Mar-16
                                                                                                      Dec-14

                                                                                                                                                    May-15

                                                                                                                                                                                                                   Dec-15

                                                                                                                                                                                                                                                          May-16
                                                                                             Nov-14

                                                                                                                                           Apr-15

                                                                                                                                                             Jun-15

                                                                                                                                                                                                          Nov-15

                                                                                                                                                                                                                                                 Apr-16

                                                                                                                                                                                                                                                                   Jun-16
    testers, universal spare wheel)
  • New communications devices (tablets, i-phones)
                                                                                             FIX TIME PER JOB (MINUTES)
  • Updated deployment system (AA Help) currently
    being implemented

  However 6% increase in breakdowns
  attended in H1 compared with H116
                                                                                                                                                                                                 Roadside
  • £6m increase in total roadside operations costs                                                                                                                                              training
    partially offset by £2m of cost savings

                                                                            Sep-14

                                                                                                                          Feb-15

                                                                                                                                                                                        Sep-15

                                                                                                                                                                                                                                     Feb-16
                                                        Jul-14

                                                                                                                Jan-15
                                                                  Aug-14

                                                                                                                                                              Jul-15
                                                                                                                                                                               Aug-15

                                                                                                                                                                                                                            Jan-16

                                                                                                                                                                                                                                                                    Jul-16
                                                                            Oct-14

                                                                                                                                                                                        Oct-15
                                                                                                                          Mar-15

                                                                                                                                                                                                                                     Mar-16
                                                                                              Dec-14

                                                                                                                                           May-15

                                                                                                                                                                                                          Dec-15

                                                                                                                                                                                                                                                 May-16
                                                                                              Nov-14

                                                                                                                                           Apr-15

                                                                                                                                                                                                          Nov-15
                                                                                                                                                             Jun-15

                                                                                                                                                                                                                                                 Apr-16

                                                                                                                                                                                                                                                                   Jun-16
*Inflation adjusted                                                                                                                                                                                                                                                                  31
IT SYSTEMS TRANSFORMATION

 Progress made across all key elements of the IT transformation programme

             INFRASTRUCTURE                                         SERVICE

 Installed new IT infrastructure throughout        New version of AA Help being rolled out
 back office functions                             All patrols have new communications devices

    Reduces manual reconciliations                    Improves efficiency of patrols
    Reduces in house maintenance                      Improved information flows with call
    Leads to efficiencies throughout the              centres
    business                                          Provides for superior customer service

                                                                                                 32
IT SYSTEMS TRANSFORMATION

                     CRM

 Marketing element live since March
 Full CRM now being rolled out and uploaded
 Expected be finalised in Autumn 2017
 Improved on-boarding journey

   Enables 360-degree view of customer,
   integrating customer data
   Real-time, automated reporting and
   insight
   Allows for relevant, personal and iterative
   conversations with customers
   Enables next best action to drive sales
   Will facilitate easier cross sell
                                                 33
IT SYSTEMS TRANSFORMATION

                  DIGITAL                           CONSUMER ROADSIDE ONLINE SALES

 New commercial website launched in May                                       YoY change 2013 – 2016
 My AA launched in January                                                                                                                                   Launch
                                                                                                                                                              of site
 App refresh with improved functionality in
 September                                                                                                                                 Start of
                                                                                                                                           activity
 • App personal breakdown usage 14%
 • App registration 23% of the Membership base

    Improves online customer journey

                                                                            Nov-13

                                                                                                                Nov-14

                                                                                                                                                    Nov-15
                                                                   Aug-13

                                                                                                       Aug-14

                                                                                                                                           Aug-15

                                                                                                                                                                               Aug-16
                                                 Feb-13

                                                                                     Feb-14

                                                                                                                         Feb-15

                                                                                                                                                             Feb-16
                                                          May-13

                                                                                              May-14

                                                                                                                                  May-15

                                                                                                                                                                      May-16
    Enables customer self service
    Reduces call centre contact points
    Gives us insights into customer behaviour
    Opportunities to test product changes

                                                                                                                                                                                        34
ADVERTISING ACHIEVING GREATER IMPACT

   Investment of £5m in H1 with balance of £10m expected in H2

   Greater reach and frequency

   Additional “outdoor” has added visibility

   TV ads delivering branded cut-through well ahead of norms

                                                                 20161      20151   Norm²
ABC1 adults reached                                                94%       90%       na
Average no of times reached                                            60     22       na
Execution Cut-through (i.e. remembered the ad)                     52%       42%     39%
Brand Link (i.e. remembered that it was the AA)                    79%       77%     62%
Branded Cut-through (i.e. remembered it and who                    41%       32%     24%
it was)

¹Based on equivalent spend
²Ipsos Norm @ 500 Gross Rating Points (GPRs) i.e. for the same spend
                                                                                            35
FINANCIAL SERVICES AND IN HOUSE UNDERWRITER

                  FINANCIAL SERVICES                                                                         INSURANCE UNDERWRITER

 Launched cards, loans, savings, and mortgages (in                                               Insurance Underwriter launched in January to
 August) in partnership with the Bank of Ireland                                                 participate on the AA’s motor insurance panel
 £160m matched book value                                                                        25k policies written by end of July; 54k by end
                                                                                                 of September
 AA positioned in top 1-5 savings; top 10 for cards
 and loans                                                                                       Home insurance launched in August
                                                                                                 Too early for material financial contribution but
                      As at 12th September 2016                                                  early signs are promising

                                                                                                   AA UNDERWRITER POLICIES BY ORIGIN

                                                                                                       16%            Has never been an AA insurance
                                                                                                                      customer

                                                                                                               52%    Was once previously an AA
                                                                                                   32%                insurance customer
                                                                                                                      An existing AA insurance customer

*For cards, this analysis does not show the fee based long dated balance transfer (BT) card segment.                                                 36
SUMMARY

 Transformation well on track
 • Continue to invest in brand marketing and product proposition
 • Targeting cost savings from FY19 of at least £40m pa off the FY15 base
 • Saving of c.£10m transformation capex allowing investment in other areas

 Growth in Membership numbers - continued improvement into August and September
 Free cash flow generation to be enhanced following transformation
 Trading in line with market expectations for FY17; building momentum for FY18

Strengthened foundations and revolutionising customer experience

                                                                                 37
APPENDIX
REVENUE

                                                                                      % of
£m                                     H117            H116        Change            Group
Roadside Assistance                      370             359         +3.1%              79%          Increase in average revenue per customer and
                                                                                                     B2B revenue

Insurance Services                         64              64                 -         14%          Lower policy numbers offset by higher income
                                                                                                     per policy
Driving Services                           32              33         -3.0%               7%         Lower driving school franchises

Insurance                                    1               1                -               -
Underwriting

Trading revenue                          467             457         +2.2%
Business held for                            -               9
sales¹
Exceptional revenue                      (10)                -
provision
Total revenue                            457             466          -1.9%

1 In
   September 2015, AA plc group completed the sale of its subsidiary Autowindshields (UK) Limited. As a result, this business was presented as held for sale in
 the prior period.                                                                                                                                                39
TRADING EBITDA

                                                                % of
£m                                     H117   H116   Change   Group¹
Roadside Assistance                     179    172    +4.1%     81%    Revenue up 3.1%
                                                                       Advertising and Bosch investment timing
                                                                       difference offset by higher workload
Insurance Services                       35     37    -5.4%     16%    Lower policies numbers
                                                                       FS and Home Services business re-set under
                                                                       way
Driving Services                          9      9        -      4%    Lower driving school franchisees

Insurance                               (1)      0        -     (1%)
Underwriting
Head office costs                      (30)   (26)   +15.4%            Incremental IT licensing costs
Total Trading                           192    192        -
EBITDA

 1%   of Group pre head office costs
                                                                                                                 40
SEGMENTAL ANALYSIS

                                                                 YoY                                               YoY
Roadside Assistance                                   H117    Change   Insurance Services              H117     Change
Trading Revenue¹ (£m)                                   370    +3.1%   Trading Revenue (£m)              64        Flat
Trading EBITDA¹ (£m)                                    179    +4.1%   Trading EBITDA (£m)               35      -5.4%
Paid Personal Members (‘000s)                         3,321    -0.6%   Policy numbers² (‘000s)         1,962     -7.9%
Business Customers (‘000s)                           10,179    +2.0%   Average income per policy (£)     67      +6.3%
Average income per Paid Personal                        157    +1.9%
Member (£)
Breakdowns attended (‘000s)                           1,759    +5.8%                                               YoY
                                                                       Driving Services                 H117    Change
                                                                       Trading Revenue (£m)               32     -3.0%
                                                                       Trading EBITDA (£m)                 9       Flat
                                                                       Driving school instructors       2,516    -3.3%

 1 Excluding   glass business and exceptional revenue items
                                                                                                                    41
PROFIT AND LOSS¹
                            £m                                               H117    H116
                            Revenue                                           457     466
                            Cost of sales                                    (168)   (167)
                            Gross profit                                      289     299
                            Admin & marketing                                (157)   (167)
                            Operating profit                                  132     132
                            Trading EBITDA                                    192     192
                            Items not allocated to a segment                  (10)     (9)
                            Depreciation & amortisation                       (28)    (25)
                            Exceptional items                                 (22)    (26)
                            Operating profit                                  132     132
                            Net finance cost                                  (84)   (201)
                            Profit/(loss) before tax                           48     (69)
                            Tax (expense)/credit                              (10)     13
                            Profit/(loss) for the period from continuing       38     (56)
                            operations
                            Basic EPS – continuing operations (p/share)        6.2   (9.6)
                            Adj Basic EPS –continuing operations (p/share)   10.3    10.1

1 Continuing   operations
                                                                                             42
BALANCE SHEET
           £m                                               H117       H116
           Goodwill and other intangible assets             1,276      1,271
           Property, plant and equipment                      117        106
           Investments in joint ventures and associates         11          8
           Deferred tax assets                                107          57
           Non-current assets                               1,511      1,442
           Inventories                                           6          5
           Trade and other receivables                        169        185
           Cash and cash equivalents                          158        155
           Current assets                                     333        345
           Assets held for sale                                 93          3
           Total assets                                     1,937      1,790
           Trade and other payables                         (502)      (523)
           Current tax payable                                (11)          -
           Provisions                                         (21)        (7)
           Current liabilities                              (534)      (530)
           Borrowings and loans                           (2,922)    (2,911)
           Finance lease obligations                          (21)       (20)
           Defined benefit pension scheme liabilities       (622)      (329)
           Provisions                                          (7)       (11)
           Insurance technical provisions                      (4)        (4)
           Non-current liabilities                        (3,576)    (3,275)
           Liabilities held for sale                          (40)        (4)
           Total liabilities                              (4,150)    (3,809)
           Net liabilities                                (2,213)    (2,019)
                                                                                43
CASH FLOW
            £m                                                     H117    H116
            Operating profit including discontinued operations      139     138
            Depreciation and amortisation                            29       26
            Other items                                                7       2
            Cash exceptional items                                     9      21
            Change in working capital                                16       39
            Operating cash flow before tax and exceptional items    200     226
            Cash exceptional items                                   (9)    (21)
            Tax paid                                                 (7)     (1)
            Net cash flows from operating activities                184     204
            Investing activities
            Capital expenditure                                     (37)    (41)
            Other investing activities                                 4     (1)
            Net cash flows use in investing activities              (33)    (42)
            Financing activities
            Refinancing transactions                                   -   (186)
            Purchase of own shares                                   (2)     (7)
            Interest paid on borrowings                             (73)   (104)
            Payment of finance lease capital                        (20)     (8)
            Payment of finance lease interest                        (3)     (3)
            Dividends paid                                          (33)       -
            Net cash flows from financing activities               (131)   (308)
            Net increase/(decrease) in cash and cash equivalents      20   (146)

                                                                                   44
DEBT PACKAGE

                                                                                                        Run rate cash
                                                                             Expected                         interest Principal at 31 Principal at 31
                                                                         maturity date    Interest rate           (£m)   July 16 (£m)    July 15 (£m)
Senior Term Facility                                                   31 January 2019          4.36%             19.8            454             454
Class A1 notes                                                             31 July 2018         4.72%             22.4            475             475
Class A2 notes                                                             31 July 2025         6.27%             31.4            500             500
Class A3 notes                                                             31 July 2020         4.25%             21.3            500             500
Class A4 notes                                                             31 July 2019         3.78%               9.5           250             250
Class B2 notes                                                             31 July 2022         5.50%             40.4            735             735
                                                                                                4.97%            144.8          2,914           2,914

Ring fenced cash and cash equivalents                                                                                             122             114
Non ring fenced cash and cash equivalents                                                                                          36              41
Total cash and cash equivalents¹                                                                                                  158             155

Class A Net Debt: Trading EBITDA                                                                                                  4.9x            4.9x
(STF & Class A notes less ring fenced cash)
Class B Net Debt: LTM EBITDA                                                                                                      6.8x            6.8x
(WBS debt less ring fenced cash)
Total Net Debt : LTM EBITDA (total debt less total cash)                                                                          6.7x            6.7x

Class A FCF DSCR                                                                                                                  3.4x            3.8x

Class B FCF DSCR                                                                                                                  2.3x            2.2x

 ¹Excludes available and restricted cash balances available for sale
                                                                                                                                                   45
TRANSFORMATION
STRATEGY
BUILDING MOMENTUM IN YEAR 2 OF TRANSFORMATION

THE STRATEGIC PRIORITIES                    THE TIME LINE

1.   Strengthen the AA to become the pre-
     eminent membership services            Year 1 FY16 Stronger foundations delivered
     organisation in the UK

2.   Revolutionise customer experience      Year 2 FY17 Building momentum for change
     through investing in the brand and
     embracing new technologies
                                            Year 3 FY18 Realise the transformation
3.   Reduce Group borrowings and the
     associated interest costs              Year 4 FY19 Delivering growth

 Transforming the AA into the UK’s pre-eminent Membership organisation

                                                                                         47
TRANSFORMATION STRATEGY

 Strengthening the foundations and revolutionising customer experience
 1. Investment in brand marketing
 2. Investment in IT systems and digital capability
 3. Restructuring and cost initiatives
 4. Investment in Membership growth and price
 5. Developing new business models
 6. New business initiatives

Transformation creates the UK’s pre-eminent Membership services organisation

                                                                               48
1. UNDER INVESTMENT IN THE BRAND

   Enhance brand awareness and communicate membership proposition

   Substitute brand marketing for past excessive price discounting

   Invest £10m in FY16 and beyond

   Benefits expected to become apparent from FY17

      66%
                                           57%
                         47%
                                                             31%
                                                                                21%               22%
                                                                                                                    11%
                                                                                                                             4%     2%

      2006              2007               2008              2009              2010               2011              2012     2013   2014
                                                     Total media spend                                   AA Share of voice

 Underpins product transformation and membership proposition
Sources: Ebiquity Media Tracking (TV, Press, Radio, Cinema, Outdoor), Road Brand Tracker Survey, IPSOS
                                                                                                                                           49
2. INVESTMENT IN IT SYSTEMS AND DIGITAL CAPABILITY

 De-risk infrastructure and connections              Financial implications
 • Replace legacy systems                            • IT transformation capex spend of £128m
                                                       over 3 years
 • Staged implementation and double running
 • Rationalisation of processes and transform call   • Thereafter steady state IT capex of £10m pa
                                                       (versus £30m previously)
   centre effectiveness
                                                     • Maintenance spend will increase by £8m in
 Enhance commercial agility                            a full year
 • Faster times for price, product and customer
   communication changes

 Development of digital proposition for
 customers
 • New App
 • Connected car developments including telematics

Drives productivity and revenue growth

                                                                                                     50
3. RESTRUCTURING AND COST INITIATIVES

 People and property strategy to cost £45m over 3 years
 • Cost savings £40m pa thereafter

 Phase 1 announced
 • £4m savings in FY16; £8m in a full year

 Investment in people and key skills
 • New central London office to attract digital and marketing talent

 Continued investment in front line people and equipment

Productivity gains and energised culture in the medium term

                                                                       51
4. INVESTMENT IN MEMBERSHIP GROWTH AND PRICE

 Investment in price to create sustainable base   Communicate existing services
 • Expect c3% increase in income per Personal     • Fuel Assist: 98% fix rate;
   Member in FY16                                   20% member discount on pay-for-use
                                                  • Key Assist: dedicated vans; free for gold members
 Investment in product

 Additional opportunities in ancillary revenue
 • Battery sales
 • AA tyres

 Focus on retention processes
 • Stay AA

Investment required to drive retention and Membership

                                                                                                   52
5. DEVELOPING NEW BUSINESS MODELS

Financial Services and Insurance Underwriter   Craig Staniland                       Dominic Bird
                                               CEO                                   Head of Pricing
  New partnership model for elements of        30+ years experience in Insurance     10 years experience in Insurance
  Financial Services business                  Previously MD, AXA Personal           Previously Head of New Business
                                               Lines                                 Pricing, Direct Line Group
  • Expected short term cost of £4m but
                                               Prior to that Founding Underwriting   Prior to that Consultant,
    significant potential                      Director, Swiftcover and Head of      Towers Watson
                                               Motor Underwriting, RBS

  Launch of new in-house underwriter in
                                               Steve Gaywood                         Tony Peppard
  early 2016                                   Head of Counter-Fraud                 Head of Claims
  • Expected set up costs of £1m               15 yrs Counter-Fraud experience       30+ years Claims and Vehicle
                                                                                     Management experience
                                               Previously Head of Counter-Fraud,
  • £7.5m investment                           AXA Personal Lines and Head of        Previously MD, AXA and
                                               Systems and Data Analytics,           Swiftcover Claims and MD,
  • Experienced team to lead the underwriter   Innovation Conversant Data            Churchill Claims Services Group

 Building on market strengths and brand

                                                                                                                        53
OPERATING AS A BROKER AND INSURER

Activities in personal lines insurance value chain

                    Price                                                      Pricing
                                                      New          Policy                                          Investment
     Lead          comparison                                                     &                Claims
                                     Sales          business       admin &                                             &
   generation         &                                                         under-            handling
                                                    fulfilment     servicing                                        solvency
                   quotation                                                   writing

   Google          PCWs                      Broker – the AA now                         Insurer – the new model

  Effective business model that maximises use of capital AND broker value
  New agile IT systems, integrated with AA and high-value external databases
  Newly built capabilities drive excellence in data mining and agile pricing
  Integrated policy and claims management, unencumbered by legacy systems
  Leveraging robust controls and governance, mitigating conflicts
  Experienced, proven team that has created and run successful operations

                                                                                                                                54
6. NEW BUSINESS INITIATIVES

Adjacent motoring services markets

                                              Key opportunities:
  1                                             Tyres
  C £60bn broader Motoring Services
  market – the AA currently focused on          Used Car Sales
FINANCIAL IMPLICATIONS OF THE TRANSFORMATION

 Cost rationalisation expected to deliver £40m of cost savings in medium term
 • Phase 1 underway and expected to deliver £8m in FY17

 IT transformation to modernise the business and enhance customer experience
 • Incremental spend of £128m over 3 years
 • Additional opex
 • Leading to facilitates cost savings and reduced capex

 Investment in price – increase in income per Member restricted to 3%

 Continuing incremental PLC costs confirmed as £8m pa

 Short term uplift in capex to facilitate transformation
 • Normalised net capex for IT and vehicles on current assumptions c£40m pa from FY19

                                                                                        56
FY16 RESULTS
SUMMARY
FY16 REVENUE

                                                      % of
£m                            FY16   FY15   Change   Group
Roadside Assistance            724    711    +1.8%    75%    Increase in average income per Member
                                                             offsetting the decline in personal Members

Insurance Services             131    142    -7.7%    14%    Lower policy numbers and income per policy
Driving Services                68     74    -8.1%     7%    Lower driving school franchises and Police
                                                             courses

Ireland                         38     39    -2.6%     4%    Impact of lower € - revenue up £3m on
                                                             constant FX

Insurance                        2      1        -       -
Underwriting

Total revenue¹                 963    967    -0.4%

 ¹ Excluding glass business                                                                               58
FY16 TRADING EBITDA

                                                        % of
£m                            FY16    FY15    Change   Group
Roadside Assistance             361     358    +0.8%    76%    Revenue up 1.8%
                                                               Advertising and Bosch investment
Insurance Services               78      84    -7.1%    17%    Efficiency savings
                                                               FS business re-set under way
Driving Services                 19      20    -5.0%     4%    Lower driving school franchisees and Police
                                                               courses

Ireland                          13      15   -13.3%     3%    EBITDA flat on constant currency
Head office costs              (56)    (48)   +16.7%           Incremental PLC and IT licensing costs
Total Trading                   415     429    -3.3%
EBITDA¹
Trading EBITDA
                              43.1%   44.4%
Margin¹

 ¹ Excluding glass business                                                                                  59
FY16 SEGMENTAL ANALYSIS

                                         Y-o-Y                                                Y-o-Y
Roadside Assistance            FY16    Change    Insurance Services                 FY16    Change
Revenue¹ (£m)                   724      1.8%    Revenue (£m)                        131      -7.7%
Trading EBITDA¹ (£m)            361      0.8%    Trading EBITDA (£m)                  78      -7.1%
Personal Members (‘000s)       3,673     -2.6%   Policy numbers (‘000s)             2,074     -4.1%
Business Customers (‘000s)    10,216     6.0%    Average income per policy (£)        63      -4.5%
Average income per Personal     141      4.4%
Member (£)
Breakdowns attended (‘000s)    3,459     -2.3%

                                         Y-o-Y                                                Y-o-Y
Driving Services               FY16    Change    Ireland                            FY16    Change
Revenue (£m)                     68      -8.1%   Revenue (£m)                         38      -2.6%
Trading EBITDA (£m)              19      -5.0%   Trading EBITDA (£m)                  13    -13.3%

Driving school instructors     2,574     -3.6%   Personal Members (‘000s)            128      7.6%
                                                 Insurance policy numbers (‘000s)    185      3.9%

 ¹ Excluding glass business                                                                     60
FY16 BALANCE SHEET

             £m                                               FY16       FY15
             Goodwill and other intangible assets             1,298      1,257
             Property, plant and equipment                      122        100
             Investments in joint ventures and associates         10          4
             Deferred tax assets                                  52         81
             Other receivables                                     -         21
             Non-current assets                               1,482      1,463
             Inventories                                           5          5
             Trade and other receivables                        172        187
             Current tax receivables                               -          1
             Cash and cash equivalents                          166        302
             Current assets                                     343        495
             Total assets                                     1,825      1,958
             Trade and other payables                         (525)      (498)
             Provisions                                          (8)        (8)
             Current liabilities                              (533)      (506)
             Borrowings and loans                           (2,920)    (3,241)
             Finance lease obligations                          (21)       (16)
             Defined benefit pension scheme liabilities       (296)      (434)
             Provisions                                          (7)       (12)
             Insurance technical provisions                      (4)        (4)
             Non-current liabilities                        (3,248)    (3,707)
             Total liabilities                              (3,781)    (4,213)
             Net liabilities                                (1,956)    (2,255)

                                                                                  61
FY16 CASH FLOW
           £m                                                     FY16    FY15
           Operating profit                                        305     326
           Depreciation and amortisation                             54      48
           Other items                                               12       0
           Cash exceptional items                                    37      57
           Change in working capital                                 12    (15)
           Operating cash flow before tax and exceptional items    420     416
           Cash exceptional items                                  (37)    (57)
           Tax paid                                                 (2)     (2)
           Net cash flows from operating activities                381     357
           Investing activities
           Capital expenditure                                     (75)    (37)
           Other investing activities                                 4      21
           Net cash flows use in investing activities              (71)    (16)
           Financing activities
           Refinancing transactions                               (183)      12
           Purchase of own shares                                  (22)        -
           Interest paid on borrowings                            (178)   (218)
           Payment of finance lease capital                        (34)    (31)
           Payment of finance lease interest                        (8)      (4)
           Dividends paid                                          (21)        -
           Net cash flows from financing activities               (446)   (241)
           Net increase in cash and cash equivalents              (136)     100

                                                                                   62
FY16 DEBT PACKAGE

                                                                                             Run rate cash Principal at 31 Principal at 31
                                                                  Expected                         interest   January 16      January 15
                                                              maturity date    Interest rate           (£m)          (£m)            (£m)
Senior Term Facility                                        31 January 2019          4.36%             19.8           454             663
Class A1 notes                                                  31 July 2018         4.72%             22.4           475             475
Class A2 notes                                                  31 July 2025         6.27%             31.4           500             500
Class A3 notes                                                  31 July 2020         4.25%             21.3           500             500
Class A4 notes                                                  31 July 2019         3.78%               9.5          250             250
Class B notes                                                   31 July 2019               -               -             -            655
Class B2 notes                                                  31 July 2022         5.50%             40.4           735                -
PIK notes                                                  6 November 2019                 -               -             -            175
                                                                                     4.97%            144.8         2,914           3,218

Ring fenced cash and cash equivalents                                                                                  94             262
Non ring fenced cash and cash equivalents                                                                              72              40
Total cash and cash equivalents                                                                                       166             302

Class A Net Debt: Trading EBITDA                                                                                      5.0x            4.9x
(STF & Class A notes less ring fenced cash)
Class B Net Debt: LTM EBITDA                                                                                          6.9x            6.6x
(debt excluding PIK notes less ring fenced cash)
Total Net Debt : LTM EBITDA (total debt less total cash)                                                              6.8x            6.9x

Class A FCF DSCR                                                                                                      3.9x            3.5x

Class B FCF DSCR                                                                                                      2.4x            2.2x

                                                                                                                                       63
You can also read