FY15 HALF-YEAR RESULTS - Open Briefing
←
→
Page content transcription
If your browser does not render page correctly, please read the page content below
FY15 HALF-YEAR
RESULTS
12 FEBRUARY 2015
DISCLAIMER & BASIS OF PREPARATION
This publication is prepared by the Transurban Group comprising Transurban Holdings Limited (ACN 098 143 429), Transurban Holding Trust (ARSN 098 807 419) and Transurban International Limited (ACN 121 746 825).
The responsible entity of Transurban Holding Trust is Transurban Infrastructure Management Limited (ACN 098 147 678) (AFSL 246 585). No representation or warranty is made as to the accuracy, completeness or
correctness of the information contained in this publication. To the maximum extent permitted by law, none of the Transurban Group, its directors, employees or agents or any other person, accept any liability for any loss arising
from or in connection with this publication including, without limitation, any liability arising from fault or negligence. The information in this publication does not take into account individual investment and financial circumstances
and is not intended in any way to influence a person dealing with a financial product, nor provide financial advice. It does not constitute an offer to subscribe for securities in the Transurban Group. Any person intending to deal in
Transurban Group securities is recommended to obtain professional advice.

UNITED STATES
These materials do not constitute an offer of securities for sale in the United States, and the securities referred to in these materials have not been and will not be registered under the United States Securities Act of 1933, as
amended, and may not be offered or sold in the United States absent registration or an exemption from registration.

© Copyright Transurban Limited ABN 96 098 143 410. All rights reserved. No part of this publication may be reproduced, stored in a retrieval system, or transmitted in any form or by any means, electronic, mechanical,
photocopying, recording or otherwise, without the written permission of the Transurban Group.

BASIS OF PREPARATION
This document includes the presentation of results on a statutory as well as non-statutory basis. The non-statutory basis includes the Proportional Results and Free Cash. All financial results are presented in AUD unless
otherwise stated. Data used for calculating percentage movements has been rounded to thousands.

PROPORTIONAL RESULTS
The Proportional result is the aggregation of the results from each asset multiplied by Transurban’s percentage ownership as well as the contribution from central group functions. Proportional earnings before interest, tax,
depreciation and amortisation (EBITDA) is one of the primary measures used to assess the operating performance of Transurban, with an aim to maintain a focus on operating results and associated cash generation.

The EBITDA calculation from the statutory accounts would not include the EBITDA contribution of the M5 or M7 and includes the non-controlling interests in Transurban Queensland, M1 Eastern Distributor, 495 Express Lanes
and Transurban DRIVe.

Proportional EBITDA is reconciled to the statutory income statement on slides 45 and 46.

FREE CASH
Free cash is the primary measure used to assess cash generation in the Group. The free cash represents the cash available for distribution to security holders. Free cash is calculated as statutory cash flow from operating
activities from 100% owned subsidiaries plus dividends received from less than 100% owned subsidiaries and equity accounted investments. An allowance is deducted for the maintenance capital provision recognised in 100%
owned assets (including tags). Free cash is reconciled to operating cash flows on slide 50.

These non-statutory measures are calculated from information extracted from Transurban’s half year financial statements which contain a review opinion by the Group’s auditor.

                                                                                                                                                                                                                                              2
AGENDA
1   FY15 half-year in review

2   Financial results

3   Market update

4   Appendices

                               3
FY15 HALF-YEAR IN REVIEW SCOTT CHARLTON, CEO
FY15 HALF-YEAR FINANCIAL HIGHLIGHTS1
     FY15 HALF-YEAR INCLUDING ACQUISITIONS
      AVERAGE DAILY
      TRAFFIC GROWTH
                                                               PROPORTIONAL TOLL
                                                               REVENUE GROWTH
                                                                                                                         PROPORTIONAL EBITDA
                                                                                                                         GROWTH 2
                                                                                                                                                `                                 HALF-YEAR FY15
                                                                                                                                                                                  DISTRIBUTION

                 3.5%                                                   36.7%                                                      37.4%                                                      19.5₵
     FY15 HALF-YEAR EXCLUDING ACQUISITIONS3
                                                               PROPORTIONAL TOLL                                         PROPORTIONAL EBITDA
                                                               REVENUE GROWTH                                            GROWTH

                                                                            9.8%                                                   13.6%
1.   Refer to slide 2 for explanation of proportional toll revenue, proportional EBITDA and underlying results.
2.   Excludes significant items relating to the Queensland Motorways acquisition including stamp duty, transaction and integration costs.
3.   Excludes transactions costs and contributions associated with Cross City Tunnel, Queensland Motorways and changes in ownership interest in the US business, which were not in the pcp.           5
DISTRIBUTION GROWTH
FY15 distribution guidance upgraded to 39.5 cents
− Strong first half traffic and underlying operational performance
− Expectation of 7 cent fully franked component
− Expected to be approximately 100% free cash1 covered
Interim distribution of 19.5 cents declared
− Inclusive of 3.5 cents fully franked
dividend component
22₵ 24₵ 27₵ 29.5₵ 31₵ 35₵ 39.5₵2 ■ ACTUAL
FY09 FY10 FY11 FY12 FY13 FY14 FY15 ■ GUIDANCE
Compound annual growth of more than 10% since FY09 (inclusive of FY15 guidance)
1. Refer to slide 2 for explanation of free cash
2. Includes interim distribution of 19.5 cents
6FY15 HALF-YEAR HIGHLIGHTS
PORTFOLIO SNAPSHOT
31 DEC 2014 31 DEC 2013
Network positions 4 3
Assets in operation 13 8
Development projects 31 32
Development projects lane kilometres 118.5 205.5
Average weighted concession length 28 years4 24 years
Total lane kilometres (assets and projects) 1,286 943
Aggregate average daily trips3 1,215,412 834,096
1. NorthConnex , City Tulla Widening and Legacy Way (Transurban does not have delivery risk for this project)
2. M5 West Widening, 95 Express Lanes and NorthConnex
3. CityLink transactions have been converted to ‘average daily trips’.
4. Includes concession adjustments to M7, LCT and M2 resulting from NorthConnex.
7FY15 HALF-YEAR HIGHLIGHTS
PORTFOLIO PERFORMANCE
PROPORTIONAL TRAFFIC TOLL
TOLL REVENUE EBITDA
NETWORK HIGHLIGHTS GROWTH REVENUE
CONTRIBUTION GROWTH1
(AUD) (ADT) 1 GROWTH1
Network development activities contributing to traffic growth.
Sydney 2 M2 Upgrade (completed August 2013) continuing to underpin traffic
growth across M2, M7 and LCT. ▲ 6.5% + 11.1% + 14.8%
M5 widening completed in December 2014.
Robust traffic growth - December quarter strongest since June 2013.
Melbourne
Minimum toll escalation schedule underpinning revenue growth.
Further efficiency gains through insourcing of road operations, ▲ 2.4% + 7.2% + 10.9%
improved revenue collection and back office processes.
Logan Motorway major pavement works impacted traffic during the
▲ 0.8% +
period - scope and timing of remaining sections under review.
Brisbane3 4.2% N/A
Traffic growth on largest asset in the Qld network, Gateway Motorway,
3.6% in December quarter vs pcp.
495 Express Lanes continuing to deliver strong growth - record daily
Northern Virginia
▲15.4% + 61.8% + 249.4%
toll revenue of US$200,767 achieved on 2 December 2014.
(USD)4 Network of managed lanes established with opening of 95 Express
Lanes in December 2014 – joint operations established.
1. Growth vs pcp. ADT refers to average daily transactions/trips
2. Excludes Cross City Tunnel
3. Transurban acquired 62.5% ownership of Queensland Motorways’ assets on 2 July 2014. Toll revenue figures exclude Go Between Bridge and Clem7 which were not owned by Queensland Motorways in the prior period.
Figures also exclude Legacy Way which is due to commence operation mid-2015.
4. Excludes 95 Express Lanes in the current period , Pocahontas 895 in the prior corresponding period and the impact of change in ownership percentage of 495 Express Lanes.
8CONSISTENT
FY15 HALF-YEAR
STRATEGY
HIGHLIGHTS
DELIVERING STRATEGY
CUSTOMER AND ROAD INFRASTRUCTURE COMPETITIVE CLEAR MARKET
SUSTAINABILITY PARTNER OF CHOICE ADVANTAGE DEFINITION
Clear productivity Committed pipeline of TCL core capabilities Urban road networks in
benefits delivered development projects focused on efficient east coast of Australia
through major network progressing well network operation and and North America
enhancements development underpinned by strong
Clear opportunities to
̶ Network forecasting demographic
Travel time savings further develop networks
characteristics relating to
delivered through in core markets ̶ Operations/maintenan
income, employment and
efficient network ce and customer
Proactive approach to population growth
operations and targeted management
enhancing the networks
development ̶ Project Existing networks
in core markets –
development/procure present significant
Community reinvestment working with government
ment and delivery opportunities for further
program – CityLink road to identify opportunities
development
corridor rejuvenation ̶ Technology
underway application
Community and ̶ Engagement with
innovation grant government and
programs communities
9FY15 HALF-YEAR HIGHLIGHTS
OPERATIONAL ACTIVITIES
CUSTOMER AND TOLLING OPERATIONS & MAINTENANCE CORPORATE SAFETY
NSW phase 1 roll out of Integration of 495 and 95 Two new executives 95 Express Lanes
GLIDe tolling system O&M appointed to TCL Executive completed without
completed in 2014; Phase 2 CityLink road operations in- Committee a lost time injury
commenced in NSW (LCT housing complete TCL established as (4 million construction
and M7); and agreement manager and operator of hours)
Logan Motorway pavement
reached to use GLIDe for Queensland Motorways FY15 YTD no recordable
rehabilitation program
NorthConnex and integration is injuries across the Group
phase 1 works completed
Shift to national customer (Oct 2014) and future works progressing well New safety observation
management structure on hold with scope and $5.58 billion debt raised or system with 100%
timing under review refinanced at corporate and compliance at Dec 2014
asset level during period Average injury crash rate
National procurement on TCL assets 4.7 per 100
programs rolled out – million vehicle kilometres
reducing group-wide spend travelled - substantially
and creating efficiencies better than industry
across technology, standards
engineering and utilities
10FY15 HALF-YEAR HIGHLIGHTS
DEVELOPMENT ACTIVITIES
MELBOURNE SYDNEY BRISBANE NORTHERN VIRGINIA
CityLink Tulla Widening M5 West Widening QM integration progressing 95 Express Lanes opened
construction due to completed on time and well with free cash and in December ahead of
commence Oct 2015 budget Dec 2014 EBITDA contribution ahead schedule and budget, and
of budget for H1 FY15 performing in line with
Continuing to monitor NorthConnex financial
expectations
opportunities to further close with NSW Legacy Way on track for
enhance the network Government reached Jan opening mid-2015 Integrated operations with
2015 495 Express Lanes
Gateway North Upgrade
complete
Continuing to monitor contract to be awarded mid-
WestConnex development 2015
Logan Motorway pavement
rehabilitation program
phase 1 works completed
Oct 2014
11FINANCIAL RESULTS ADAM WATSON, CFO
STATUTORY RESULTS
SUMMARY
HY15 ($M) HY14 ($M) KEY DRIVERS
Toll revenue
Toll revenue 738 451
Revenue growth driven by strong traffic growth and
EBITDA 181 381 operating performance, and acquisitions of Queensland
Motorways and Cross City Tunnel and consolidation of the
US business
Net profit (loss) (354) 81
EBITDA
EBITDA excluding Revenue growth and ongoing margin improvement
597 381 Significant items included in EBITDA; stamp duty ($384m),
significant items
integration costs ($10m) and transaction costs ($22m) for
Net profit excluding
52 81 Queensland Motorways acquisition
significant items
Net profit
FY15 H1 distributions Interim distribution of 19.5 cents, Significant items (outlined above) leading to net loss
including 3.5 cent fully franked
Net profit excluding significant items lower than pcp largely
component – FY15 distribution due to higher depreciation and amortisation charges and
guidance of 39.5 cents higher interest costs associated with the acquisition of
Queensland Motorways and Cross City Tunnel
13PROPORTIONAL RESULTS1
SUMMARY
KEY DRIVERS
HY15
HY15 ($M) ex acquisitions2 HY14 ($M) % CHANGE4 Toll revenue
($M) Queensland assets contributed $124m
Toll revenue 761 611 556 9.8% CCT contributed $28m
Other assets contributed $55m
Fee
Feerevenue
revenue 62 50 45 10.5%
Fee revenue
Other
Otherrevenue
revenue 9 10 13 (21.2%)
Queensland and CCT acquisitions and changes in ownership
Total costs
Total direct costs (196) (145) (151) (4.1%) interest in the US business contributing $12m
EBITDA excluding Remaining increase due to improvements in fee collection
636 526 463 13.6% processes
significant items
Other revenue
Significant items3 (264) - - -
Lower tolling and traffic management system development net
EBITDA 372 526 463 13.6% revenue as 95 Express Lanes project reached completion
Total costs
1. The proportional result is the aggregation of the results from each asset
multiplied by Transurban’s percentage ownership as well as contribution Excluding impact of acquisitions and change in ownership:
from central group functions. Strong cost discipline maintained
2. Acquisitions include transactions costs and contributions associated
Favourable maintenance provision movements
with Cross City Tunnel , Queensland Motorways and changes in
ownership interest in the US business. Efficiencies and initiatives in customer management
3. Items relating to the Queensland Motorways acquisition including stamp offsetting O&M increases
duty, transaction and integration costs.
4. Percentage change between HY14 and HY15 ex acquisitions.
14UNDERLYING BASE
BUSINESS PERFORMANCE
PROPORTIONAL EBITDA GROWTH
650
600 63
1
550
112 636
500
4
450
463 459
400
HY14 Proportional Prior Year Non Normalised HY14 Acquisitions (QM & Ownership Increase Existing Business HY15 Underlying
EBITDA Recurring CCT) (495) Growth EBITDA
15MARGIN IMPROVEMENT
EBITDA MARGIN1 AVERAGE EBITDA MARGIN
Basis point
H1 FY15
increase
CityLink 93.4% 310
Hills M2 85.2% 150
Westlink M7 88.1% 480
M5 South West Motorway 95.1% 110
M1 Eastern Distributor 70.9% 610
Lane Cove Tunnel 65.1% 40
Cross City Tunnel 58.2% N/A
Gateway Motorway 80.8% N/A
Logan Motorway 72.4% N/A
CLEM7 45.6% N/A
Go Between Bridge 75.3% N/A
Key factors driving margin improvement:
495 Express Lanes (USD) 48.5% 8,400 • Underlying network growth in traffic and prices augmented through
95 Express Lanes (USD) - N/A network development activities
• Efficiency gains offsetting costs incurred to drive business growth
1. Increase represents absolute increase in margin from previous corresponding period • Economies of scale being achieved within and across networks
2. Excludes Cross City Tunnel and Queensland Motorways assets • M7 and ED margin increase driven by reduction in maintenance provision 16COST MANAGEMENT
PROPORTIONAL COSTS
205
1 3
Additional ED
3
195 12 ownership in maintenance 2
495 net of provision Higher prior
prior year lower than year costs Operational
Pocahontas pcp owing to associated efficiencies
costs no prior year with QM and and
185 longer rectification CCT technology
incurred works acquisitions
Strong cost
M7 tolling discipline
system including
175 replacement benefits
previously driven
39 included in through the 196
maintenance national
provision but procurement
165 now delivered program
by
Transurban 495
under license marketing
costs no
155 fee
longer
incurred
151
145
HY14 Costs Queensland CCT contribution Change in US Maintenance Business BAU cost reduction HY15 Costs
contribution ownership provision development
17FREE CASH FLOW
FREE CASH FLOW 31 DEC 14 31 DEC 13 % CHANGE
Free cash1 $378M $240M 57.5%
Weighted average securities eligible for distribution 1,906M 1,486M
Free cash per security (cents) 19.8 16.2 22.2%
Free cash increase driven by QM distributions ($52m), CCT operating income($20m), higher M7 term loan notes
interest received ($37m) and increase in operating performance of other assets ($29m)
Weighted average number of securities eligible for distribution has increased 420m as a result of the QM
acquisition
1. Refer slide 2 for explanation of free cash.
18FUNDING UPDATE
SIX MONTH SNAPSHOT •A $125m corporate working
capital
B
•B $2500m drawn debt and
D
$400m undrawn debt raised
C for Queensland Motorways
acquisition. $450m of the
drawn debt subsequently
B refinanced into debt capital
markets
•
C $1270m raised to refinance
Westlink M7’s debt facilities
•D Corporate Euro issuance
A swapped into A$833m and
used to repay corporate
1 maturities
1. Sun Group refers to the Queensland Motorways structure 19FUNDING UPDATE
NEW DEBT1 IS DIVERSIFIED, LOW COST & LONG DATED
DIVERSIFIED SOURCES LOWER COST2,3 TENOR EXTENDED2,4
New debt geographically New debt is lower than current New debt is longer than
diversified average cost average tenor
31 Dec 31 Dec 31 Dec 31 Dec
New debt2 New debt4
2014 20132 2014 20132
Average
Average maturity–
cost – A$ 5.4% 6.2% 6.3% A$ 9.3yrs 4.8yrs 4.2yrs
corporate corporate
Average Average
cost – A$ 5.3% 5.3% 6.4% maturity– 5.1yrs 3.2yrs 2.6yrs
asset A$ asset 5
1. New debt refers to A$ equivalent drawn debt executed in the 12 months ending on 31 December 2014. The drawn amount and currency conversion on new debt are as at issue date, with the currency conversion at the
hedged rate where cross currency swaps are in place, otherwise the spot rate.
2. Data excludes bridge facilities, letters of credit and the M2 refinance tranche A extension. Because of these exclusions, 31 Dec 2014 and 31 Dec 2013 data may differ from results reported elsewhere.
3. Average cost is calculated on a proportional drawn debt basis. US$ debt is excluded because there was only one US$ transaction in the 12 month period.
4. Weighted average maturity.
5. Australian assets only. 20CAPITAL FUNDING REQUIREMENTS
FUNDING SOURCES STRATEGY PENDING MATURITIES
Diversified funding sources Continuing to diversify where pricing is Hills M2 refinance in progress
including bank debt, capital markets favourable
Monitoring a range of markets for
debt, undrawn bank facilities and
Extending the average tenor of debt next corporate raising to cover
DRP1 proceeds
upcoming maturities and project
Prudent capital management supporting
Substantial debt capacity with requirements
consistent distribution growth
approximately $400 million undrawn
Planning underway for M5
at 31 December 2014 Commitment to strong investment grade
refinance
credit metrics
Detailed funding plan in place for
NorthConnex and CityLink Tulla
Widening
1. Dividend Reinvestment Plan
21MARKET UPDATE SCOTT CHARLTON, CEO
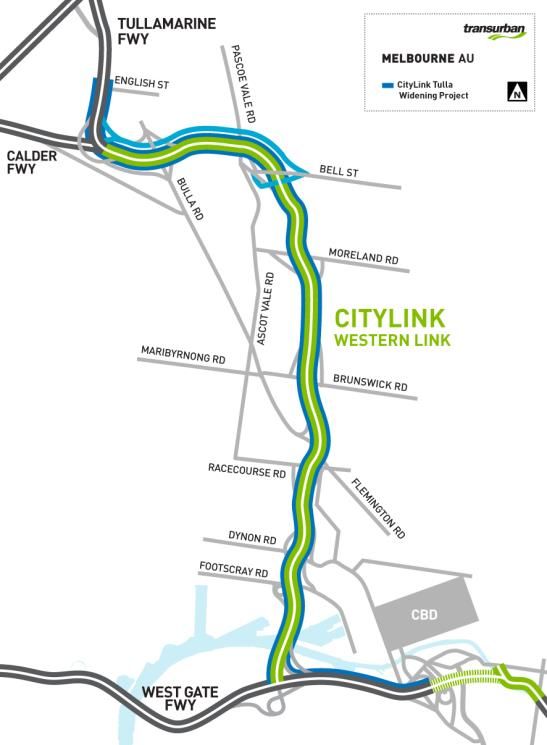
MELBOURNE NETWORK
KEY ACTIVITIES
CityLink Tulla Widening
contractual close reached
October 2014
Construction due to
commence October 2015
Working with Victorian
Government on changes
resulting from suspension of
East West Link
On-going engagement with
Victorian Government to
further enhance the network
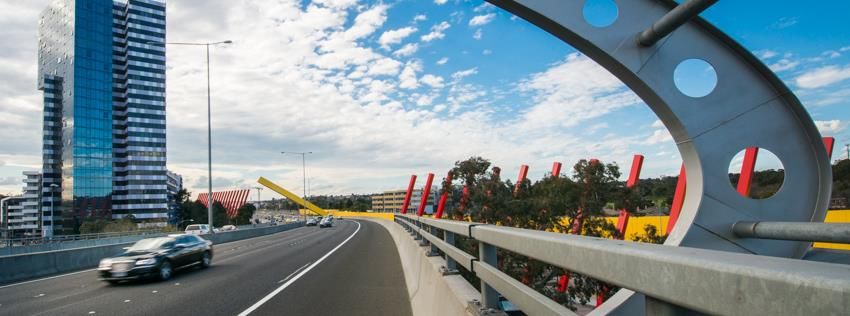
23CITYLINK TULLA WIDENING
OVERVIEW EAST WEST LINK IMPACT
Extra lanes to add 30% Working with government to
more capacity agree on scope of works
Upgraded Bolte Bridge to between Dynon Road and
Moreland Road (previously
West Gate Freeway
being delivered as part of
connection to improve
the East West Link project)
safety
No expected changes to
Improvements to Bell Street
project timeline
entry and exit
Installation of digitised
tolling and traffic
management systems,
enhancing road safety and
reliability
24SYDNEY NETWORK
KEY ACTIVITIES
M5 widening completed December
2014
NorthConnex early work has started
with full construction activities
scheduled to begin in May 2015
WestConnex (Stage 2) timing and
approach to financing to be determined
by Government
GLIDe tolling system roll-out across
Hills M2 and Eastern Distributor
completed
Lane Cove east facing ramp opened
25M5 WEST WIDENING
PROJECT COMPLETED
Completed on time and
budget mid December 2014
Added 50% capacity to the
motorway
Traffic returned to 100km/h
across all three lanes
Truck toll multiplier increase
commenced 1 January
2015 – 2.2x to 3x over eight
quarters
Traffic achieved 150,000
trips in a single day for the
first time following
completion
26M5 WEST WIDENING
PROJECT ECONOMICS
Truck toll multiplier
Increased from 2.2x to 3x
over 8 quarters
Traffic uplift
Additional 35 lane kilometres
Traffic impacts
Concession extension
During construction
Additional 3.3 years to December 2026
Capital costs
$400 million includes $50 million
NSW Government contribution
Aug
2012 2013 2014 2015 2016 2017 2023 2024 2025 2026 2027
27NORTHCONNEX
PROJECT ECONOMICS
Truck toll multiplier and escalation
Westlink M7
from 1x to 3x
over a two New tolls and concession
year period NorthConnex opening
Lane Cove Tolls aligned with M2 main toll point
Tunnel1 from Approximate 29-year concession to June 2048
2x to 3x over
a two year Concession extension
period2
LCT – 11.5 year concession extension to June 20481
Capital costs & expenditure Westlink M7 – 11.4 year concession extension to June 2048
$2.9b including $800m Government
contribution directly Hills M2
2.1 year
$105m Hills concession
M2 integration extension to
works1 June 20481
Payments of
$200m to
State Gov1
2015 2017 2019 2021 2037 2039 2043 2045 2047 2049
1. Ancillary funding agreed between Transurban and NSW Government
2. Quarterly escalation rate for Lane Cove Tunnel trucks to move to the greater of CPI or one percent per quarter (currently CPI) after the high truck multiplier has been phased in 28BRISBANE NETWORK
KEY ACTIVITIES
QM integration program
progressing well and ahead
of budget
Gateway Upgrade North
project:
̶ three tenderers selected
̶ contract to be awarded
mid-2015
Legacy Way opening due
mid-2015
Assessing road
enhancement opportunities
on Logan Motorway
29QUEENSLAND MOTORWAYS
INTEGRATION
PROGRAM TIMELINE
KEY ACTIVITIES
2 JUL 2014 DEC 2014 JUL 2015 JUL 2017
Integration program on
track with benefits starting
to flow including: Redefined leadership Redefined Integrated
̶ reduction in employee team operating model tolling and
costs Organisation structure and corporate back office
aligned to TCL matrix system systems
̶ realignment of alignment
contracts resulting in Post acquisition review
completed with FY15
annualised savings
forecast aligned with due
̶ improved customer diligence assumptions
operations
30INTEGRATION
LOGAN MOTORWAY
PAVEMENT RECTIFICATION WORKS
Traffic levels improving
following completion of
Stage 2 rectification works
in October 2014
Project scope review
under way
Future rectification works
will be designed to minimise
disruption to traffic
ENHANCEMENT OPPORTUNITIES
Investigating short and
medium term solutions to
address congestion points
31NORTHERN VIRGINIA NETWORK
KEY ACTIVITIES
95 Express Lanes
successfully commenced
operation December 2014
Network synergies from
joint operations and
control center with
495 Express Lanes
Additional access at
Tysons Corner in
development by
Government
Opportunities to prove
and extend managed
lanes network over time
3295 EXPRESS LANES
PERFORMANCE
95% E-ZPass penetration1
33% high occupancy vehicle usage,
in line with expectations1
AM peak starts earlier and lasts
longer on 95 than 495:
̶ approximately 3x the trip volume
between 5.00am and 7.00am
̶ an additional hour of AM peak
trip volume2 compared to 495
Optimising lane availability during
peak hours through improved
operations of traffic reversal gates
Strong safety record, including
limited driver confusion and 3
hesitation at decision points
1. Workdays only, includes exempt vehicles
2. More than 2000 trips per hour
3. Subject to final validation 33495 EXPRESS LANES
TRAFFIC & REVENUE GROWTH
New record for highest revenue
achieved in a day – $200,767
(2 December 2014)
New record for highest toll –
USD$14.55 (9 December 2014)
Increased customer value and
synergies across integrated
network
48,000 new customers on 495
in December, an increase of
15% over November
New safety enhancements at
key entry point including on-road
signage and lighting to increase
visibility
34OUTLOOK
STRATEGIC OBJECTIVES CAPITAL STRATEGY OUTLOOK
Further network development Strong support from lenders to Distribution guidance upgraded
opportunities in all markets finance development projects to 39.5 cents for FY15
Significant opportunities from Diversification of funding Upgraded to reflect strong H1
technology and policy sources to decrease average FY15 traffic growth and
development in the medium to cost of debt and increase debt operational performance
long term maturity profile This represents in excess of
Embedded value in TCL Continued growth in 10% compound annual growth
networks to fund development distributions in distributions since FY09
opportunities Commitment to strong
investment grade credit metrics
35APPENDIX 1
RECONCILIATION
KEY CHANGES TO ACCOUNTING FOR ASSETS VERSUS THE PRIOR CORRESPONDING PERIOD
TRANSURBAN          Financial close on the acquisition of QM occurred 2 July 2014. The results of the Transurban Queensland are included from that date with no contribution
QUEENSLAND (QM)     in the prior corresponding period.

CROSS CITY TUNNEL   Transurban acquired the debt of CCT on 30 December 2013 and subsequently the concession asset on 26 June 2014.
(CCT)
                    For statutory reporting purposes, CCT is consolidated into the Transurban Group results in the current period but did not contribute to the result in the prior
                    corresponding period.

                    For proportional reporting purposes, CCT ownership is 100%.

495 EXPRESS LANES   On 11 April 2014 Transurban acquired Fluor Enterprises Inc.’s 10% interest in 495 Express Lanes, increasing proportional Group ownership to 77.5%.

                    On 4 June 2014 495 Express Lanes was recapitalised. Transurban’s partner in DRIVe, CP2, did not participate in the recapitalisation therefore
                    Transurban's proportional ownership increased to 94%.

                    Transurban’s proportional interest in 495 Express Lanes in the prior corresponding period was 67.5%. It was not consolidated for statutory reporting
                    purposes at that time.

95 EXPRESS LANES    On 11 April 2014 Transurban acquired Fluor Enterprises Inc.’s 10% interest in 95 Express Lanes, increasing proportional Group ownership to 77.5%.

                    Transurban’s proportional interest in 95 Express Lanes in the prior corresponding period was 67.5%. It was not consolidated for statutory reporting
                    purposes at that time.

DRIVE OPERATIONS    As a result of Transurban Group's recapitalisation of 495 Express Lanes Transurban now 'controls' DRIVe operations as it controls the 495 Express
                    Lanes. It is therefore consolidated into the Group's result from 4 June 2014.

POCAHONTAS 895      DRIVe completed the transfer of Pocahontas 895 to lenders on 14 May 2014. From that date proportional ownership is 0% (previously 75.0%).
                    The prior corresponding period includes the results of Pocahontas 895 for the entire period.

                                                                                                                                                                                      37
RECONCILIATION
FREE CASH
FREE CASH CALCULATION SOURCE OF INFORMATION/EXPLANATION
Cash flows from operating activities before transaction and integration cash Statutory Transurban Holdings Limited cash flow excluding transactions costs and integration related cash payments incurred on the acquisition of Queensland
payments Motorways (includes cash inflow from M7 TLNs and M5 loan notes)
Less transaction and integration cash payments from non 100 per cent owned
Transaction and integration related cash payments incurred on the acquisition of Queensland Motorways
entities
Cash flows from operating activities (refer Group Statutory accounts) Statutory Transurban Holdings Limited cash flow
For statutory purposes payments for maintenance are classified as operating activities. For the calculation of free cash Transurban removes these payments and replaces
Add back cash payments for maintenance of intangible assets them with increases to the maintenance provision recognised in P&L (refer below). This provides a smoother representation of maintenance spend and reflects the
incurrence of the damage through the facilities use.
Add back transaction and integration cash payments from non 100 per cent
Transaction and integration related cash payments incurred on the acquisition of Queensland Motorways
owned entities
100% of the operating cash flows of M1 Eastern Distributor, Transurban Queensland, 495 Express Lanes and Transurban DRIVe are included in the statutory results
Less consolidated cash flows from non 100 per cents owned entities however the distribution received by Transurban better reflects the cash available for distribution to Transurban security holders. The cash flows from operating activities
are therefore eliminated and, where applicable, replaced with distributions received.
Total
Adjust: dividends and distributions received and maintenance expenditure
M1 Eastern Distributor – distribution Cash distribution received from M1 Eastern Distributor by Transurban
Cash distribution received from M5 Interlink by Transurban and interest received on Transurban's long term loan to M5 (represents a portion of Transurban's ownership
M5 Interlink – distribution and Term Loan Note interest
interest)
Cash distribution received from Transurban Queensland (Sun Group structure) by Transurban and interest received on Transurban’s long term loan to the Transurban
Transurban Queensland – distribution and shareholder loan note interest Queensland (represents a portion of Transurban’s ownership interest)
M7 Term Loan Note interest Interest received on Transurban's long term loan to M7
Allowance for maintenance of capital expenditure for CityLink, Hills M2 and Expenditure for maintenance of intangible assets is provided for over the period of the facilities use. The annual charge to recognise this provision reflects the yearly
Lane Cove Tunnel, Cross City Tunnel and e-Tag expenditure damage to the facility requiring maintenance.
Free cash
38APPENDIX 2 DETAILED FINANCIALS
STATUTORY RESULTS
  HALF-YEAR TO 31 DECEMBER 2014                31 DEC 14 ($M)   31 DEC 13 ($M)   % CHANGE
Toll revenue                                      738            451              63.7%
Fee and other revenue                             71             47               49.8%
Construction revenue                              152            54              183.4%
Business development & other revenue               3             20              (81.0%)
Total revenue                                     964            572              68.6%
Road operating costs                             (176)          (113)             55.6%
Corporate costs                                   (34)           (18)             93.3%
Business development costs                        (6)            (9)             (35.4%)
Construction costs                               (151)           (51)            196.0%
Transaction and integration costs                (416)            -              100.0%
Total costs                                      (783)          (191)            310.4%

EBITDA                                            181            381             (52.5%)
Depreciation and amortisation                    (275)          (160)             71.9%
Finance income                                    48             58              (18.7%)
Finance costs                                    (337)          (187)             79.5%
Net finance costs                                (289)          (129)            123.7%
Share of equity accounted (losses) / profits       9             (15)            160.4%
(Loss)/Profit before tax                         (374)           77              (586.0%)
Tax benefit                                       20              4              406.7%
Net (loss)/profit                                (354)           81              (536.7%)

                                                                                            40
PROPORTIONAL RESULTS
HALF-YEAR TO 31 DECEMBER 2014
31 DEC 14 ($M) 31 DEC 13 ($M) % CHANGE
Toll revenue 761 556 36.7%
Fee and other revenue 71 58 23.0%
Total revenue 832 614 35.4%
Operating costs (172) (129) 33.6%
Business development costs (2) (5) (58.3%)
Corporate costs (22) (17) 28.3%
Total costs (196) (151) 29.9%
EBITDA excluding significant items 636 463 37.4%
Significant items (264) - (100.0%)
EBITDA 372 463 (19.8%)
41RESULT BY ASSET – 100%
CONSOLIDATED ASSETS – 31 DECEMBER 2014 ($ MILLIONS)
CITYLINK ROAM TOLLING &
(VICTORIA) HILLS M2 LANE COVE TUNNEL CROSS CITY TUNNEL M1 ED TOLLAUST TOTAL NSW
Toll revenue 289 110 38 28 56 - 232
Fee & other revenue 28 3 2 1 2 14 22
Total revenue 317 113 40 29 58 14 254
Total cost (47) (20) (15) (12) (18) (5) (70)
Underlying EBITDA 270 93 25 17 40 9 184
EBITDA margin 93.4% 85.2% 65.1% 58.2% 70.9% - 78.8%
Significant items - - - - - - -
EBITDA 270 93 25 17 40 9 184
Depreciation & amortisation (76) (41) (12) (12) (26) - (91)
Net finance costs (14) (17) (6) (6) (20) - (49)
Foreign exchange - - - - - - -
Share of equity accounted losses/profits - - - - - - -
Profit/(loss) before tax 180 35 7 (1) (6) 9 44
Income tax benefit (expense) (31) 6 (3) - 6 (2) 7
Profit after tax 149 41 4 (1) - 7 51
Ownership 100.0% 100.0% 100.0% 100.0% 75.1% 100.0%
42RESULT BY ASSET – 100%
CONSOLIDATED ASSETS – 31 DECEMBER 2014 ($ MILLIONS)
495 95
GATEWAY LOGAN GO BETWEEN TOTAL EXPRESS EXPRESS CORP TOTAL CONSOL
MOTORWAY MOTORWAY CLEM7 BRIDGE CORP QLD QUEENSLAND LANES LANES DRIVe US TOTAL US OTHER GROUP
Toll revenue 95 73 24 6 - 198 19 - - - 19 - 738
Fee & other revenue 8 7 1 - - 16 4 - - 2 6 - 72
Total revenue 103 80 25 6 - 214 23 - - 2 25 - 810
Total cost (28) (27) (14) (2) - (71) (13) - (3) - (16) (9) (213)
Underlying EBITDA 75 53 11 4 - 143 10 - (3) 2 9 (9) 597
Underlying EBITDA margin 80.8% 72.4% 45.6% 75.3% - 73.3% 48.5% - - - - - 24.6%
Significant items - - - - (406) (406) - - - - - (10) (416)
EBITDA 75 53 11 4 (406) (263) 10 - (3) 2 9 (19) 181
Depreciation & amortisation (45) (17) (19) (4) - (85) (10) - (1) - (11) (12) (275)
Net finance costs - - (8) - (111) (119) (25) - - (39) (64) (35) (281)
Foreign exchange - - - - - - - - - (8) (8) - (8)
Share of equity accounted losses/profits - - - - - - - - - - - 9 9
Profit/(loss) before tax 30 36 (16) - (517) (467) (25) - (4) (45) (74) (57) (374)
Income tax benefit (expense) 4 (1) 2 1 12 18 - - 4 12 16 10 20
Profit from continuing operations 34 35 (14) 1 (505) (449) (25) - - (33) (58) (47) (354)
Ownership 62.5% 62.5% 62.5% 62.5% 62.5% 94% 77.5% 75% 100% 100%
US dollar entity results have been translated to Australian dollars for presentation purposes. 43RESULT BY ASSET – 100%
EQUITY ASSETS – 31 DECEMBER
2014 ($ MILLIONS)
M5 SOUTH WEST
MOTORWAY WESTLINK M7 TOTAL
Toll revenue 98 127 225
Fee & other revenue 10 3 13
Total revenue 108 130 238
Total cost (15) (18) (33)
EBITDA 93 112 205
EBITDA margin 95.1% 88.1% 91.1%
Depreciation & amortisation (38) (34) (72)
Net finance costs (14) (124) (138)
Profit/(loss) before tax 41 (46) (5)
Income tax benefit (expense) (23) 3 (20)
Net profit 18 (43) (25)
Ownership 50.0% 50.0%
44RECONCILIATION
STATUTORY INCOME STATEMENT TO EBITDA – 31 DECEMBER 2014 ($ MILLIONS)
OFFSET CONSTRUCTION
100% ACCOUNTING REALLOCATION
CONSOLIDATED NET BUSINESS DISCLOSURE UNDER OF CAPITALISED SIGNIFICANT
ASSETS DEVELOPMENT AASB I 12 COSTS ITEMS STATUTORY P&L
Toll revenue 738 - - - - 738
Fee & other road revenue 71 - - - - 71
Construction revenue 1 - 151 - - 152
Business development and other revenue - 3 - - - 3
Total revenue 810 3 151 - - 964
Operational costs (187) - - 11 - (176)
Corporate costs (36) - - 2 - (34)
Business development costs (9) (3) - 6 - (6)
Construction costs - - (151) - - (151)
Transaction and integration costs - - - - (416) (416)
Capitalised overheads 19 - - (19) - -
Total costs (213) (3) (151) - (416) (783)
Underlying EBITDA 597 - - - (416) 181
Significant items (416) - - - 416 -
EBITDA 181 - - - - 181
Depreciation and amortisation (275) - - - - (275)
Finance income 48 - - - - 48
Finance costs (337) - - - - (337)
Share of equity accounted losses 9 - - - - 9
Profit before tax (374) - - - - (374)
Income tax benefit 20 - - - - 20
Profit from continuing operations (354) - - - - (354)
45RECONCILIATION
STATUTORY EBITDA TO PROPORTIONAL EBITDA
31 DEC 14 ($M) 31 DEC 13 ($M) % CHANGE
Statutory EBITDA 181 381 (52.5%)
Less: EBITDA attributable to Non-controlling interest - Eastern Distributor (10) (9) (16.2%)
Less: EBITDA attributable to Non-controlling interest - 495 Express Lanes (1) - (100.0%)
Less: EBITDA attributable to Non-controlling interest - DRIVe operations 1 - 100.0%
Less: EBITDA attributable to Non-controlling interest – Queensland 98 - 100.0%
Add: M5 proportional EBITDA 47 44 5.6%
Add: M7 proportional EBITDA 56 48 16.8%
Add: Pocahontas proportional EBITDA - 4 (100.0%)
Add: DRIVe proportional EBITDA - (3) 100.0%
Add: 495 proportional EBITDA - (2) 100.0%
Proportional EBITDA 372 463 (19.8%)
46RESULT BY ASSET – 100%
CONSOLIDATED ASSETS – 31 DECEMBER 2013 ($ MILLIONS)
LANE COVE M1 EASTERN ROAM TOLLING
CITYLINK HILLS M2 TUNNEL DISTRIBUTOR AND TOLLAUST OTHER TOTAL
Toll revenue 269 94 35 53 - - 451
Fees and other revenue 26 3 2 1 13 20 65
Total revenue 295 97 37 54 13 20 516
Total cost (52) (19) (14) (20) (6) (24) (135)
EBITDA 243 78 23 34 7 (4) 381
EBITDA margin 90.3% 83.7% 64.7% 64.8% - - 84.6%
Depreciation and amortisation (73) (37) (12) (26) (1) (11) (160)
Net finance costs (17) (26) (7) (19) - (60) (129)
Foreign exchange - - - - - - -
Share of equity accounted losses/profits - - - - - (15) (15)
Profit/(loss) before tax 153 15 4 (11) 6 (90) 77
Income tax benefit (expense) (21) 8 (2) 5 (2) 16 4
Net profit 132 23 2 (6) 4 (74) 81
Ownership 100.0% 100.0% 100.0% 75.1% 100.0% 100.0%
47RESULT BY ASSET – 100%
EQUITY ASSETS – 31 DECEMBER 2013 ($ MILLIONS)
M5 SOUTH WEST POCAHONTAS 495 EXPRESS
MOTORWAY WESTLINK M7 895 LANES DRIVE TOTAL
Toll revenue 93 115 9 12 - 229
Fee and other revenue 9 2 - 3 - 14
Total revenue 102 117 9 15 - 243
Total cost (14) (22) (3) (19) (3) (61)
EBITDA 88 95 6 (4) (3) 182
EBITDA margin 94.0% 83.3% 61.8% (35.3%) - 79.4%
Depreciation and amortisation (36) (34) - (11) - (81)
Net finance costs (13) (152) (11) (36) (1) (213)
Profit/(loss) before tax 39 (91) (5) (51) (4) (112)
Income tax benefit (expense) (22) 9 8 - 17 12
Net profit 17 (82) 3 (51) 13 (100)
Ownership 50.0% 50.0% 75.0% 67.5% 75.0%
US dollar entity results have been translated to Australian dollars for presentation purposes. 48RECONCILIATION
STATUTORY INCOME STATEMENT TO EBITDA – 31 DECEMBER 2013 ($ MILLIONS)
100% OTHER OFFSET CONSTRUCTION REALLOCATION
CONSOLIDATED REVENUE NET BUSINESS ACCOUNTING DISCLOSURE OF CAPITALISED STATUTORY
ASSETS REALLOCATION DEVELOPMENT UNDER AASB I 12 COSTS P&L
Toll revenue 451 - - - - 451
Fee & other road revenue 48 (1) - - - 47
Construction revenue 17 - - 37 - 54
Business development and other revenue - 2 18 - - 20
Total revenue 516 1 18 37 - 572
Operational costs (104) (1) (12) - 4 (113)
Corporate costs (19) - - - 1 (18)
Business development costs (8) - (6) - 5 (9)
Construction costs (14) - - (37) - (51)
Capitalised overheads 10 - - - (10) -
Total costs (135) (1) (18) (37) - (191)
EBITDA 381 - - - - 381
Depreciation and amortisation (160) - - - - (160)
Finance income 58 - - - - 58
Finance costs (187) - - - - (187)
Share of equity accounted losses (15) - - - - (15)
Profit before tax 77 - - - - 77
Income tax benefit 4 - - - - 4
Net profit for the year 81 - - - - 81
49FREE CASH FLOW
31 DEC 14 31 DEC 13 %
($M) ($M) CHANGE
Cash flows from operating activities before transaction and integration cash payments 379 227 67.0%
Less transaction and integration cash payments from non 100 per cent owned entities (406) - (100.0%)
Cash flows from operating activities (refer Group Statutory accounts) (27) 227 (112.3%)
Add back cash payments for maintenance of intangible assets 53 7 613.3%
Add back transaction and integration cash payments from non 100 per cent owned entities 406 - 100%
Less consolidated cash flows from non 100 per cents owned entities* (187) (42) (345.2%)
245 192 27.1%
Adjust: dividends and distributions received and maintenance expenditure
M1 Eastern Distributor – distribution 14 13 9.4%
M5 Interlink – distribution and Term Loan Note interest 27 28 (2.9%)
Transurban Queensland – distribution and shareholder loan note interest 52 - 100.0%
M7 Term Loan Note interest 57 21 172.4%
Allowance for maintenance of capital expenditure for CityLink, Hills M2 and Lane Cove
(17) (14) (19.1%)
Tunnel, Cross City Tunnel and e-Tag expenditure
Free cash 378 240 57.5%
* Consolidated cash flows from non 100 per cent owned entities includes Eastern Distributor, Transurban Queensland, DRIVe and 495 Express Lanes. In the pcp, this included
Eastern Distributor only.
50RECONCILIATION OF FREE CASH
31 DEC 14 31 DEC 13
% CHANGE
($M) ($M)
Proportional EBITDA 636 463 37.4%
Adjusted for proportional:
Maintenance provision 33 24 34.8%
Operating and working capital movements (3) (18) (84.9%)
Non-cash items (11) (7) 64.2%
Net interest paid (233) (214) 8.7%
Tax paid (13) (12) 9.2%
Proportional operating cash 409 236 73.3%
Excludes operating cash contribution from M1, M7, M5 and DRIVe (164) (44) 275.2%
Includes distributions from M1 and M5 149 62 143.4%
Maintenance of intangibles provision recognised in 100% assets (including tags purchased) (16) (14) 17.2%
Free cash 378 240 57.5%
Weighted average number of securities issued (millions) 1,906 1,486 28.4%
Free cash per security (cents) weighted average securities 19.8 16.2 22.4%
51MAINTENANCE PROVISION
RECONCILIATION
ADDITIONAL MAINTENANCE PROVISION 31 DEC 14 31 DEC 13 31 DEC 14 31 DEC 13
CASH SPEND
RECOGNISED DURING THE YEAR ($M) ($M) ($M) ($M)
CityLink 7 7 CityLink (3) (5)
Hills M2 3 2 Hills M2 (3) 1
Lane Cove Tunnel 3 3 Lane Cove Tunnel (2) -
Cross City Tunnel 3 - Cross City Tunnel - -
M1 – Eastern Distributor 6 8 M1 – Eastern Distributor (12) (3)
M5 South West Motorway 2 2 M5 South West Motorway - (1)
Westlink M7 (1) 4 Westlink M7 - -
Gateway Motorway 3 - Gateway Motorway - -
Logan Motorway 8 - Logan Motorway (32) -
Go Between Bridge - - Go Between Bridge - -
CLEM7 3 - CLEM7 - -
Pocahontas 895 - 1 Pocahontas 895 - -
495 Express Lanes 3 5 495 Express Lanes (1) -
US dollar entity results have been translated to Australian dollars for presentation purposes.
Asset values presented at 100%.
52NET FINANCE COSTS PAID
31 DEC 14 ($M) 31 DEC 13 ($M)
NET INTEREST NET INTEREST NET INTEREST NET INTEREST
PAID (100%) PAID (PROP) PAID (100%) PAID (PROP)
CityLink (12) (12) (15) (15)
Hills M2 (24) (24) (22) (22)
Lane Cove Tunnel (5) (5) (6) (6)
Cross City Tunnel (3) (3) - -
M1 ED – Other (16) (12) (23) (17)
DRIVe - - (6) (5)
495 Express Lanes (6) (6) (16) (11)
Transurban Queensland (73) (46) - -
Corporate – M7 TLN 57 57 21 21
Corporate – M5 TLN 2 2 1 1
Corporate – Other (100) (100) (109) (109)
Corporate – Cross City Tunnel (1) - - -
M5 South West Motorways (10) (5) (12) (6)
M5 South West Motorways - TLN (3) (2) (2) (1)
Westlink M7 – TLN (114) (57) (42) (21)
Westlink M7 – Other (41) (20) (47) (23)
53APPENDIX 3 DETAILED TREASURY AND FUNDING
FUNDING STRUCTURE
                                                                                                                               Transurban

       DRAWN                   DEBT1
                                                                    Asset Debt                                                                                                       Corporate Debt
                                                                  (Non-Recourse)

                             Australia                                                                    USA                                                     Capital Markets                        Bank Debt

                               M2                                               495 Express Lanes                    95 Express Lanes                                            AMTN                                  Term Debt
                             A$0.7bn                                                                                                                                            A$0.8bn                                 A$0.1bn
                                                                                                                                                                                                                       US$0.1bn
               M5                        Cross City Tunnel                                       PABs                                PABs                                        EMTN
             A$0.7bn                         A$0.3bn                                            US$0.2bn                            US$0.2bn                                     €1.1bn
                                                                                                                                                                                                                     Working Capital
               M7                        Lane Cove Tunnel                                        TIFIA                               TIFIA                                       Maple                                  A$0.1bn
             A$1.3bn                         A$0.3bn                                            US$0.7bn                            US$0.3bn                                    C$0.3bn                                US$0.3bn

                                           Queensland                                                                                                                            USPP
                M1                                                                                                                                                              US$1.0bn
                                           Motorways
                                                                                                                                                                                AU$0.1bn

                         AMTN                                 AMTN
                        A$0.3bn                              A$0.5bn

                       Term Debt                       Term Debt / Other
                        A$0.2bn                            A$2.1bn
                                                                                                                                                                                                      Bank Debt
                                                             CLEM7                                                                                                                                    Capital Markets Debt
                                                             A$0.3bn
                                                                                                                                                                                                      Government Debt

1. Debt values are drawn debt in the currency of issue as at 31 December 2014 including accreted interest; the debt values exclude the impact of cross-currency swaps. The full value of drawn debt
is shown which overstates Transurban’s ownership share of the debt. Excludes letters of credit.
                                                                                                                                                                                                                                       55
GROUP DEBT AT 31 DECEMBER 2014
CORPORATE DRAWN DEBT AUD ($ MILLION) USD ($ MILLION)
Working capital lines1 130 251 1. A$850m facilities. A$398m available after deducting A$26m letters of credit issued and converting
US$ at the spot exchange rate ($0.8202 at 31 December 2014). Where drawings under a facility
Term bank debt 125 93 after the FX conversion exceed the facility limit, the amount available is assumed to be zero.
US Private Placements 1,201 162
Domestic AUD bonds 800 –
EMTN (C$ and Euro Notes) 1,465 305
Total 3,721 811
Separate letters of credit2 42 28 2. Issued in relation to corporate, CityLink, Hills M2 and 95 Express Lanes.
NON RECOURSE (AUD $ MILLION) ASSET DEBT OWNERSHIP PROPORTIONAL
Sun Group3 2,566 62.5% 1,604 3. A$334m in available facilities (A$209m proportional).
Clem 74 270 62.5% 169 4. A$5m in available working capital facilities (A$3m proportional).
Lane Cove Tunnel 260 100.0% 260
Cross City Tunnel 277 100.0% 277
M1 – Eastern Distributor 525 75.1% 394
Hills M2 – Hills Motorway 740 100.0% 740
M5 Interlinks Roads5 711 50.0% 355 5. A$24m in available facilities including letter of credit and standby facilities (A$12m proportional).
Westlink M7 1,270 50.0% 635
Total 6,619 4,434
NON RECOURSE (US $ MILLION) ASSET DEBT OWNERSHIP PROPORTIONAL
495 Express Lanes – Senior6 225 94.0% 211 6. Letters of credit maturing in June 2016 for the same value support the 495 Express Lanes Senior bonds.
495 Express Lanes – TIFIA 702 94.0% 660
95 Express Lanes – Senior 242 77.5% 188
95 Express Lanes – TIFIA7 297 77.5% 230 7. US$9m undrawn TIFIA facility (US$7m proportional).
Total 1,466 1,289 56TOTAL GROUP DRAWN DEBT
PROPORTIONAL BASIS
31 DEC 2014 30 JUNE 2014 MOVEMENT
EXPLANATION3
AUD1 ($M) ($M) ($M)
A$833 million Euro Notes raised and used to prepay A$375 million term debt. A$136 million US private
Corporate 3,721 3,268 453
placement repaid with remaining proceeds. A$130 million in working capital lines also drawn.
A$1,604 million debt raised to fund Queensland Motorway and A$169 million Clem 7 debt acquired. A$23
Non recourse 4,434 2,634 1,800
million drawn for M5 widening project and A$5 million increase for M7 refinance upfront fees.
Total 8,155 5,902 2,253
31 DEC 2014 30 JUNE 2014 MOVEMENT
EXPLANATION3
USD2 ($M) ($M) ($M)
Corporate 811 793 18 US$18 million increase in working capital drawn.
Increase in TIFA funding comprising US$74 million drawings and US$3 million accreted interest for 95
Non recourse 1,289 1,197 92
Express Lanes and US$14 million accreted interest for 495 Express Lanes.
Total 2,100 1,990 110
1. A$ represents debt issued in A$ plus debt that has been issued in C$, Euro and US$ and has been swapped back into A$.
2. US$ represents debt issued in US$ (including 95 Express Lanes, 495 Express Lanes and tranche C of the 2006 USPP which was not swapped back to A$) and debt issued in Euro that has been swapped back in to US$.
3. Amounts may differ due to rounding. 57KEY DEBT METRICS
31 DECEMBER 2014 30 JUNE 2014
TRANSURBAN NON TRANSURBAN NON
GROUP CORPORATE RECOURSE GROUP CORPORATE RECOURSE
Weighted average maturity (years)1 7.6 yrs 4.8 yrs 9.2 yrs 7.5 yrs 3.9 yrs 10.4 yrs
Weighted average cost of AUD debt2 5.7% 6.2% 5.3% 6.3% 6.4% 6.2%
Weighted average cost of USD debt2 4.0% 3.1% 4.5% 4.0% 3.1% 4.5%
Hedged3 86.0% 88.3% 84.2% 94.1% 91.6% 96.8%
Gearing (proportional debt to
39.6% 36.4%5
enterprise value)4
Corporate senior interest cover ratio
3.3 2.9
(historical ratio for 12 months)
Corporate debt rating
A- / Baa1/ A- A- / Baa1/ A-
(S&P / Moody’s / Fitch)
1. Weighted average maturity calculated on drawn funds at A$ value of debt. C$, Euro and US$ debt converted at the hedged rate where cross currency swaps are in place. Unhedged US$ debt converted at the
spot exchange rate ($0.8202 at 31 December 2014 and $0.9420 at 30 June 2014 ).
2. Weighted on a proportional drawn debt basis.
3. Hedged percentage comprises fixed rate debt and floating debt that has been hedged and is a weighted average of total proportional drawn debt in A$.
4. Proportional Group drawn debt in A$. C$, Euro and US$ debt converted at the hedged rate where cross currency swaps are in place. Unhedged US$ debt converted at the spot exchange rate ($0.8202 at
31 December 2014 and $0.9420 at 30 June 2014 ). The security price was $8.58 at 31 December 2014 and $7.39 at 30 June 2014 with 1,906m securities on issue at 31 December 2014 and 1,896m securities
on issue at 30 June 2014).
5. 41.0% after adjusting for Queensland Motorways debt which was raised/closed on 2 July 2014. 58CORPORATE DEBT MATURITIES BY FINANCIAL YEAR – AS AT 31 DECEMBER 2014 1. Debt is shown in the financial year in which it matures. 2. Debt values are in A$ as at 31 December 2014. C$, Euro and US$ debt are converted at the hedged rate where cross currency swaps are in place. Unhedged US$ debt is converted to A$ at the spot exchange rate ($0.8202 at 31 December 2014). 59
ASSET DEBT MATURITIES
BY FINANCIAL YEAR – AS AT 31 DECEMBER 2014

1.   The full value of debt facilities is shown as this is the value of debt for refinancing purposes. This overstates Transurban’s ownership share of the debt.
2.   Debt is shown in the financial year in which it matures.
3.   US$ debt is converted to A$ at the spot exchange rate ($0.8202 at 31 December 2014).
4.   The A$274m maturing in 2016 is the letters of credit that support the 495 Express Lanes Senior bonds maturing in 2048.                                        60
APPENDIX 4
PORTFOLIO SUMMARY
OPERATING ASSET PORTFOLIO
    SUMMARY STATISTICS
                                                                              M5 SOUTH WEST                                        M1 EASTERN                                                             CROSS CITY
                                                      CITYLINK                                            HILLS M2                                             WESTLINK M7      LANE COVE TUNNEL
                                                                                MOTORWAY                                           DISTRIBUTOR                                                             TUNNEL
OVERVIEW                                                  VIC                        NSW                     NSW                        NSW                         NSW                NSW                   NSW
Opening date                                           Dec 2000                     Aug 1992              May 1997                    Dec 1999                    Dec 2005           Mar 2007              Aug 2005
Concession period from financial close               34 years (1)1                  34.3 years           49 years (2)2                 48 years                31 years (10)2      30 years (10)2           30 years
Concession date                                        Jan 2035                     Dec 2026               Jun 2048                    Jul 2048                   Jun 2048           Jun 2048              Dec 2035
PHYSICAL DETAILS
Length – total                                    22km in 2 sections                   22km                  21km                        6km                        40km              3.8km                  2.1km
Length – surface                                        16.8km                         22km                 20.4km                      4.3km                       40km              0.3km                  0 km
Length – tunnel                                          5.2km                           –                    0.6km                      1.7km                            –           3.5km                  2.1km
                                                                                                                                          2x3                                           2x2                    2x2
Lanes                                            2x4 in most sections                   2x33                    2x3                                                      2x2
                                                                                                                                   2x2 some sections                              2x3 some sections   2x3 some ramp sections
OWNERSHIP
TCL ownership                                            100%                          50%                    100%                       75.1%                           50%           100%                  100%
TOLLING
ETC status                                             Electronic                   Electronic              Electronic                 Electronic                  Electronic        Electronic            Electronic

Truck multiplier                               LCV: 1.6x | HCV: 1.9x             moving to 3.0x                 3x                         2x                       1x (3x)4          2x(3x)4                  2x

Toll escalation                                                                                                                                Refer to the next slide
Toll increase increment                                                                $0.50

1.Under terms of CityLink Tulla widening in-principle agreement with the Victorian Government, extension of the concession term by a period of one year.
2.Concession extensions following the financial close of NorthConnex.
3.Configuration post M5 widening.
4.Truck toll multiplier increase over a 2 year period , following the financial close of NorthConnex.
                                                                                                                                                                                                                         62
OPERATING ASSET PORTFOLIO
SUMMARY STATISTICS
GO BETWEEN LEGACY 495 EXPRESS 95 EXPRESS
GATEWAY LOGAN CLEM7
BRIDGE WAY LANES LANES
OVERVIEW QLD QLD QLD QLD QLD USA USA
Opening date Dec 1986 Dec 1988 Mar 2010 July 2010 Q4FY15 Nov 2012 Jan 2015
Concession period from financial close 37 years 37 years 37 years 49 years 50 years 73 years 73 years
Concession date Dec 2051 Dec 2051 Aug 2051 Dec 2063 June 2065 Dec 2087 Dec 2087
PHYSICAL DETAILS
Length – total 23.1 38.71 6.8 0.3 5.7 22km 46.6km
Length – surface 23.1 38.7 2.0 0.3 1.1 22km 46.6km
Length – tunnel - - 4.8 - 4.6 – -
6,8 and 10 (various) 2 and 3 reversible
Lanes 2x2 2x2 2x2 2x2 2x2 HOT lanes
12 Gateway Bridge HOT lanes
OWNERSHIP
TCL ownership 62.5% 62.5% 62.5% 62.5% 62.5% 94% 77.5%
TOLLING
ETC status Electronic Electronic Electronic Electronic Electronic Electronic Electronic
No multiplier
LCV – 1.5x LCV – 1.5x LCV – 1.5x LCV – 1.5x No multiplier trucks
Truck multiplier trucks >2 axle
HCV – 2.65x HCV – 2.65x HCV – 2.65x HCV – 2.65x TBD >2axle not permitted
not permitted
Toll escalation On next slide Dynamic no cap Dynamic no cap
Toll increase increment
1. Length includes 9.8km of Gateway Extension Motorway. 63TOLLING ESCALATION
EMBEDDED INFLATION PROTECTION
MOTORWAY ESCALATION1
CityLink Escalated quarterly by the greater of quarterly CPI or 1.1065% (being 4.5% p.a. as a quarterly compound rate) for the first 15
years, then quarterly by CPI. This is subject to a cap of annual CPI plus 2.5%, which cannot be exceeded. Under the terms of
the CityLink Tulla widening, escalation at the greater of quarterly CPI or 1.1065% would be retained for 1 additional year.
Hills M2 Escalated quarterly by the greater of quarterly CPI or 1%.
Lane Cove Tunnel Escalated quarterly by quarterly CPI. The toll cannot be lowered as a result of deflation, however, until inflation counteracts the
deflation the toll cannot be increased.
M1 Eastern Distributor Escalated quarterly by the greater of a weighted sum of quarterly AWE and quarterly CPI or 1%.
Westlink M7 Escalated or deescalated quarterly by quarterly CPI.
M5 South West Motorway Escalated quarterly by quarterly CPI. The toll cannot be lowered as a result of deflation,
however, until inflation counteracts the deflation the toll cannot be increased.
Cross City Tunnel Escalated 4% annually to December 2011; 3% annually to December 2017; CPI to concession end
Logan Tolls escalate annually at Brisbane CPI
Gateway Tolls escalate annually at Brisbane CPI
CLEM7 Tolls escalate annually at Brisbane CPI
Go Between Bridge 1. Escalation description
Tolls escalate annually at Brisbane CPI
denotes theoretical toll
Legacy Way only. Actual toll increases
Tolls escalate annually at Brisbane CPI
on M1, Hills M2 and M5 in
495 Express Lanes Sydney are based on the
Dynamic, uncapped
rounding of theoretical tolls
95 Express Lanes in 50 cent increments.
Dynamic, uncapped
64SUMMARISED GROUP STRUCTURE
STAPLED STRUCTURE
TRANSURBAN HOLDINGS LIMITED TRANSURBAN HOLDING TRUST TRANSURBAN INTERNATIONAL LIMITED
ROAD/OPERATING
CORPORATE ENTITIES ROAD/OPERATING ENTITIES OTHER ENTITIES CORPORATE ENTITIES
ENTITIES
Including: Companies operating and maintaining roads Trusts holding asset and financing Transurban Finance Trust Holding entity employing US-based staff
Employing entity
100% owned
Financing entity Westlink Partner Holding
CityLink Melbourne Limited CityLink Trust
Trustee entities entities
Hills Motorway Limited (M2) Hills Motorway Trust (M2)
LCT MRE Pty Limited (LCT) LCT MRE Trust (LCT)
Transurban CCT P/L (CCT) Transurban CCT Trust (CCT)
75.1% Airport Motorway Limited (M1) Airport Motorway Trust (M1)
Consolidated
Transurban DRIVe Holdings LLC 75%
62.5% Sun Group Holdings Pty Ltd Sun Invest Trust Capital Beltway Express LLC 94%
95 Express Lanes LLC 77.5%
equity accounting
Not consolidated
50% WSO Co Pty Limited (M7)* Westlink Motorway Partnership (M7)
50% Interlink Roads Pty Limited (M5)
Built, operates and maintains road, and has
own borrowings. Funding from non-recourse
borrowings.
*NorthConnex impact on structure not reflected – no change expected to operating/tax reporting entity. 65FY15 HALF-YEAR RESULTS 12 FEBRUARY 2015
You can also read


