Investor Roadshow Presentation - North America & Asia - October / November 2019
←
→
Page content transcription
If your browser does not render page correctly, please read the page content below
Investor Roadshow Presentation
North America & Asia – October / November 2019
DELIVERING FUTURE ENERGY

SPARK INFRASTRUCTURE – AT A GLANCE
ASX-listed owner of leading essential service infrastructure

    $3.6bn                                 MARKET
                                           CAPITALISATION(1)
                                           S&P/ASX 100
                                                                                         Distribution
                                                                                         Victoria Power Networks
                                                                                                                                                    Transmission
                                                                                                                                                    TransGrid
                                                                                                                                                                                              Renewables
                                                                                                                                                                                              Bomen Solar Farm
                                                                                         and SA Power Networks

    $6.2bn CONTRACTED     ASSET
           BASE (Proportional)
                                       REGULATED AND
                                                                          49%
                                                                           SPARK INFRASTRUCTURE
                                                                                                                                15%
                                                                                                                                SPARK INFRASTRUCTURE
                                                                                                                                                                                     100%
                                                                                                                                                                                     SPARK INFRASTRUCTURE
                                                                           OWNERSHIP                                            OWNERSHIP                                            OWNERSHIP

                     $17bn
                     TOTAL ELECTRICITY
                                                                          $10.50bn                                              $6.95bn                                              $0.19bn
                     NETWORK ASSETS(2)                                     REGULATED ASSET                                      REGULATED AND                                        CONTRACTED ASSET BASE
                                                                           BASE                                                 CONTRACTED ASSET BASE                                AT COMPLETION
                     SUPPLYING
                     5.6m
                     HOMES AND BUSINESSES                                     82%                                                   15%                                                3%               WAGGA
                                                                                                                                                                                                        WAGGA

                     OVER
                     5,300                                                 SKI PROPORTIONAL                                     SKI PROPORTIONAL                                     SKI PROPORTIONAL
                     EMPLOYEES                                             ASSET BASE(3)                                        ASSET BASE(3)                                        ASSET BASE(3)

(1) As at 9 October 2019. Balance sheet and other information as at 30 June 2019 (2) Spark Infrastructure has interests in $17bn of total electricity network assets (3) Pro forma
Spark Infrastructure I Investor Presentation I 2019                                                                                                                                                              2
DELIVERING FUTURE ENERGY

HY2019 – FINANCIAL HIGHLIGHTS
                           Adjusted standalone                                                                    HY2019                                        Regulated               Contracted
                           operating cash flow(1)                                                                 Distribution                                  asset base(3)           asset base(4)

           $144m                                                                                  7.50cps
                                                                                                  Down 6.3%
                                                                                                                                                 $6.1bn                           $509m
                                                                                                                                                 Up 3.0%                          Up 27.3%

             Up                                                                                                   FY2019                                                                Net debt/

             10.8%                                                                                                Distribution
                                                                                                                  guidance
                                                                                                                                                                Efficiency
                                                                                                                                                                benchmarking(2)
                                                                                                                                                                                        Regulated
                                                                                                                                                                                        & Contracted
                                                                                                                                                                                        asset base(3)
                                                                                                 15.0cps                                           No. 1                          74.3%
                                                                                                     at least

   (1) Includes repayment of shareholder loans and adjusted to exclude one-off acquisition costs and prior year tax paid in HY2019
   (2) AER Annual Benchmarking Report 2018; CitiPower No.1 on total productivity; Powercor No.1 on opex productivity; and SA Power Networks No.1 on a state-by-state comparison
   (3) On an aggregated proportional basis to Spark Infrastructure
   (4) On 100% TransGrid basis

                          Distribution Reinvestment Plan (DRP) reactivated for HY2019 – at 2% discount, 28.4% take-up raising $35.8m

Spark Infrastructure I Investor Presentation I 2019                                                                                                                                                     3
DELIVERING FUTURE ENERGY

OUR STRATEGIC VISION AND PRIORITIES
Delivering essential services infrastructure

     OBJECTIVE                                                                                                     BUSINESS MODEL

     Delivering long-term value through capital                                                                    Value Enhance
                                                                                                                   Managing our portfolio for performance
     growth and distributions to Securityholders                                                                   and organic growth through efficient

     from our portfolio of high-quality, long-life                                                                 investment

     essential services infrastructure businesses
                                                                                                                   Value Build
     By building sustainable businesses and harnessing their evolving                                              Developing adjacent business
     growth potential we will continue to create long-term value for                                               platforms
     Securityholders

                                                                                                                   Value Acquire
                                                                                                                   Growing through disciplined
     ELECTRICITY              RENEWABLE               ELECTRICITY   GAS NETWORKS /   WATER NETWORKS /   DATA       acquisitions
     NETWORKS                 ENERGY                  STORAGE       GAS STORAGE      WATER STORAGE      NETWORKS

Spark Infrastructure I Investor Presentation I 2019                                                                                                         4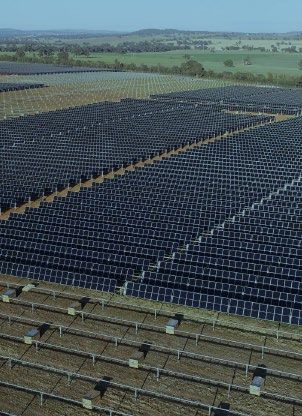
DELIVERING FUTURE ENERGY

DELIVERING FUTURE ENERGY
Spark Infrastructure remains focused on maintaining our sector leading efficiency delivering reliable and affordable electricity to
consumers and on leading the transition to renewable and distributed energy

 1          Our networks are leaders
            in efficiency, reliability
                                                           • Most efficient network assets with high levels of utilisation
                                                           • Strong track record of outperformance post privatisation
            and safety                                     • Well placed to benefit from industry structural change to new energy future

 2          Strong performance
            metrics and balance sheet
                                                           • Delivered 12.8% underlying standalone operating cash flow growth in HY2019
                                                           • Adjusted earnings (EBTDA) growth of 2.7% to balance standalone operating cash flow growth
                                                           • Investment grade credit ratings

 3          Cash yield
            of 7.1%(1)
                                                           • 7.5cps interim distribution paid for FY2019
                                                           • Forecast DPS of at least 15.0cps in FY2019
                                                           • Franking credits are expected to be distributed to Securityholders in the future, to the extent possible

 4          Supportive
            characteristics
                                                           • High cash flow visibility to 2020
                                                           • Regulatory stability to 2020 (SA Power Networks, Victoria Power Networks) and 2023 (TransGrid)
                                                           • Inflation-linked regulatory regime; increases in interest rates reflected in higher regulated revenues

 5          Growth opportunities
            in the new energy future
                                                           • Technology, customer preferences and generation mix are transforming the role of networks
                                                           • Distributed renewable generation, reliability requirements and efficient wholesale energy market
                                                             operation reinforce role of the grid
                                                           • Large-scale transmission interconnection options rapidly progressing; substantial government support

 6          First step into renewable
            energy – Bomen Solar
                                                           • Logical and prudent investment aligned with Spark Infrastructure’s investment strategy
                                                           • High-quality project located in Wagga Wagga NSW in strong grid location
            Farm                                           • Highly contracted revenue stream with long-term agreements with high-quality counterparties

(1) Based on 9 October 2019 closing price of $2.12 and FY2019 distribution guidance of at least 15.0cps

Spark Infrastructure I Investor Presentation I 2019                                                                                                                     5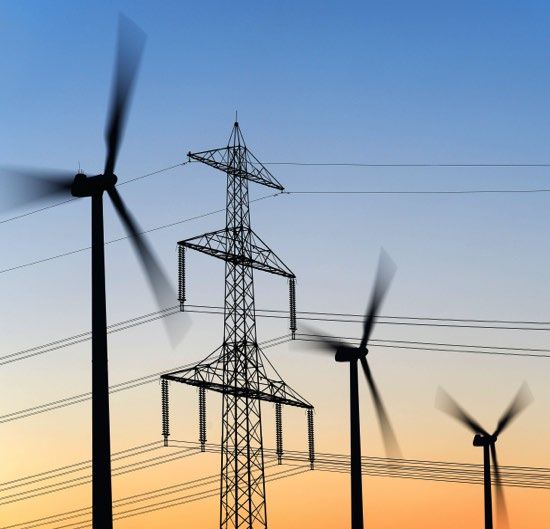
DELIVERING FUTURE ENERGY

INCENTIVE-BASE REGULATORY FRAMEWORK
Well established regulatory process with resets every 5 years, based on CPI-X price formula
Revenue building blocks
             REGULATED                                REGULATED REVENUE   Regulator        • Australian Energy Regulatory (AER)
             ASSET BASE                                  ALLOWANCE
                (RAB)                                     (PRICE CAP)
                                                                                             enforcing National Electricity Rules (NER)
                    x                                                     Regulated        • Determined using building block approach to recover efficient
                                                                          revenue            costs
 WEIGHTED AVERAGE COST OF
      CAPITAL (WACC)                                                                       • WACC based on 60:40 debt equity
                                                                                           • Debt – 10-year trailing average for ‘benchmark entity’
                   +
                                                            =
                                                                                           • Parameters based on ‘benchmark entity’ – BBB+ rating
           DEPRECIATION
                                                                                           • Rate of return guidelines – binding legislation
                   +                                                      RAB              • Opening RAB locked in under the NER
    OPERATING EXPENDITURE                                                                  • Increased by CPI and efficient capital invested less regulatory
                                                                                             depreciation
                   +                                                      Outperformance   •   Service level incentives
                   TAX                                                    opportunities    •   Opex and capex efficiency benefits
                                                                                           •   Tax
                                                                                           •   Capital structure and debt
                                                                                           •   Demand management and innovation

  Regulatory framework provides revenue certainty, inflation-linked revenue and gives efficient businesses incentive and opportunity to
  outperform

Spark Infrastructure I Investor Presentation I 2019                                                                                                            6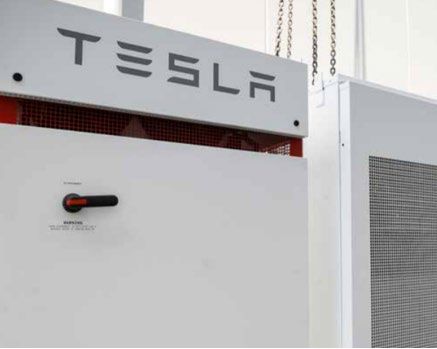
DELIVERING FUTURE ENERGY

MAINTAINING LEADERSHIP IN SECTOR EFFICIENCY
Our investment businesses lead their peers in efficiency

  Asset                                                    CitiPower                                 Powercor                                  SA Power Networks                          TransGrid
  Company                                                  (Distribution)                            (Distribution)                            (Distribution)                             (Transmission)

  AER Total
  Productivity(1)                                                                                    No. 4                                                                                No. 3

  AER OPEX
  Productivity(1)                                                                                                                              No. 3

  AER State-Based
  Productivity(1)                                          N/A                                       N/A                                                                                  N/A

  AER 2017 Productivity
  Change(1)                                                +3%                                       +3%                                       -6%(2)                                     +12%

  TransGrid achieved the highest productivity improvement of the five transmission companies, increasing performance by 12%
  relative to the prior year
(1) Source: AER Annual Benchmarking Report 2018
(2) SA Power Networks experienced rare and extreme weather conditions in 2016/2017 which led to increased cost required to respond to faults and to rectify supply. This had a significant downward impact on its productivity
    score, which is expected to rebound in the next productivity benchmarking report
Spark Infrastructure I Investor Presentation I 2019                                                                                                                                                                              7
DELIVERING FUTURE ENERGY

ENERGY NETWORKS ARE INSTRUMENTAL
Our networks are increasingly delivering more value-add services to the grid as energy generation, technology and customer
preferences evolve
                                                                Dozens of new                                      A critical role for
                                                                                                   2 million+                                      … And an increased role
                                                             renewable plants built
                                                             each year in the NEM
                                                                                                households with    transmission networks…          for distribution networks
                                                                                                solar rooftop PV
                                                                                                  in Australia
                                                                                                                   • TransGrid connecting          • SA Power Networks and
                                                                                                                     large-scale generation,         VPN investing to manage
                                                                                                                     storage and firming             hundreds of thousands of
                                                                                                                     services more                   distributed energy
                                                       Economics of                                                  frequently                      resources
                                                      interconnection
                                                         improving                                                 • TransGrid investigating       • SA Power Networks and
                                     NSW
                                                                                                                     increased investment in         VPN investing in smart
                                                                                                                     interconnections to             grid technology to
                                                                                                                     reduce system costs and         manage reverse
                                                                                                                     ensure network security         energy flows

                                                                                                                   • TransGrid investing in grid   • Beon and Enerven
                                                VIC/SA
                                                                                                                     strengthening projects to       providing more
                                                                                           Multiple new              integrate more load and         contestable services for
                                                                                      technologies available         renewables                      renewables
                                                                                         for customers to
                                                                                       manage their energy

Spark Infrastructure I Investor Presentation I 2019                                                                                                                             8
DELIVERING FUTURE ENERGY

OUR ASSETS ARE AT THE FOREFRONT OF CHANGE
Our investment businesses are performing well in contestable markets

   TransGrid new generation                           SA Power Networks VPP        Enerven solar and storage        Beon renewable
         connections                                        with Tesla                   for SA Water                construction

     1.8GW of solar and wind                          1,000 homes – current plan     Significant solar PV and   112MW Karadoc solar farm
  connections under construction                      50,000 homes – future plan     battery storage project        completed in 2018

       Connecting significant                            Learning from the             ~$300m framework           Growing expertise in
       volume of large-scale                           largest Virtual Power          agreement to deliver      solar farm and renewable
       renewables to the grid                         Plant in the world upon           solar and storage          energy connection
            each year                                        completion                across many sites               construction
Spark Infrastructure I Investor Presentation I 2019                                                                                        9
DELIVERING FUTURE ENERGY
BOMEN SOLAR FARM
ON TIME AND ON BUDGET
Construction Update • Construction activities progressing • Announced 17 April 2019
as per schedule. Piling, mechanical, • High quality asset in a strong
trenching and panel installation are grid location
all now well underway • Highly contracted revenue
• Most materials now delivered to site including Power Purchase
(including piers, cables and tracking Agreements with Westpac and
system) Flow Power
• Significant ramp up in work force for • Total cost at completion
mechanical installation ~$188m(1)
• Commercial operations forecast for • When operating, Bomen is
Q2 2020 expected to generate average
annual revenue of ~$13.5m
for the first five years(2)
Financing Update • Funding requirements at financial
close and construction costs to date
have been met from existing cash
• First drawdown of debt occurred in
September 2019 NSWBomen
• DRP raised $35.8m in September Solar Farm
2019 WAGGA
WAGGA
(1) Includes purchase of land, construction costs, construction of dedicated transmission line and capitalised interest during construction
(2) Average annual revenue considering PPA agreements, loss factors and plant output on P50 forecast
Spark Infrastructure I Investor Presentation I 2019 10DELIVERING FUTURE ENERGY
COAL CLOSURES REQUIRE NEW INVESTMENT
NEM coal capacity forecast to decrease by 20% from FY19 to FY30 and by 60% from FY19 to FY40 as Australia’s coal-fired generating
fleet ages and capacity is removed
Generation capacity (GW) 30 Swanbank B
Collinsville Munmorah B
Wallerawang
Playford
Northern
25
Hazelwood
Liddell
Vales Point
20
Gladstone
Yallourn
15 Eraring
Bayswater
Tarong
10 Callide B
Mount Piper
Stanwell
Loy Yang B
5 Loy
Yang A
0
2010
2011
2012
2013
2014
2015
2016
2017
2018
2019
2020
2021
2022
2023
2024
2025
2026
2027
2028
2029
2030
2031
2032
2033
2034
2035
2036
2037
2038
2039
2040
2041
2042
2043
2044
2045
2046
2047
2048
2049
2050
Remaining coal NSW VIC SA QLD
NEW GENERATION REQUIRES NETWORK CONNECTION, AUGMENTATION AND INTERCONNECTION
(1) Source: Australian Energy Council, 2017. AEMO 2018 Integrated System Plan, July 2018. TransGrid 2017 Transmission Annual Planning Report, June 2017
Spark Infrastructure I Investor Presentation I 2019 11DELIVERING FUTURE ENERGY
GROWTH OPPORTUNITIES FROM THE ISP
The outlook for the ISP and the NSW Transmission Strategy is positive and is additional to TransGrid’s 2018-2023 capex allowance in
its revenue determination
AEMO ISP NSW Transmission
Capex source Neutral(1) Strategy(1)
Estimated Delivery Delivery
cost target target
TransGrid 2018-2023 capex allowance $1,249m N/A N/A
New SA-NSW interconnector (Project EnergyConnect) $1,530m(2) 2022 to 2025 2023
VIC-NSW interconnector upgrade $87m(2) 2020 2022
Minor QLD-NSW interconnector upgrade $142m(2) 2020 2022
Snowylink North (Humelink) $1,350m(2) 2025 2024
Medium QLD-NSW interconnector upgrade $560m(2) 2023 N/A
Total possible ISP spend by mid-2020s $3,669m N/A N/A
TransGrid 2018-2023 other contingent projects(3) $797m to $2,091m N/A N/A
The ISP and the NSW transmission strategy represent significant investment opportunities to deliver cost savings for consumers
(1) Source: AEMO 2018 Integrated System Plan (AEMO 2018 ISP); NSW Transmission Infrastructure Strategy, November 2018 (2) Estimated cost sourced from AEMO 2018 ISP, ElectraNet SAET Project Assessment Conclusions
Report (PACR) February 2019, AEMO/TransGrid VNI Specification Consultation Report (PSCR) November 2018, TransGrid/Powerlink QNI PSCR November 2018, TransGrid Southern Shared Network PSCR June 2019 and
represents total cost for each project, some of which may be funded by other TNSPs (3) Source: AER’s final decision for TransGrid 2018-2023 Determination, Attachment 6 – Capital Expenditure; Projects include Support South
Western NSW for Renewables, Supply to Broken Hill, Support Central Western NSW for Renewables, Support North Western NSW for Renewables, and Renewables development in Mt Piper to Wellington area
Spark Infrastructure I Investor Presentation I 2019 12DELIVERING FUTURE ENERGY
PROJECT ENERGYCONNECT
Enabling the transition of Australia's energy network to a greater mix of renewables
Project EnergyConnect is a proposed new electricity interconnector between Robertstown in South Australia
and Wagga Wagga in New South Wales, with a connection into Red Cliffs in Victoria
• Completed a Regulatory Investment Test for Transmission (RIT-T)
• The test is a cost benefit analysis overseen by the AER
• Decision expected in H2 2019 as to whether the project satisfies this test
The interconnectors route passes though renewable energy zones in South Australia and NSW, meaning
future renewable projects in these areas will be able to connect to the grid and supply new energy into the
network
If approved, Project EnergyConnect would deliver a range of direct benefits for consumers:
Lower Prices
• Typical residential electricity bills estimated to reduce by $66 p.a. in South Australia and $30 p.a. in NSW
annually
• Typical small business electricity bills to reduce by $132 p.a. in South Australia and $71 p.a. in NSW
annually
Energy Security
• Enabling a greater mix of renewable energy generators to connect into the network
• Increasing reliability and confidence in electricity supply
Source: https://www.projectenergyconnect.com.au/
Spark Infrastructure I Investor Presentation I 2019 13DELIVERING FUTURE ENERGY
DISTRIBUTION NETWORKS
Current focus is on transmission, but important re-engineering and re-design will also be required in the distribution networks
“In the not too distant future, it is easy to envisage an
Australian energy system with millions of homes and
businesses with rooftop solar, a battery system, a
charging station for an electric vehicle and a
household energy management system. Australians
would have a more affordable and better optimised Electrifying
electricity system that delivers increasingly transport
Customer Value
customised services”
Open Energy Networks, ENA and AEMO, July 2019
Enhancing Enhancing
grid stability grid stability
Enabling Enabling Enabling
distributed distributed distributed
generation generation generation
Supplying Supplying Supplying Supplying
energy energy energy energy
Pre 2010 2010-2018 2018-2025 Post 2025
Source: Adapted from SA Power Networks 2020-25 Regulatory Proposal – An overview for South Australian electricity customers, sourced from SA Power Networks' Talking Power website
Spark Infrastructure I Investor Presentation I 2019 14DELIVERING FUTURE ENERGY
PRICE REVIEW TIMELINES
TransGrid
SA POWER
NETWORKS
Proposal Draft Revised Final Period
Framework and
due January Decision proposal due Decision commences
Approach
2022 September December April 2023 1 July 2023
process October
2020 2022 2022
Proposal Draft Revised Final Period
submitted Decision proposal Decision commences
31 January October December April 2020 1 July 2020
2019 2019 2019
Proposal due Draft Decision Revised Transition Final Period
31 January October 2020 proposal period(1) Decision commences
2020 Dec 2020 1 Jan 2021 April 2021 1 July 2021
VICTORIA POWER NETWORKS
(1) The mechanics in relation to the transition period are currently being debated
TRANSGRID IS NOT SUBJECT TO THE 2018 RATE OF RETURN GUIDELINE
Spark Infrastructure I Investor Presentation I 2019 15DELIVERING FUTURE ENERGY
OUTLOOK AND DISTRIBUTIONS
2019 DPS • The Directors reconfirm distribution guidance for FY2019 of at least 15.0cps, subject to business conditions
Guidance
• Spark Infrastructure expects future cash flows will align more closely with the five-year regulatory periods of its major
investments, primarily SA Power Networks and Victoria Power Networks
• Distributions to Securityholders will be funded from standalone operating cash flows after tax payments
• We expect to be able to distribute franking credits to Securityholders, to the extent possible
Outlook
• During FY2019 Spark Infrastructure commenced the payment of tax, with $16.9m being paid in relation to FY2018
• Ultimately the timing and amount of tax payable will depend on the outcome of tax disputes with the ATO (currently
under appeal), underlying financial performance of the investment businesses and tax timing differences
• Impact of the new RORG and lower inflation will negatively impact regulatory returns for the upcoming five-year
regulatory periods for SA Power Networks and Victoria Power Networks
• Taking into account these regulatory and macro-economic headwinds and notwithstanding the best efforts of our
Investment Businesses to mitigate these impacts, the Directors expect distributions to Securityholders will need to reset
to a lower base for the next five-year regulatory periods
Spark Infrastructure I Investor Presentation I 2019 16DELIVERING FUTURE ENERGY APPENDIX Spark Infrastructure I Investor Presentation I 2019 17
DELIVERING FUTURE ENERGY

SPARK INFRASTRUCTURE GROUP DIAGRAM
Simplified corporate structure

                                                                                           SECURITYHOLDERS

                                                                                Trust distributions               Loan note interest payments

                                                                                SPARK INFRASTRUCTURE TRUST

                                                 Dividends/interest/                     Dividends/interest/
                                                                                                                                Trust distributions          Dividends
                                                  loan repayments                         loan repayments

                                                     SPARK                                   SPARK                                 SPARK
                                                                                                                                                             SPARK
                                                INFRASTRUCTURE                          INFRASTRUCTURE                        INFRASTRUCTURE
                                                                                                                                                        INFRASTRUCTURE
                                                   HOLDINGS 1                              HOLDINGS 2                        ELECTRICITY ASSETS
                                                                                                                                                           HOLDINGS 3
                                                                                                                                   TRUST

                                                                    SPARK                    SPARK
                              BOMEN SOLAR FARM                 INFRASTRUCTURE           INFRASTRUCTURE
                                                                   VICTORIA             SOUTH AUSTRALIA

                                                                                            SPARK SA                                                  SPARK INFRASTRUCTURE
                                 TAX                                                                                                                       ELECTRICITY          Interest payments
                                                                                            PARTNERS
                             CONSOLIDATED                                                                                                               OPERATIONS TRUST
                                GROUP

                                                 Dividends/interest/
                                                                                      Partnership distributions                 Trust distributions       Trust distributions
                                                  loan repayments

                                                 VICTORIA POWER                             SA POWER                              TRANSGRID                TRANSGRID
                                                    NETWORKS                                NETWORKS                             ASSET GROUP            OPERATING GROUP

Spark Infrastructure I Investor Presentation I 2019                                                                                                                                            18
DELIVERING FUTURE ENERGY
STANDALONE OPERATING CASH FLOW
Adjusted
Operating Cash Flow ($m)
HY 2019 HY 2019 HY 2018
Investment Portfolio Distributions
Victoria Power Networks(1) 75.9 75.9 74.7
SA Power Networks 55.2 55.2 54.7
TransGrid 21.5 21.5 8.6
Total Investment Portfolio Distributions 152.6 152.6 138.0
Net interest received 0.9 0.9 0.4
Corporate expenses (8.3) (8.3) (8.1)
Operating costs – Bomen related (0.8) (0.8) -
Transaction bid costs – Bomen related - (2.6) -
Tax paid(2) - (13.8) -
Standalone OCF 144.4 128.0 130.3
Standalone OCF per Security 8.6 cps 7.6 cps 7.7 cps
Spark Infrastructure Distribution per Security 7.5 cps 7.5 cps 8.0 cps
Pay-out ratio 87.4% 98.5% 103.3%
Cumulative pay-out ratio for the first three and a half years of the current regulatory period (2016 – HY2019) is 90%
(1) Victoria Power Networks distributions include both interest on and repayment of shareholder loans. Repayments of loan principal are classified as investing activities for statutory reporting purposes
(2) Tax paid in relation to 2018 income tax year. The total tax payable in relation to 2018 is $16.9m, with the remaining balance of $3.1m being paid in July 2019
Spark Infrastructure I Investor Presentation I 2019 19DELIVERING FUTURE ENERGY
LOOK-THROUGH OPERATING CASH FLOW
Look-through operating cash flow on a proportional ownership basis
HY 2019 HY 2018
( 89.2 )
( 135.0 )
421.0
( 23.6 )
(24.5)
173.2
148.7 126.2 134.8 134.6
EBITDA less: Net less: Net Non cash/net Investment portfolio Other SKI look-through SKI distributions to SKI look-through SKI distributions to
finance regulatory working capital operating cash flow net costs operating Securityholders operating Securityholders
charges (cash) depreciation movements cash flow cash flow
Distributions are fully covered by look-through operating cash flow by 1.2X
(1) EBITDA excludes customer contributions and gifted assets and includes ‘true-up’ of DUOS/TUOS to revenue cap
(2) Net regulatory depreciation is calculated based on actual inflation. Applying the regulatory assumed inflation rates reduces net regulatory depreciation to $118.7m
(3) HY2019 pay-out ratio: 85% (HY2018 pay-out: 100%); 3.5 year pay-out ratio (2016 - HY2019): 74%
Spark Infrastructure I Investor Presentation I 2019 20DELIVERING FUTURE ENERGY
ADJUSTED PROPORTIONAL PERFORMANCE
Adjusted Proportional Results
HY 2019 HY 2018 Change Proportional
(Spark Infrastructure share) ($m)(1)
HY2018 EBITDA $418.3m
Distribution and transmission revenue 491.7 481.2 2.2%
Other revenue 85.4 82.3 3.8% Change in VPN EBITDA
(1) ($1.8m)
2.4% Change in SAPN EBITDA $6.2m
(1)
Total Revenue 577.1 563.5
Operating costs (158.2) (151.9) 4.1% Change in TransGrid EBITDA $3.7m
Beon margin 2.9 2.3 26.1% Proportional
Enerven margin 4.6 4.4 4.5% HY2019 EBITDA $426.4m
EBITDA 426.4 418.3 1.9%
Net external finance costs (90.9) (91.5) -0.7%
EBTDA 335.5 326.8 2.7%
(1) Normalising non-cash adjustments:
VPN: HY 2019: excludes $4.6m negative revaluation adjustment to employee entitlements provisions and $0.3m loss in a credit valuation hedge accounting adjustment
- HY 2018: excludes $0.9m positive revaluation adjustment to employee entitlements provisions and $4.0m gain in a credit valuation hedge accounting adjustment
SAPN: HY 2019: excludes $0.9m negative revaluation adjustment to employee entitlements provisions and $1.0m loss in a credit valuation hedge accounting adjustment
- HY 2018: excludes $1.1m positive revaluation adjustment to employee entitlements provisions and $4.6m gain in a credit valuation hedge accounting adjustment. HY 2018 also excludes release of excess December
2016 storm provisions ultimately not required $3.0m
Spark Infrastructure adjusted aggregated proportional EBITDA has increased by 1.9%
Spark Infrastructure I Investor Presentation I 2019 21DELIVERING FUTURE ENERGY
VICTORIA POWER NETWORKS
Financial ($m)(1) HY 2019 HY 2018 Change CPI-X(6) $5.2m
Regulated revenue - DUOS 474.8 473.0
Prescribed metering ("AMI") 42.5 40.2
STPIS(2) $7.5m DOWN
$1.5M ON
HY2018
Semi-regulated revenue 29.1 27.1
Unregulated revenue 27.3 26.4
Customer
Growth(3) 1.5%
Total Revenue 573.7 566.7 1.2%
Operating costs(4) (166.1) (143.0)
Consumption
(3) 1.2%
Beon margin 6.0 4.6
EBITDA 413.6 428.3
FTE
-3.4% Change(3) 0.4%
Other
Net finance costs (5)
(84.4) (72.0)
Net Debt /
RAB 71.5%
15.0%
Net capital expenditure 221.0 211.1 FFO /
Distributions received by SKI 75.9 74.7 1.6% Net Debt
On an Adjusted EBITDA basis the HY2019 result reduced by $3.6m or 0.8%
(1) 100% basis (2) 2017 STPIS result recovered in HY2019, further 2017 related STPIS delayed until FY2020 (3) Compared with FY2018 (4) HY2019 includes $9.3m negative (non-cash) revaluation adjustments to employee
entitlements provisions (HY2018: includes $1.8m gain) (5) HY2019 includes a $0.6m (loss) in non-cash credit valuation hedge adjustments (HY2018: includes $8.1m gain) (6) The CPI-X adjustment for 2019 is expected to
be a $38.2m increase on 2018, suggesting a $19.1m increase HY on HY. However due to seasonality in the prescribed Maximum Allowed Revenue (MAR), the impact is less pronounced in the H1 2019. An increase of
$5.2m (reflecting the CPI-X increase adjusted for seasonality) is reflected in HY2019 DUoS revenue
Spark Infrastructure I Investor Presentation I 2019 22DELIVERING FUTURE ENERGY
VICTORIA POWER NETWORKS
KEY FINANCIAL DRIVERS
Regulated Revenue • From 1 January 2019 CPI of 2.08%
Up by 0.4% • X-factors for Powercor: -3.02% and CitiPower: -0.12% representing a real increase in revenue before CPI
• $7.5m STPIS recovery included within distribution revenue, down $1.5m
Regulated Asset Base • RAB increased to $6,188m
Up by 3.1% • Increase driven by net capex of $465m(1), less regulatory depreciation of $386m, and CPI uplift of $117m
Other Revenue • Semi-regulated revenue: up 7.4% – increased connection design services
Up by 5.5% • Unregulated revenue: up 3.4% – additional service level agreement projects and proceeds from sale of
properties
• AMI revenue: up 5.7%
Operating Costs (ex Beon) • Non-cash revaluation adjustments to employee entitlements of $9.3m due to bond rate movements
Up by 16.2% • Higher vegetation management costs of $19.0m. A greater number of spans are being cut and HY2019 cutting
program is significantly ahead of HY2018
Net Capital Expenditure • Growth capex of $147.8m up 4.1% (network connections and augmentation) – continuation of Rapid Earth Fault
Up by 4.7% Current Limiter program
• Maintenance capex of $73.1m up 5.8% – zone substation replacement projects
Victoria Power networks RAB has increased 3.1% over the last 12 months
(1) Excludes corporate overheads
Spark Infrastructure I Investor Presentation I 2019 23DELIVERING FUTURE ENERGY
SA POWER NETWORKS
Financial ($m)(1) HY 2019 HY 2018 Change CPI-X $10.1m
Regulated revenue – DUOS 412.6 398.1
Semi-regulated revenue 46.7 41.4
STPIS(4) $11.4m DOWN
$2.4M ON
HY2018
Unregulated revenue 5.5 5.4
Total Revenue 464.8 444.9
Customer
4.5% Growth(5) 2.0%
Operating costs(2)
-1.0%
(136.3) (118.6) Consumption
(5)
Enerven margin 9.3 8.9
EBITDA
Other
337.8 335.2 0.8% FTE
Change(5) -0.7%
Net finance costs(3) (69.6) (54.5) Net Debt /
RAB 75.2%
Net capital expenditure 222.9 207.8
Distributions received by SKI 55.2 54.7 0.9%
FFO /
Net Debt 16.7%
On an Adjusted EBITDA basis the HY2019 result increased by $12.9m or 3.9%
(1) 100% basis (2) HY2019 includes $1.8m negative revaluation adjustments to employee entitlements provisions (HY2018: includes $2.3m gain and release of excess December 2016 storm provisions of $6.1m ultimately not
required.) (3) HY2019 includes a $2.1m (loss) credit valuation hedge adjustment (HY2018: includes $9.3m gain) (4) 2016/17 STPIS result recovered from 1 July 2018 (5) Compared with FY2018
Spark Infrastructure I Investor Presentation I 2019 24DELIVERING FUTURE ENERGY
SA POWER NETWORKS
KEY FINANCIAL DRIVERS
Regulated Revenue • CPI of 1.91% from 1 July 2018 (1 July 2017: CPI 1.48%)
Up by 3.6% • X-factor applicable from 1 July 2018 was -0.74% representing a real increase in revenue before CPI
• $11.4m STPIS recovery, down $2.4m
Regulated Asset Base(3) • RAB increased to $4,315m
Up by 3.8% • Increase driven by net capex of $385m(1), less regulatory depreciation of $314m, and includes CPI uplift of $78m
Other Revenue • Semi-regulated revenue: up 12.8% - higher public lighting works and increased asset relocation activity, partially
Up by 11.5% offset by a decrease in council funded LED upgrades
Underlying Operating • Increased actuarial adjustments to employee entitlements due to bond rate movements
Costs (Ex Enerven) • Higher vegetation management costs, emergency response and negotiated services; partially offset by higher
Up by 9.2%(2) capitalisation of labour costs due to increased number of capital projects
Net Capital Expenditure • Growth capex of $77.6m up 1.8% - network connections and augmentation
Up by 7.3% • Maintenance capex of $145.3m up 10.4%
SA Power Networks has seen RAB growth of 3.8% over the 12 months
(1) Excludes corporate overheads (2) Excluding $6.2m release of GSL provisions in HY2018 relating to storms in December 2016, ultimately not required. (3) Includes public lighting RAB
Spark Infrastructure I Investor Presentation I 2019 25DELIVERING FUTURE ENERGY
TRANSGRID
Financial ($m) (1) HY 2019 HY 2018 Change MAR $16.3m
Regulated revenue 379.0 362.4
Unregulated revenue 74.4 81.7
STPIS(3) $7.8m UP
$0.1M ON
HY2018
Other Revenue 1.2 8.2
Total Revenue 454.6 452.3
RAB(4)
0.5% Growth 1.1%
Regulated operating costs (78.4) (75.9)
Unregulated operating and other costs (24.2) (48.9)
CAB(4)(5)
Growth 27.3%
EBITDA 352.0 327.5 7.5%
Other
FTE
Change(6) 3.8%
Net finance costs(2) (111.3) (139.6)
Regulated capital expenditure 124.3 101.4
Net Debt /
RCAB(5)(7) 80.6%
Unregulated capital expenditure 106.1 44.4
Distributions received by SKI 21.5 8.6
FFO /
150.0% Net Debt(8) 8.3%
HY2019 increase in EBITDA of $24.5m or 7.5%
(1) 100% basis (2) HY2018 includes accelerated amortisation of $27m capitalised debt transaction costs resulting from the debt refinancing transaction in June 2018 (3) 2017 STPIS result recovered from 1 July 2018
(4) Compared with June 2018 (5) CAB comprises of unregulated infrastructure and telecommunication assets and investment property (6) Compared with December 2018 (7) Net Debt is calculated using gross debt less cash
and adjusted for prescribed revenue over/(under) collection (8) Relates to Obligor Group
Spark Infrastructure I Investor Presentation I 2019 26DELIVERING FUTURE ENERGY
TRANSGRID
KEY FINANCIAL DRIVERS – REGULATED BUSINESS
Regulated Revenue • The AER’s determination set the MAR for 2018/19 so no CPI-X calculation is applied. The MAR for 2018/19 was
Up by 4.6% $734.3m or 5% higher in nominal terms than the actual MAR for 2017/18(1)
• $7.8m STPIS recovery, up $0.1m
Regulated Asset Base • RAB increased to $6,440m
Up by 1.1% • Increase driven by capital expenditure of $209m, less regulatory depreciation of $256m, and includes CPI uplift
of $114m
Operating Costs • Assessed by the AER to be an efficient operator
Up 3.3% • Savings in procurement and maintenance initiatives were offset by restructuring costs and annual wage
increment
Capital Expenditure • Growth capex of $17.6m (up 488.9%)
Up by 22.6% • Maintenance capex of $80.7m (up 5.5%)
• Non-network(2) capex of $22.4m (up 5.2%)
• Increase was mainly due to augmentation capex including Powering Sydney’s Future and Stockdill Switching
Station projects, and maintenance capex
TransGrid has seen RAB growth of 1.1% over the 12 months
(1) Based on the AER’s advice on the X-factor applicable to the MAR calculation for 2017/18 transmission pricing (2) Includes Network Capability Incentive Project Action Plan (NCIPAP) capex
Spark Infrastructure I Investor Presentation I 2019 27DELIVERING FUTURE ENERGY
TRANSGRID
KEY FINANCIAL DRIVERS – UNREGULATED BUSINESS
Unregulated Capital • Infrastructure capex up significantly due to an increase in the number of renewable connections projects
Expenditure delivered in HY2019 (Limondale, Sunraysia, Kiamal and Finley)
Up by $61.7m
Unregulated Revenue • Reduction in major line relocation work due to completion of service-style contracts for Peabody and Centennial
Down by $7.3m coal mines
• Revenue from completed connections projects, partially offset the reduction in line modifications
Operating Costs • Decreased project costs are mainly due to lower line modifications activity
Down by $24.7m
Contracted Asset Base • Increased to $509m
Up by $108.2m • Increase driven by net capex of $140m and gain on investment property of $6m, less depreciation of $37m
TransGrid Services – new • TransGrid Services established in June 2018 to facilitate the efficient funding of unregulated new connections
structure investment
• $18m (Spark share: $2.7m) of equity invested in TransGrid Services in HY2019 to fund unregulated growth
TransGrid has seen CAB growth of 27.3% over the 12 months
Spark Infrastructure I Investor Presentation I 2019 28DELIVERING FUTURE ENERGY
INVESTMENT GRADE FUNDING
Victoria
SA Power
Issuer Power TransGrid
Networks
Networks
n/a / Baa2(2)
Credit Rating (S&P / Moody’s) A- / n/a A- / n/a
(on USPP notes)
Weighted Average Maturity(1) 5.0 yrs 5.1 yrs 5.6 yrs
(31 December 2018) (5.5 yrs) (5.6 yrs) (6.1 yrs)
Net Debt at 30 June 2019 $4.427bn $3.245bn $5.601bn(3)
(31 December 2018) ($4.369bn) ($3.155bn) ($5.509bn)
Net Debt / RAB at 30 June 2019 71.5% 75.2% 87.0%(3)
(31 December 2018) (71.5%) (74.3%) (86.2%)
Net Debt / RAB + CAB at 30 June 2019 80.6%(3)
N/A N/A
(31 December 2018) (80.7%)
FFO / Net Debt at 30 June 2019 15.0% 16.7% 8.3%(2)
(31 December 2018) (15.3%) (16.6%) (8.2%)
Gross Debt at 30 June 2019 $4.506bn $3.252bn $5.695bn
(31 December 2018) ($4.426bn) ($3.185bn) ($5.634bn)
Spark Infrastructure is rated Baa1 with a stable outlook by Moody’s
(1) Weighted average maturity calculation is based on drawn debt at 30 June 2019
(2) Relates to the Obligor Group
(3) Net Debt is calculated using gross debt less cash and adjusted for prescribed revenue over/(under) collection
Spark Infrastructure I Investor Presentation I 2019 29DELIVERING FUTURE ENERGY
DISTRIBUTIONS, RAB, CREDIT METRICS AND GEARING
SECURITY METRICS SA POWER NETWORKS $m
Market price at 23 August 2019 $2.36 RAB(1) 4,315
Market capitalisation $3.97 billion Net debt 3,245
Net debt/RAB 75.2%
DISTRIBUTIONS
HY 2019 actual 7.50cps VICTORIA POWER NETWORKS $m
Comprising: RAB
(1)
(including AMI) 6,188
- Loan Note interest 3.50cps
Net debt 4,427
- Tax deferred amount 4.00cps
Net debt/RAB 71.5%
2019 Guidance 15.00cps
TRANSGRID $m
CREDIT RATINGS
RAB(1) 6,440
Investment portfolio credit ratings SA Power Networks: A-
Victoria Power Networks: A- CAB(1)(2) 509
(1)(2)
TransGrid: Baa2 RCAB 6,948
Spark Infrastructure level credit rating Baa1 Net debt(3) 5,601
(3)
Net debt/RAB 87.0%
SPARK INFRASTRUCTURE $m
Total RAB and CAB (Spark Infrastructure share) 6,190 Net debt/RCAB(3) 80.6%
Gross debt at Spark Infrastructure level Nil
(1) June 2019 estimate
(2) Includes WIP/partially completed assets and investment property
(3) Net Debt is calculated using gross debt less cash and adjusted for prescribed revenue over/(under) collection
Spark Infrastructure I Investor Presentation I 2019 30DELIVERING FUTURE ENERGY
REGULATED PRICE PATH
CPI minus X(1)
CPI (%) CPI (%)
Expected Expected
CitiPower Actual X-Factor movement Powercor Actual X-Factor movement
(3)
in revenue % in revenue(3) %
(Forecast) (Forecast)
(2)
Year 1 2.50 Year 1(2) 2.50
- - - -
(1 Jan 16) (2.50) (1 Jan 16) (2.50)
Year 2 1.02 Year 2 1.02
0.40 0.62 4.68 -3.71
(1 Jan 17) (2.35) (1 Jan 17) (2.35)
Year 3 1.93 Year 3 1.93
-0.05 1.99 -0.81 3.08
(1 Jan 18) (2.35) (1 Jan 18) (2.35)
Year 4 2.08 Year 4 2.08
-0.12 2.20 -3.02 5.16
(1 Jan 19) (2.35) (1 Jan 19) (2.35)
Year 5 Year 5
-2.95 5.37 -3.39 5.82
(1 Jan 20) (2.35) (1 Jan 20) (2.35)
• Regulated electricity network revenues are determined by a price path set according to the CPI-X(1) formula. A negative X-factor means
a real increase in distribution tariffs
• The regulatory pricing period commences on 1 January each year for Victoria Power Networks (CitiPower and Powercor) and 1 July
each year for SA Power Networks and TransGrid
• Whilst CPI-X is the key underlying driver for year on year revenue movements, the revenue movements in reported results include
adjustments for other factors
(1) Whilst referred to as “CPI-X”, the actual tariff increase formula used by the regulator is: (1+CPI)*(1-x)-1. Source: AER
(2) No CPI-X was applied in 2016. The AER calculated the revenue cap as a dollar amount
(3) Excludes over or under recovery and S factor revenue
Spark Infrastructure I Investor Presentation I 2019 31DELIVERING FUTURE ENERGY
REGULATED PRICE PATH
CPI minus X(1)
CPI (%) Expected CPI (%) Expected CPI (%) Expected
SA Power Actual movement Actual movement Actual movement
X-Factor TransGrid X-Factor TransGrid X-Factor
Networks in revenue(2) in revenue(2) in revenue
(2)
(Forecast) % (Forecast) % (Forecast) %
Year 1 1.72 Year 1 1.72 Year 1(4) n/a n/a
28.00 -26.80 11.61 -9.51 n/a
(1 Jul 15) (2.50) (1 Jul 14) (2.38) (1 Jul 18) (2.45) (-1.98)
Year 2 1.69 Year 2 1.70 Year 2 1.80 -0.97
-7.13 8.90 15.03 -13.59 2.79
(1 Jul 16) (2.50) (1 Jul 15) (2.38) (1 Jul 19) (2.45) (-1.98)
Year 3 1.48 Year 3 1.70 Year 3
-0.94 2.40 3.70 -2.06 -1.98 4.48
(1 Jul 17) (2.50) (1 Jul 16) (2.38) (1 Jul 20) (2.45)
Year 4 1.91 Year 4(3) 1.48 Year 4
-0.74 2.66 3.94 -2.50 -1.98 4.48
(1 Jul 18) (2.50) (1 Jul 17) (2.38) (1 Jul 21) (2.45)
Year 5 1.78 Year 4
-0.85 2.65 -1.98 4.48
(1 Jul 19) (2.50) (1 Jul 22) (2.45)
(1) Whilst referred to as CPI-X, the actual tariff increase formula used by the regulator is: (1+CPI)*(1-x)-1. Source: AER
(2) Excludes over or under recovery and S factor revenue
(3) Based on the AER’s advice on the X-factor applicable to the MAR calculation for 2017/18 transmission pricing.
(4) The AER’s determination set the MAR for 2018/19 so no CPI-X calculation is applied. The MAR for 2018/19 is $734.3m or 5% higher in nominal terms than the actual MAR for 2017/18
Spark Infrastructure I Investor Presentation I 2019 32DELIVERING FUTURE ENERGY
SA POWER NETWORKS 2020-25 DRAFT DETERMINATION
Regulatory 2015-20 2020-25 2020-25
Proposal has revenue stable in Real $June 2020 terms
proposal Actual/ Regulatory Draft
metric Forecast(1) Proposal(2) Determination(2)
Standard Control Services Revenue ($m, Real June 2020)(1)(2)
$1,728m $1,720m $1,247m
Capex(1)(2) 900
($ June 2020) ($2019-20) ($2019-20)
$1,324m $1,551m $1,473m
Opex(1)(2) 800
($ June 2020) ($2019-20) ($2019-20)
WACC 6.15%(3) 5.43%(1) 4.95%(2)
700
Gamma(1)(2) 0.4 0.585 0.585
600
FY16 FY17 FY18 FY19 FY20 FY21 FY22 FY23 FY24 FY25
$3,909m $4,215m $3,905m
Revenue(1)(2)
($ June 2020) ($nominal) ($nominal) 2015-20 actual/forecast 2020-25 proposal 2020-25 Draft
Revised Proposal to be submitted December 2019. Final Determination expected April 2020
(1) Source: SA Power Networks 2020-25 Regulatory Proposal – An overview for South Australian electricity customers, sourced from SA Power Network’s Talking Power website
(2) Source: SA Power Networks 2020-25 Determination – Draft Decision
(3) Average 2015-20 WACC based on SA Power Networks 2015-20 determination PTRM and asset company information
Spark Infrastructure I Investor Presentation I 2019 33DELIVERING FUTURE ENERGY
STPIS RESULTS (100% BASIS)
Victoria Power Networks $m
2016 regulatory year 18 Recovered in 2018 regulatory year
2017 regulatory year 36 To be recovered in 2019 and 2020 regulatory years
2018 regulatory year 20 To be recovered in 2020 and 2021 regulatory years
(1)
H1 2019 regulatory year 11 To be recovered in 2021 and 2022 regulatory years
SA Power Networks $m
2015/16 regulatory year 28 Recovered in 2017/18 regulatory year
2016/17 regulatory year 20 Recovered in 2018/19 regulatory year
2017/18 regulatory year 32 To be recovered in 2019/20 regulatory year
(1)
2018/19 regulatory year 30 To be recovered in 2020/21 regulatory year
TransGrid $m
2015 calendar year 12 Recovered in 2016/17 regulatory year
2016 calendar year 15 Recovered in 2017/18 regulatory year
2017 calendar year 16 Recovered in 2018/19 regulatory year
2018 calendar year 17 To be recovered in 2019/20 regulatory year
(1) Preliminary estimate
Spark Infrastructure I Investor Presentation I 2019 34DELIVERING FUTURE ENERGY DISCLAIMER AND SECURITIES WARNING Investment company financial reporting - Adjustments are made to distribution and transmission revenues to defer/accrue for amounts in excess of/under the regulated revenue cap to reflect that these amounts will be returned to/recovered from electricity consumers in future periods via adjustments to tariffs. The financial reporting is based on TransGrid’s special purpose financial statements for the year ended 30 June 2019 and half year ended 31 December 2018. Results have been adjusted by Spark Infrastructure to reflect the 6 month period to 30 June 2019. No offer or invitation. This presentation is not an offer or invitation for subscription or purchase of or a recommendation to purchase securities or any financial product. No financial product advice. This presentation contains general information only and does not take into account the investment objectives, financial situation or particular needs of individual investors. It is not financial product advice. Investors should obtain their own independent advice from a qualified financial advisor having regard to their objectives, financial situation and needs. Summary information. The information in this presentation does not purport to be complete. It should be read in conjunction with Spark Infrastructure’s other periodic and continuous disclosure announcements lodged with the Australian Securities Exchange (ASX), which are available at www.asx.com.au. U.S. ownership restrictions. This presentation does not constitute an offer to sell, or a solicitation of an offer to buy, securities in the United States or to any “U.S. person”. The Stapled Securities have not been registered under the U.S. Securities Act or the securities laws of any state of the United States. In addition, none of the Spark Infrastructure entities have been registered under the U.S. Investment Company Act of 1940, as amended, in reliance on the exemption provided by Section 3(c)(7) thereof. Accordingly, the Stapled Securities cannot be held at any time by, or for the account or benefit of, any U.S. person who is not both a QIB and a QP. Any U.S. person who is not both a QIB and a QP (or any investor who holds Stapled Securities for the account or benefit of any US person who is not both a QIB and a QP) is an "Excluded US Person" (A "U.S. person", a QIB or "Qualified Institutional Buyer" and a QP or "Qualified Purchaser" have the meanings given under US law). Spark Infrastructure may require an investor to complete a statutory declaration as to whether they (or any person on whose account or benefit it holds Stapled Securities) are an Excluded US Person. Spark Infrastructure may treat any investor who does not comply with such a request as an Excluded US Person. Spark Infrastructure has the right to: (i) refuse to register a transfer of Stapled Securities to any Excluded U.S. Person; or (ii) require any Excluded US Person to dispose of their Stapled Securities; or (iii) if the Excluded US Person does not do so within 30 business days, require the Stapled Securities be sold by a nominee appointed by Spark Infrastructure. To monitor compliance with these foreign ownership restrictions, the ASX’s settlement facility operator (ASX Settlement Pty Limited) has classified the Stapled Securities as Foreign Ownership Restricted financial products and put in place certain additional monitoring procedures. Foreign jurisdictions. No action has been taken to register or qualify the Stapled Securities in any jurisdiction outside Australia. It is the responsibility of any investor to ensure compliance with the laws of any country (outside Australia) relevant to their securityholding in Spark Infrastructure. No liability. No representation or warranty, express or implied, is made in relation to the fairness, accuracy or completeness of the information, opinions and conclusions expressed in the course of this presentation. To the maximum extent permitted by law, each of Spark Infrastructure, all of its related bodies corporate and their representatives, officers, employees, agents and advisors do not accept any responsibility or liability (including without limitation any liability arising from negligence on the part of any person) for any direct, indirect or consequential loss or damage suffered by any person, as a result of or in connection with this presentation or any action taken by you on the basis of the information, opinions or conclusions expressed in the course of this presentation. You must make your own independent assessment of the information and in respect of any action taken on the basis of the information and seek your own independent professional advice where appropriate. Forward looking statements. No representation or warranty is given as to the accuracy, completeness, likelihood of achievement or reasonableness of any forecasts, projections, prospects, returns, forward- looking statements or statements in relation to future matters contained in the information provided in this presentation. Such forecasts, projections, prospects, returns and statements are by their nature subject to significant unknown risks, uncertainties and contingencies, many of which are outside the control of Spark Infrastructure, that may cause actual results to differ materially from those expressed or implied in such statements. There can be no assurance that actual outcomes will not differ materially from these statements. Rounding. Amounts have been rounded to one decimal place. As a result, totals as correctly stated in tables may differ from individual calculations. Spark Infrastructure I Investor Presentation I 2019 35
You can also read