Bomboré Gold Project CORPORATE PRESENTATION - November 2019 - Orezone Gold Corporation
←
→
Page content transcription
If your browser does not render page correctly, please read the page content below
Bomboré Gold Project

   CORPORATE PRESENTATION
       November 2019

         ORE:TSX.V
           1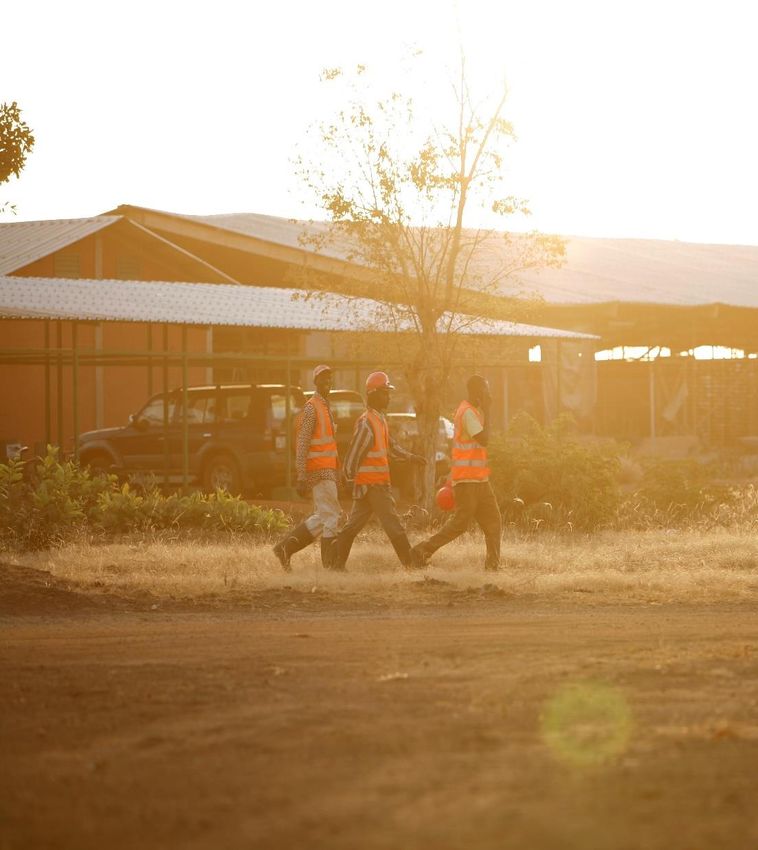
Forward Looking Statements
This presentation contains certain “forward-looking information” within the meaning of applicable Canadian securities laws. Forward-looking information and forward-looking statements (together, “forward-looking
statements”) are frequently characterized by words such as “plan”, “expect”, “project”, “intend”, “believe”, “anticipate”, “estimate”, “potential”, “possible” and other similar words, or statements that certain events or conditions
“may”, “will”, “could”, or “should” occur.

All of the results of the Bomboré Gold Project 2019 FS are forward-looking statements. These include statements regarding, among others, completion of the Phase I RAP in Q4-2019; approval of the updated ESIA by early 2020;
first gold pour in June 2021; oxide commercial production starting in Q4-2021; sulphide feed commencing in Q1-2024; and applicable construction timelines. In addition, forward-looking statements include statements with
respect to: pre-tax NPV5% of $513.5M and IRR of 61.9% of with a 1.5 year payback (IRR and NPV calculated from start of commercial production); after-tax NPV5% of $361.0M and IRR of 43.8% with a 2.5 year payback; mine life
of 13+ years with LOM gold production of 1.6M ounces and average annual production of 133.8k ounces in the first 10 years; initial project construction costs estimate at $153.0M; LOM expansion capital costs of $63.2M; LOM
sustaining capital costs of $66.2M; and LOM cash costs of $681/oz with cash costs of $629/oz in the first 10 years; and LOM AISC of $730/oz with AISC of $672/oz in the first 10 years (AISC excludes Corporate G&A). Furthermore,
statements regarding mine plan and production; mineral processing; project infrastructure; project economics; initial project capital costs; development and timeline timetables; and project opportunities are forward-looking
statements.

All such forward-looking statements are based on certain assumptions and analyses made by management and qualified persons in light of their experience and perception of historical trends, current conditions and expected
future developments, as well as other factors management and the qualified persons believe are appropriate in the circumstances. The forward-looking statements are also based on metal price assumptions, exchange rate
assumptions, cash flow forecasts, and other assumptions used in the 2019 FS. Readers are cautioned that actual results may vary from those presented.

In addition, all forward-looking statements are subject to a variety of risks and uncertainties and other factors that could cause actual events or results to differ materially from those projected in the forward-looking statements
including, but not limited to, use of assumptions that may not prove to be correct, unexpected changes in laws, rules or regulations, or their enforcement by applicable authorities; the failure of parties to contracts to perform as
agreed; social or labour unrest; changes in commodity prices; unexpected failure or inadequacy of infrastructure, the possibility of project cost overruns or unanticipated costs and expenses, accidents and equipment
breakdowns, political risk, unanticipated changes in key management personnel and general economic, market or business conditions, the failure of exploration programs, including drilling programs, to deliver anticipated results
and the uncertainties relating to the availability and costs of financing needed in the future, and other factors described in the Company’s most recent annual information form and management discussion and analysis filed on
SEDAR on www.sedar.com. Readers are cautioned not to place undue reliance on forward-looking statements.

This presentation also contains references to estimates of Mineral Resources and Mineral Reserves. The estimation of Mineral Resources is inherently uncertain and involves subjective judgments about many relevant factors.
Mineral Resources that are not Mineral Reserves do not have demonstrated economic viability. The accuracy of any such estimates is a function of the quantity and quality of available data, and of the assumptions made and
judgments used in engineering and geological interpretation, which may prove to be unreliable and depend, to a certain extent, upon the analysis of drilling results and statistical inferences that may ultimately prove to be
inaccurate. Mineral Resource estimates may have to be re-estimated based on, among other things: (i) fluctuations in the price of gold; (ii) results of drilling; (iii) results of metallurgical testing, process and other studies; (iv)
changes to proposed mine plans; (v) the evaluation of mine plans subsequent to the date of any estimates; and (vi) the possib le failure to receive required permits, approvals and licenses.

Although the forward-looking statements contained in this presentation are based upon what management of the Company believes are reasonable assumptions, the Company cannot assure investors that actual results will be
consistent with these forward-looking statements. These forward-looking statements are made as of the date of this presentation and are expressly qualified in their entirety by this cautionary statement. Subject to applicable
securities laws, the Company does not assume any obligation to update or revise the forward-looking statements contained herein to reflect events or circumstances occurring after the date of this presentation.

Orezone has filed an independent National Instrument 43-101 technical report entitled “Feasibility Study of the Bomboré Gold Project, Burkina Faso”. A copy of the technical report is available on SEDAR (www.sedar.com), the
Company’s website (www.orezone.com) and the results were summarized in Orezone’s June 26, 2019 News Release.

Pascal Marquis, Geo., Senior Vice President of Exploration and Patrick Downey, P.Eng, President & Chief Executive Officer are the Company’s qualified person under NI 43-101, who have reviewed and verified the technical
information in this presentation.                                                                                                                                                 2                                                         2
Management
Patrick Downey – President, CEO & Director                               Peter Tam – CFO
   • Engineer with +30 years resource industry experience                  • CPA and CFA, +25 years experience in senior-level finance roles
   • Previously President, CEO & Director of Elgin Mining, Aura            • Previously VP Finance of Nevsun, CFO of Elgin Mining, VP
     Minerals and Viceroy Exploration before its acquisition by Yamana        Finance of Aura Minerals and Treasurer for Thompson Creek
   • Formerly a director of Claude Resources and Dalradian                    Metals

Pascal Marquis – Senior VP, Exploration                                  Mark Humphery – Project Director
   • Geologist with over 30 years experience with major and                • Mechanical Engineer, +25 years experience Previously
     junior companies – extensive experience in Africa                       General Manager, Projects and Senior Construction Manager
   • Leading role in the exploration and development of Essakane             at Alufer Mining’s Bel Air Bauxite mine in Guinea
   • Has worked with Orezone since 2002                                    • Worked in Burkina Faso in senior engineering, project
                                                                             implementation and construction roles

Louis Archambeault – VP Corp. Dev. & Strategy                            André Baya – General Manager, Orezone Bomboré SA
   •   Over 15 years capital markets and finance experience                • Over 20 years experience managing companies in 6 different
   •   Previously was Director of Corp. Development for Goldcorp             African counties as an Expat
   •   Was with CIBC Mining Investment Banking for 6 years                 • Previously worked with Sundance Resources, Cominco, AMC
   •   Started career at AMEC in mining engineering consulting               and Roxgold

                                                                                                         3                                     3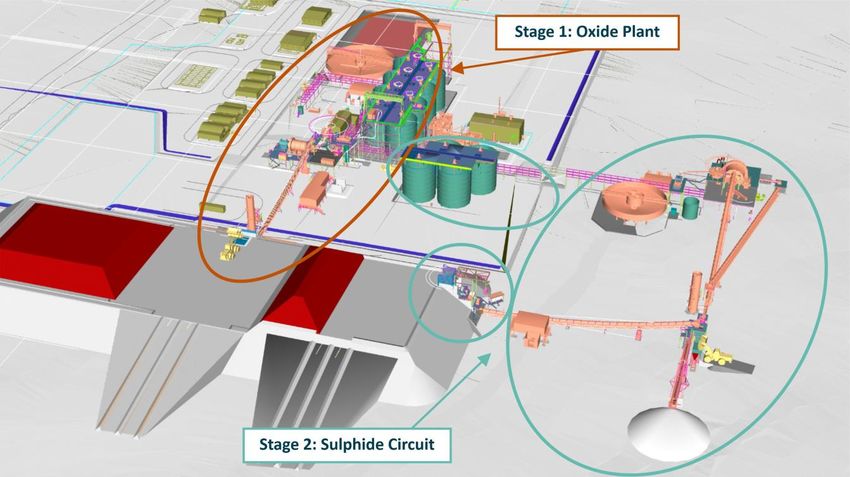
Capital Structure and Research Coverage
                                 Capital Structure
                                (as at Nov 5, 2019)                                                Insiders continue to buy ORE shares in
   Shares Issued                                                               213,376,906         the market
   Options                                                                         15,576,838      Analyst average 12-month target price
   Shares Fully Diluted                                                        228,953,744         C$1.50
   Cash (as at June 30, 2019)(no debt)                                       ~USD$22.7 M
   Market Cap (as at Nov. 5, 2019)                                                 ~C$150 M                         Equity Research Coverage
   1. Approximate figures are as at Nov. 5, 2019. Market Cap is based on the number of shares
   outstanding x the closing price of the Company's shares on the TSX-V on Nov. 5, 2019.
                                                                                                    Brokerage                Analyst             Phone
                                                                        RCF                     Canaccord               Eric Zaunscherb     416-869-7299
                                                                       19.7%
                                                                                                Clarus Securities       Nana Sangmuah       416-363-3350
                     Others
                     39.7%
                                                                                                Cormark Securities      Tyron Breytenbach   416-943-6747
Major Shareholders                                                    Sun Valley
                                                                        12.3%                   Paradigm Capital        Don Blyth           416-360-3461
                                                                                                PI Financial            Chris Thompson      604-718-7549

                       American                                 Mason Hill                      Raymond James           Tara Hassan         604-659-8064
                                                                 11.5%
                        Century
                         2.5%
                                Insiders
                                  5.8%
                                           Coris Bank Van Eck
                                             1.8%      6.8%
                                                                                                                              4                            4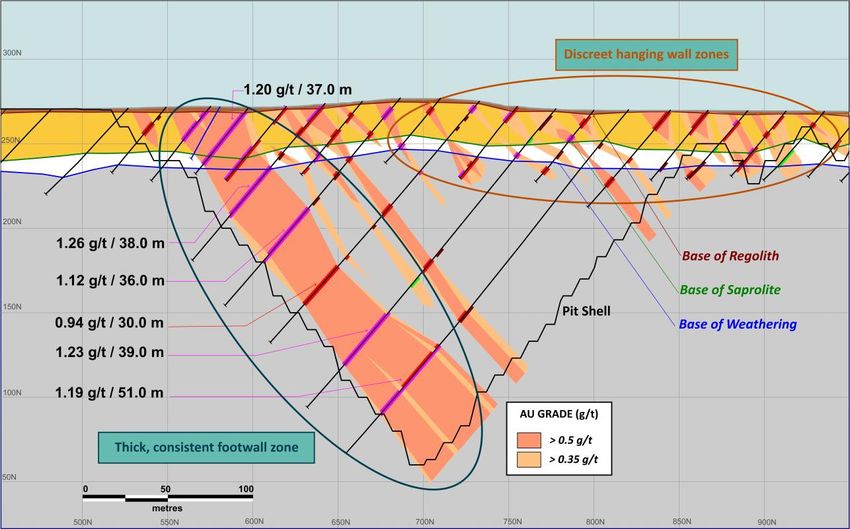
Orezone: A Refocused Story

 Since 2017, Orezone’s new management has delivered on all its objectives

            Changed the Development Strategy to a Staged Approach

                Focused on Project Scale Orezone can Finance and Build

                  Delivered a Robust Oxide only Feasibility Study

                  RCF joined as a Supportive Shareholder

                  Delivered an Updated Feasibility Study with Sulphide Expansion

                Continue to Review Enhancement and Expansion Opportunities

            Commence Project Development for 2021 Start-Up
                                                                     5             5
Investment Highlights

 Located in a leading gold development region with established infrastructure
 • Burkina Faso government is supportive of mining with 13 gold mines in production in the last
   10 years and 1 project currently in construction
 Permitted, advanced development project with robust economics
 • High margin, near-term production with first gold pour expected in H2, 2021
 Staged development – focused on scale that Orezone can finance and build
 • Responsible development strategy with significant enhancement and expansion potential
 Strong management team with extensive experience in mine development and
 operations in West Africa
 Committed to communities and strong corporate stewardship
 Supportive shareholders
                                                                             6                    6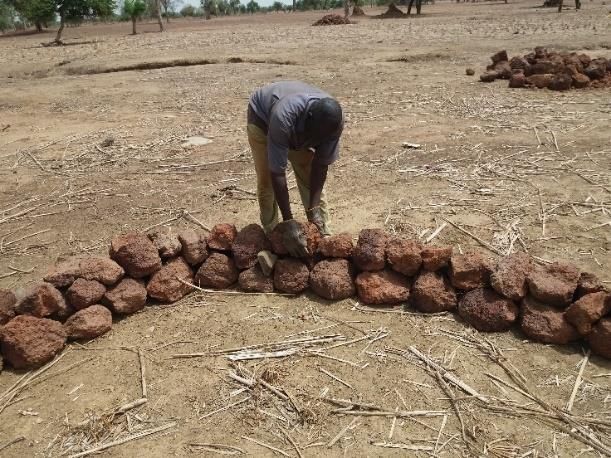
Burkina Faso: An Emerging Gold District

 Supportive mining jurisdiction
 • 13 gold mines in production
 • 1 gold mine in construction
 ~10Moz gold within 15km of Bomboré*
 • West African Resources: Sanbrado
 • B2 Gold: Toega
 • New high-grade gold discoveries
     in this emerging district
 Pool of skilled and trained
 workers increasing yearly

 *From most recent B2 and WAF public disclosure   7   7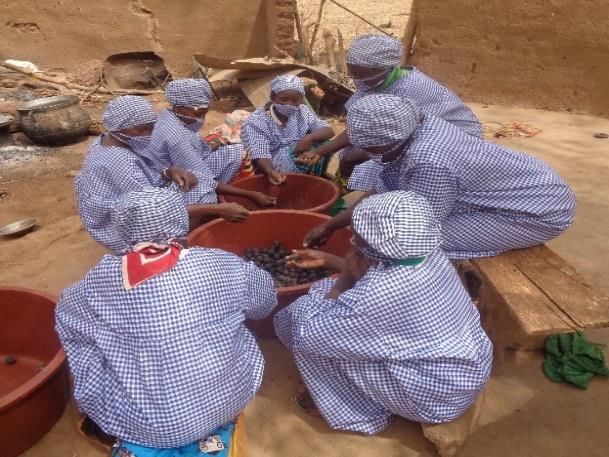
West Africa Gold Production 2010 vs 2019

            Production Growth from 2010 to 2018 By Region                                                                      2010 and 2018 Ounces by Region

80%
         69%        66%                                                                                                        Asia

60%                            54%                                                                      Central & South America
                                          50%

                                                                                                                   North America
40%
                                                     28%
                                                                                                              Independent States
20%
                                                                11%        11%
                                                                                                                          Oceania

 0%                                                                                                                    West Africa

                                                                                                                      South Africa
-20%

                                                                                                                            Europe
-40%
                                                                                      -38%                                            0          5          10          15            20   25

-60%                                                                                                                                      2010 Ounces      2018 Ounces

                                                                                                                                                     8
 Source: World Gold Council. West Africa includes: Ghana, Mali, Burkina Faso, Ivory Coast, Guinea, Senegal and Nigeria https://www.gold.org/goldhub/data/historical-mine-production             8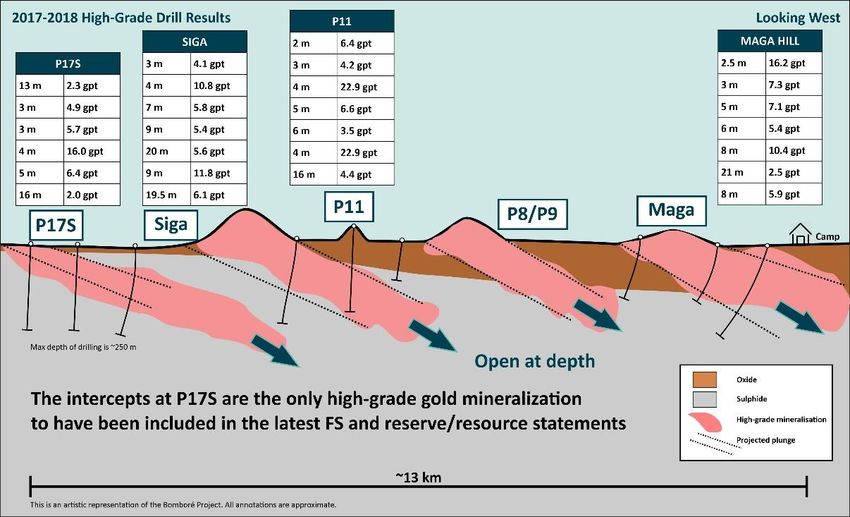
Capital Intensity & AISC vs Peers

                         Capital Intensity USD$/oz                                                                                          AISC USD$/oz
$300.00
                                                                                                                                                                                    $1,234

                                                                                                   $244/oz
$250.00
                                                                                         $222/oz                                                                $991

$200.00
                                                                                                                       $730                 $756
                                                                             $165/oz
               Average: $154/oz
$150.00                                           $138/oz $138/oz
                               $120/oz $125/oz

$100.00
                $79/oz
                                                               Continental

 $50.00
                                  Orezone

                                                                                                     Pure Gold
                    Belo Sun

                                                    Lundin

                                                                                Sabina

                                                                                           Falco
                                            WAF

  $0.00
                                                                                                                     Orezone           West Africa            Americas              Africa
                   Open Pit                                  Underground
  Based on most recently available public company filings. Capital Intensity is calculated by                    Data from public company disclosure. Based on 2018 reported actual AISC on an
  taking Project Capex in USD/P+P oz of gold.                                                                                                             9
                                                                                                                 asset-level basis. Orezone reports LOM AISC.                                    9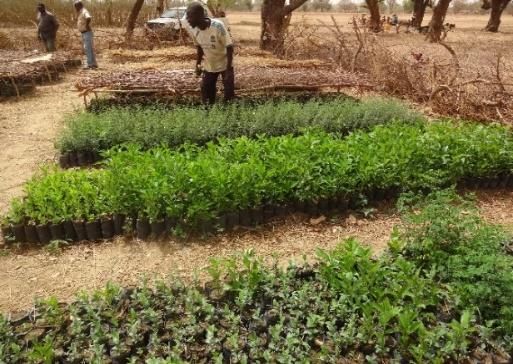
Bomboré Location & Local Infrastructure
Located 85 km (90 min) from the capital city along a major paved highway Access Road
in a secure location within proximity to a military training facility
5 km from town of Mogtédo with a population of 15,000; easy access to
skilled local workforce, housing and logistics
Excellent infrastructure with majority of support facilities in place: camp,
offices and warehouse facilities
Bomboré Camp
Ouaga Office
10 10Sulphide Expansion:
2019 Feasibility Study Focus
Identified P17S high-grade sulphide zone
Several additional high-grade sulphide zones
contained within main ore body
Staged Sulphide Expansion with production
commencing in Year 3 of oxide operations
• High-grade sulphides will displace oxide mill feed
Sulphide expansion funded from oxide cashflows
Significantly improves the overall gold production
profile and project economics
11 112019 Feasibility Study Highlights
After-tax NPV5% of $361.0M(1), IRR of 43.8% Description 2019 FS
Base Case Gold Price (US$/oz) 1,300
• 2.5-year payback Mine Life (years) 13.3
Total Waste Tonnes Mined (Mt) 164.4
Mine life of 13+ years with: Total Ore Tonnes Mined (Mt) 70.1
Strip Ratio 2.34
• LOM gold production of 1.6M ounces Production
• Average annual production of 133.8k oz in the first 10 years Processing Annual Throughput (Mt) 5.2
Total Gold Ounces Recovered (ounces) 1,599,569
Initial oxide construction cost: $153.0M Average Annual Gold Production (ounces) 117,760
Operating Costs
Sulphide expansion capital cost: $63.2M Unit Operating Costs ($ per tonne processed) 15.53
Cash Costs ($/ounce) 681
• in year 2 of oxide production AISC ($/ounce) 730
AISC(2) of $672/oz for the first 10 years Capital Costs 2019 FS
Initial Construction Costs ($M) 153.0
First gold pour targeted for mid 2021 Expansion Capital Costs ($M) 63.2
Sustaining Capital Costs ($M) 66.2
Closure Costs ($M) 17.9
All figures in USD unless otherwise stated. USD$1,300/oz gold price used. All numbers are on a 100% project basis. Financials 3,4
1. Discounted to the planned start of commercial production of October 1, 2021
2. AISC excludes Corporate G&A
Pre-tax NPV(5%)(millions) 513.5
3. Represents total project cash flows net of government royalties and taxes. The Government of Burkina Faso benefits from a 10% Pre-tax IRR 61.9%
free-carried interest, sales royalties (4% NSR between $1,000 and $1,300 Au), Local Development Mining Fund tax (1% NSR),
corporate income tax (27.5% tax rate), fuel taxes, VAT and withholding taxes on services. Post-tax NPV(5%)(millions) 361.0
4. Exchange rate assumptions: XOF:USD = 550; USD:EURO = 1.19; XOF:EURO = 655.957; Fuel price delivered to site: Diesel =
$1.05/litre; Heavy-Fuel Oil = $0.62/litre. Post-tax IRR 12 43.8% 123D Combined Processing Plant
Oxide plant capacity of
5.2Mtpa
• Reduced to 3Mtpa upon
commissioning of the sulphide
circuit
Sulphide circuit capacity of
2.2Mtpa
Both the oxide and sulphide
circuits are completely
independent
Leach circuit design allows
for additional tanks
ADR plant has excess
capacity
13 13Mill Feed Schedule
The sulphide expansion displaces diminishing oxide grades with higher-grade
sulphides, significantly improving the overall mill feed grade
Annual Mill Feed and Gold Grade by Ore Type
6.0 1.80
1.59
0.1 0.0 1.60
1.46
5.0 0.7
1.23 1.40
1.20
1.5 1.12 1.12 1.12 0.94
Gold Grade (g/t)
Ore tonnes (Mt)
4.0 1.20
1.02 1.03 1.00
0.91 2.2 2.2 2.2 2.2 2.2 2.2 2.1 0.92 1.00
0.87 0.83
3.0 0.73 0.76
0.68 0.70 0.66 0.67 0.80
0.65 0.66
2.0 0.49 0.60
0.40 0.37
0.57
0.40
1.0
0.20
1.2 5.2 5.2 3.8 3.0 3.0 3.0 3.0 3.0 3.0 3.1 4.5 5.1 5.2 1.3
0.0 -
Pre-prod. Year 1 Year 2 Year 3 Year 4 Year 5 Year 6 Year 7 Year 8 Year 9 Year 10 Year 11 Year 12 Year 13 Year 14
Oxide ore Sulphide ore Oxide grade Sulphide grade
14 142019 FS - After-Tax Free Cash Flow
After-tax Free Cash Flow remains positive during the construction of Phase II Expansion
200 After-Tax Free Cash Flow 600
Millions
After-Tax Cumulative Cash Flow (Millions)
(based on 2019 FS)
150
400
After-Tax Free Cash Flow (Millions)
100
200
50
0 0
Pre-Prod. Year 1 Year 2 Year 3 Year 4 Year 5 Year 6 Year 7 Year 8 Year 9 Year 10 Year 11 Year 12 Year 13 Year 14
-50
Phase II -200
Sulphide
-100
Expansion
-400
-150
-200 -600
15 152019 FS - Gold Production and AISC
Annual Gold Production and AISC/Ounce
180,000 $1,331 $1,400
(based on US $1,300/oz Au)
158,583 $1,233
160,000 149,704
144,154 $1,200
139,507
All-in Sustaining Costs (USD/ounce)
138,563
140,000 $1,031
125,823 126,326
121,827 121,627 $1,000
Gold Ounces, Recovered
120,000 112,066 $878
$755 $767 $761
100,000 $726 88,539 $800
$672 $823
$640 $639
80,000 $541 70,317 $600
$489
60,000 $408 53,582
$400
36,631
40,000
$200
20,000 12,320
- $-
Pre-Prod. Year 1 Year 2 Year 3 Year 4 Year 5 Year 6 Year 7 Year 8 Year 9 Year 10 Year 11 Year 12 Year 13 Year 14
Au production in oz AISC/oz
16 16EVOLVING GEOLOGICAL INTERPRETATION
17Evolving Geological Interpretation – High-Grade Hits
Historical drilling had identified several high-grade intercepts
Maga
• Generally the hanging wall zone is more complex than the continuous
~11km-long footwall shear
P8P9 CFU Higher-grade intercepts did not connect when modelled using the
steeply dipping main shear footwall interpretation
P11
• Had minimal influence on the grade in the resource or pit shells
The discovery of the high-grade P17S zone prompted a
P17N
Siga reassessment of the continuity of these higher-grade hits
P17 • Higher-grade plunging folds at 22 degrees vs 55 degree dip
P16 • A drill programme was planned and completed on several targets
P17S in 2017 and 2018 and confirmed this new interpretation
P13
Resource modelling incorporating this new interpretation is
well-advanced
18 18Evolving Geological Interpretation – Hanging wall
Siga South Deposit – Section 10600N New geological interpretation of
the hanging wall folded zones
should improve their continuity
and the metal inventory
• Current resource wireframes are
severely capped and the variography
used to populate the grade model is
not consistent with the fold
geometry
The footwall zone is well-defined
and understood
• Along the western side of a +13 km
shear-zone
• Significant proportion of Bomboré’s
resources are within the footwall
zone
• Interpretation in this area remains
essentially unchanged
19 19Evolving Geological Interpretation,
High-Grade Plunging W
A high-grade plunging W shaped fold was first identified at P17S in 2017
Artisanal miners were extracting high-grade at Maga, CFU, P8/P9 and Siga East
P17S 1 1 2
Maga
2
CFU
3
P8/P9 4
3
4
Siga E
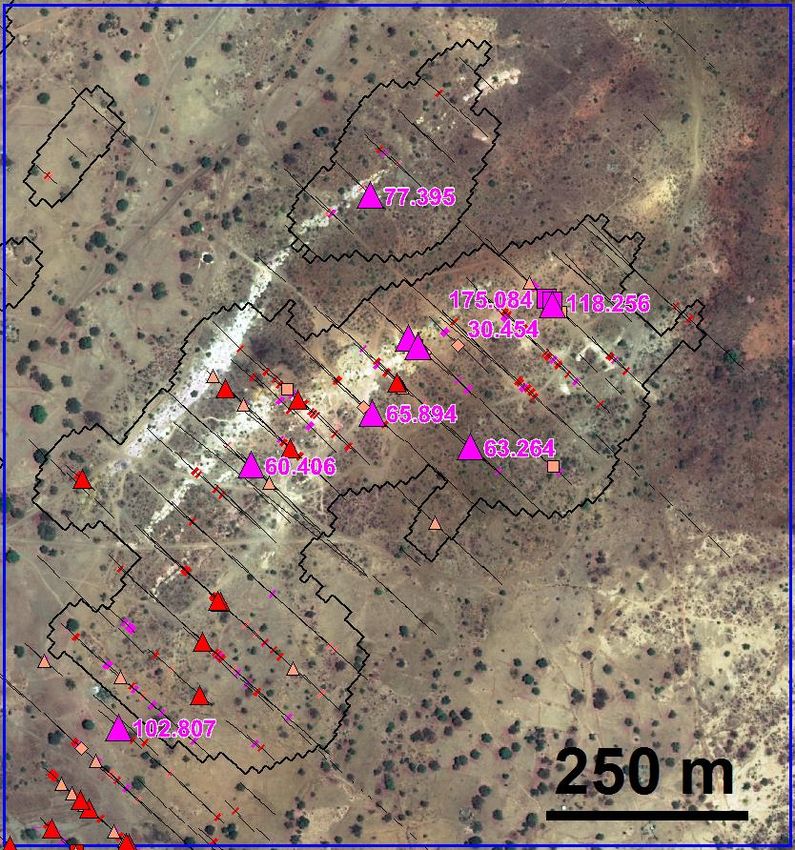
20 20Evolving Geological Interpretation – Drill Results
2017-2018 drilling confirmed high-grade plunging folds within existing mineralization
Not yet drilled
approximately 85% of the drill length. True width for Maga Hill is approximately 95% of the drill length.
21
True width for P17S is approximately 80% of the drill length. True width for Siga has yet to be determined. True width for P11 is
212018 Drill Results - CFU and P11
Hole From To Length Grade
CFU high-grade follow-up (m) (m) (m) (g/t Au)
oxide drilling targets BBC4580 30 35 5 3.2
Incl 1 10.7
Maga BBC4615 20 22 2 6.4
Incl. 1 10.4
BBC4620 30 33 3 4.19
CFU
Incl. 1 11.9
P8P9 BBC4647 3 6 3 5.4
Incl. 1 12.7
P11 BBC4678 48 56 8 2.2
Incl. 1 10.2
P17N
Siga W-E BBC4679 24 30 6 2.6
Incl. 1 12.2
Siga S
P17 BBC4695 2 7 5 7.8
Incl. 1 36.4
P16 BBC4696 19 23 4 3.6
P17S Incl. 1 12.4
BBC4716 3 8 5 10.27
Incl. 22 1 45.8P16 Down-Plunge Potential
P16 mineralized zone plunging North, open at depth, potential HG ore shoots
6m @ 5.0 gpt
12m @ 2.5 gpt
9m @7.6 gpt
13.5m @ 2.9 gpt
6m @ 7.6 gpt
12m @ 15.3 gpt
Multigram and
6m @ 4.7 gpt
multimeter drill intercepts
15m @ 5.9 gpt following a fold nose –
16.5m @ 9.1 gpt 5m @ 5 gpt None of which are
5m @ 16.5 gpt 9m @ 2.7 gpt included within the
15.5m @ 3 gpt current resources
19m @ 5.6 gpt
23m @ 5.1 gpt 23 23Enhancement Opportunities
1 - Continue to enhance existing production profile
2 - Extend mine life
Resource Modeling of Higher-Grade Plunging Folds, Regional Exploration to Replace
1 Improve Metallurgical Recoveries, Reduce Mining Dilution 2 Low Grade Stockpiles
180 1.02 1.03 1.01 110%
0.97 0.96
0.91 0.89 0.88 85.8%
160 0.85 0.85 85.8% 78.7% 90%
140 92.3% 92.3%
Recovered Gold (k oz)
91.2% 88.7% 88.7% 87.2% 85.0% 86.0% 85.4% 85.3% 83.9%
120 0.78 0.62 80.1% 70%
100 0.50
0.40 0.37 50%
80
144.2 149.7 139.5
138.6
60 125.8 126.3 121.8 121.6 30%
112.1
40 158.6 88.5
70.3 10%
53.6
20 36.6 12.3
0 -10%
Pre-prod. Year 1 Year 2 Year 3 Year 4 Year 5 Year 6 Year 7 Year 8 Year 9 Year 10 Year 11 Year 12 Year 13 Year 14
Recovered gold (koz) Recovery rate (%) Head grade (Au g/t)
24 24RAP & CSR
25 25RAP – Sample Houses
Current Houses
Site Construction
RAP Sample Houses
26 26RAP – Construction Overview
RAP Phase 1 housing
• 935 - 1 bedrooms
• 129 - 1 bedroom plus living room
• 48 - 2 bedroom plus living room
• Community infrastructure: schools, clinics, church and mosque etc.
Seven villages being constructed
Six house contractors - all locally based
All access roads to villages in place -
Key to ensure continued construction during rainy season
27 27Livelihood Restoration Programs
Programs
• Market gardens developed - agro-economist hired - additional gardens being developed
• Speciality cash crops being developed - spices, shea butter
• Chicken farming commenced - self funding and very successful to date
• Reclamation including tree and shrub plantations developed - part of ongoing reclamation and
closure
28 28Orezone Community Initiatives
Provision of seeds for crops Maternity ambulances Ambulance
Spice growing Agricultural reservoir Land reclamation
29 29NEXT STEPS
30Summary
2019 2020 2021
Project financing discussions well-advanced Q2 Q3 Q4 Q1 Q2 Q3 Q4 Q1 Q2 Q3 Q4
Complete Updated Feasibility Study
Development schedule on track
Finalize Project Finance Package
• FEED completed Resettlement Action Plan (Phase I)
Tailings Storage Facility
• RAP Phase 1 ongoing and on-track for substantial completion Off Channel Reservoir Development
by Q4-2019
EPC/EPCM
Geological reinterpretation Process Plant Construction
Commissioning
• Modelling of high-grade zones within existing pits ongoing Process Plant Ramp-Up
• Resource update scheduled for Q1-2020 First Gold Pour
12-month Orezone share price chart
• Drilling ongoing to confirm presence of high-grade plunging ore 1
0.9
1400000
1200000
shoots within oxides and into sulphides 0.8
0.7 1000000
• Drill results expected in Q4-2019 0.6 800000
0.5
0.4 600000
Project optimizations identified 0.3 400000
0.2
• Orezone continues to evaluate opportunities to improve 0.1
200000
0 0
Bomboré through exploration, resource conversion, grade
control and metallurgical improvements
Volume 31 Close
31APPENDIX
32Low Capital Costs – Why it works
Many positive elements contribute to the low capital cost of the Bomboré project
Simple Open Pit – Carbon in Leach
EARLY WORKS MINING PROCESSING
Low mobilization costs due to Contract Mining Minimal earth works
proximity to capital city No Pre-Strip Simple comminution circuit
• Project adjacent to paved highway Low pit maintenance • Only one Ball mill
Relocation house construction on a Minimal sustaining capital 8 generic leach thanks
fixed cost unit basis Simple carbon gold recovery unit
Simple site road construction on flat Staged tailing construction
terrain
Costs estimate based on FEED
Material removed from water
reservoir used for tailings Power supplied via long term
construction contract
33 33High Operating Margin Oxides – Why it works
Exceptionally Low Costs Provide High Margins
MINING PROCESSING
No crushing
Low LOM strip ratio (1.6:1) • Less equipment maintenance and people
Free-dig Only 20% of feed requires grinding
• No rock or quartz material • 80% of ROMBomboré Mineral Resource and Reserve
Estimates
Mineral Resource Estimate as of January 5, 2017
Classification Measured Indicated Measured + Indicated Inferred
Cut-off Tonnage Grade Contained Tonnage Grade Contained Tonnage Grade Contained Tonnage Grade Contained
Au g/t 000 t Au g/t Au koz 000 t Au g/t Au koz 000 t Au g/t Au koz 000 t Au g/t Au koz
Oxides 0.20 31,600 0.62 628 75,300 0.53 1,273 106,900 0.55 1,901 20, 900 0.40 265
Sulphides 0.2 / 0.38 9,000 0.90 260 113,600 0.79 2,894 122,600 0.80 3,154 32,400 0.81 842
TOTAL 40,600 0.68 888 188,900 0.69 4,167 229,400 0.69 5,055 53,300 0.65 1,107
Mineral Reserve Estimate as of June 26, 2019
Classification Proven Probable Proven & Probable
Tonnage Grade Contained Tonnage Grade Contained Tonnage Grade Contained
000 t Au g/t Au koz 000 t Au g/t Au koz 000 t Au g/t Au koz
Oxides 20,213 0.73 473 32,326 0.66 687 52,539 0.69 1,161
Sulphides 3,241 1.31 136 14,320 1.17 538 17,561 1.19 675
TOTAL 23,453 0.81 610 46,647 0.82 1,225 70,100 0.81 1,835
Notes to Mineral Resources: Notes to Mineral Reserves:
1. CIM definitions (2014) were followed for Mineral Resources. 1. Oxides include regolith, saprolite and upper transition material.
2. Mineral Resource are inclusive of Mineral Reserves. 2. Sulphides include lower transition and fresh material.
3. Oxide resources are made up of the regolith, saprolite and upper transition layers reported at a cut-off of 0.2 g/t Au. 3. Mineral Reserves have been estimated in accordance with the CIM Definition Standards.
4. Sulphide resources are made up of lower transition and fresh layers reported at a cut-off of 0.2 g/t Au and 0.38 g/t Au respectively. 4. Mineral Reserves are estimated at an average long-term gold price of US$1,250/troy oz.
5. Mineral Resources have been constrained within a preliminary pit shell generated in Whittle software. 5. Mineral Reserves are based on cut-off grades that range from 0.300 to 0.325 g/t Au for oxides, and 0.466 to 0.555 g/t
6. Mineral Resources are estimated using a long-term gold price of US$1,400 per ounce. Au for sulphides.
7. A minimum mining width of approximately 3 m was used. 6. Mineral Resources which are not Mineral Reserves do not have demonstrated economic viability.
8. Bulk densities vary by material type. 7. There are 1.7Mt of low-grade mineralized oxide material above cut-off grade remaining in the stockpiles that are not
9. Mineral Resources that are not Mineral Reserves do not have demonstrated economic viability. included in the Reserves Estimate.
10. Numbers may not add due to rounding. 8. Mining recovery factors estimated at 98% for Oxides and 96%-100% for sulphides.
9.
10. 35
Processing recovery varies by grade, weathering unit and location.
Rounding of some figures may lead to minor discrepancies in totals. 35Directors
MICHAEL HALVORSON • Over 50 years experience in the securities industry
Chairman • Since 1980, he has been the President of Halcorp Capital, a private investment corporation
• Past director of Strathmore Minerals, Western Silver, Novagold Resources, Esperanza Silver, Pediment Exploration, Fission Energy,
Novus Energy and Gentry Resources
RONALD BATT • 35 years experience as a Chartered Professional Accountant and retired Senior Partner with Ernst & Young
Director • Extensive experience in cross border tax issues, international structures, mergers and acquisitions and other corporate reorganizations
JOSEPH CONWAY • Geologist with over 30 years mining and financial experience
Director • Previously Primero Mining’s Executive Vice Chairman and CEO prior to its acquisition by First Majestic Silver Corp.
• Prior to Primero, Mr. Conway was President & CEO of IAMGOLD Corporation
CHARLES OLIVER • Over 30 years experience as an award-winning fund manager
Director • Previously with Sprott Asset Management as the Lead Portfolio Manager of the Gold and Precious Metals Fund and prior to that, Mr.
Oliver was at AGF Funds where he was Senior Vice President and Lead Portfolio Manager
• Current board member of Cabral Gold and previously was on the Integra Gold board until its acquisition by Eldorado Gold and with
Klondex Mines until its acquisition by Hecla Mining
MARCO LOCASCIO • CEO of Adia Resources Inc.
Director • Former portfolio manager and analyst of 11 years at Mason Hills Advisors focusing on precious metals equities
STEPHEN AXCELL • Minerals Processing Engineer with over 38 years experience in mining operations management, project management execution, process
Director plant design and construction management
• Previously was Senior VP at Jacobs a large professional services company focused on engineering and construction
• Experience includes greenfield and brownfield projects in Asia, Africa, USA, Canada, South America, Europe and the Middle East
KATE HARCOURT • Sustainability professional with over 30 years experience, principally in mining with extensive project and permitting experience in Africa
Director • Worked with numerous mining companies on behalf of Equator Principles signatory financial institutions and has consulted on
assignments for the International Finance Corporation
• Currently is a non-executive director of Condor Gold plc and Roxgold Inc.
36 36For more information,
please contact Vanessa Pickering,
Manager, Investor Relations:
info@orezone.com
Tel: 778-945-3974
37You can also read