Full-year results 2019/20 - (1 July 2019 - 30 June 2020) Riet Cadonau, Chairman & CEO Bernd Brinker, CFO
←
→
Page content transcription
If your browser does not render page correctly, please read the page content below
Riet Cadonau, Chairman & CEO
                               Bernd Brinker, CFO

                               Zurich/Switzerland, 3 September 2020

Full-year results 2019/20
(1 July 2019 – 30 June 2020)
Agenda

Full-year results 2019/20 at a glance                     Slide 3
    Riet Cadonau

Sustainable investments                                   Slide 12
    Riet Cadonau

Financial results and outlook                             Slide 17
    Bernd Brinker

2             Presentation on full-year results 2019/20              3 September 2020
Full-year results 2019/20 at a glance

Crisis management priorities

                                                                                                                      $
             Health & Safety                                         Supply chain                         “Cash is King”

    •   Protect employees                                  •   Ensure business continuity      •   Ensure liquidity at all times

    •   Support employees, e.g. to adapt                   •   Continuous premium services     •   Focus on cash flow, e.g. trade
        to new ways of working                                 for customers                       receivables collection

    •   Transparent continuous internal                    •   Secure flexible and resilient   •   Initiate cost savings and
        and external communication                             supply chain                        restructuring program

3              Presentation on full-year results 2019/20                                           3 September 2020
Full-year results 2019/20 at a glance

Sales and profit impacted by Covid-19 pandemic, stronger operating cash flow

• Net sales of CHF 2,539.8 million (previous year CHF 2,818.3 million)
• Organic sales decrease of 6.9%
• EBITDA at CHF 325.0 million (previous year CHF 448.0 million), EBITDA margin 12.8%
  (previous year 15.9%)
• Net profit of CHF 164.1 million (previous year CHF 252.5 million)
• Operating cash flow margin up to 12.9% (previous year 10.0%)
• Dividend proposal of CHF 10.50 per share in accordance with dividend policy

4              Presentation on full-year results 2019/20                        3 September 2020
Full-year results 2019/20 at a glance

AS AMER: Organic sales and profitability heavily impacted by Covid-19 pandemic

                                                           CHF million                       FY 2019/20      FY 2018/19
• Organic growth in the first half of FY 2019/20,          Total segment sales                       755.3        816.7
  sales heavily influenced by the Covid-19                 Third-party sales                         720.4        783.7
  pandemic in the second half                              EBITDA                                    128.1        168.1
• Technical system issues at Mesker have been              EBITDA margin                             17.0%       20.6%
  resolved. Business performance remains under             Organic sales growth                      -8.1%       -1.8%
  pressure, as Covid-19 risk management
  measures slowed efforts
• Continued focus on innovative products like
  Switch Tech, a digital lock replacement for
  small-format interchangeable cores
• Alex Housten assumed responsibility as COO
  AS AMER as of 1 July 2020

5              Presentation on full-year results 2019/20                          3 September 2020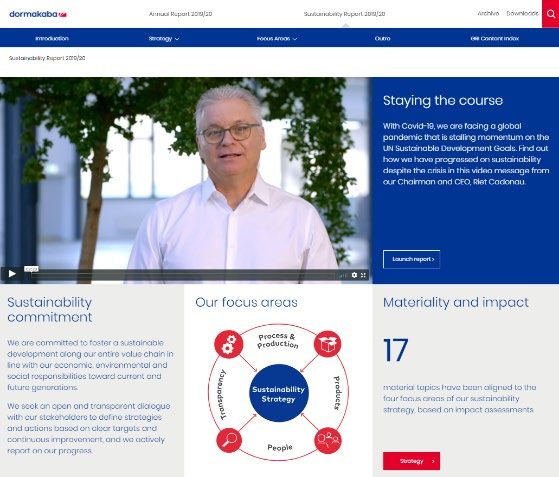
Full-year results 2019/20 at a glance

AS APAC: Despite strong negative impact from Covid-19 pandemic on sales,
EBITDA margin kept at a good level
                                                           CHF million                       FY 2019/20      FY 2018/19
• Second half of FY 2019/20 heavily impacted by            Total segment sales                       402.4        462.3
  the Covid-19 pandemic, major impact in the third         Third-party sales                         378.2        435.8
  quarter in China; in the fourth quarter all major        EBITDA                                     54.8         68.9
  markets across ASEAN region severely impacted
                                                           EBITDA margin                             13.6%       14.9%
  by Covid-19, as well as South Asia with biggest
                                                           Organic sales growth                      -8.5%        3.7%
  negative impact in India
• Commercial business in China held up well in
  FY 2019/20 despite Covid-19 impact
• Pacific region and particularly Australia less
  affected by the pandemic with organic sales
  growth for FY 2019/20
• Continued focus on innovative products like
  dormakaba 9160, a new face recognition terminal

6              Presentation on full-year results 2019/20                          3 September 2020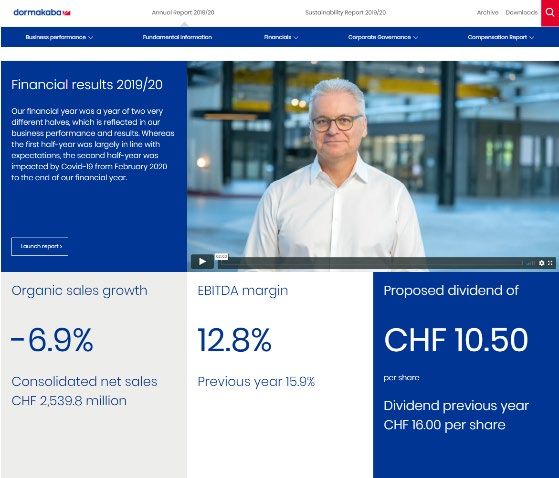
Full-year results 2019/20 at a glance

AS DACH: Overall negative impact from Covid-19 pandemic

                                                           CHF million                       FY 2019/20      FY 2018/19
• Switzerland with organic growth in FY 2019/20,
                                                           Total segment sales                       791.9        863.0
  sales in the German market slightly above and
  in Austria below last year’s level                       Third-party sales                         501.4        534.4
                                                           EBITDA                                    129.3        153.6
• Segment’s plants negatively impacted by lower
                                                           EBITDA margin                             16.3%       17.8%
  global demand for door hardware products,
                                                           Organic sales growth                      -3.5%        2.8%
  resulting in lower intercompany sales
• Segment was able to partly compensate the
  negative volume growth due to the Covid-19
  pandemic by benefiting from its performance-
  based program started in FY 2018/19
• Continued focus on innovative products like
  ARGUS AIR, a novel self-boarding gate that
  combines sensor barriers with biometric control
  allowing for touchless access

7              Presentation on full-year results 2019/20                          3 September 2020
Full-year results 2019/20 at a glance

AS EMEA: Sales and profitability negatively impacted by Covid-19 pandemic

• Organic growth in the first nine months of               CHF million                       FY 2019/20      FY 2018/19
  FY 2019/20; sales dropped substantially in               Total segment sales                       696.1        777.8
  the fourth quarter due to Covid-19 pandemic              Third-party sales                         585.2        660.7
                                                           EBITDA                                     45.5         56.7
• Even stable business activities such as Services
                                                           EBITDA margin                             6.5%         7.3%
  negatively impacted due to restricted access to
  customer premises during lockdown                        Organic sales growth                      -5.7%        1.9%

• Continued focus on innovative products like an
  automatic door system that uses 3D and thermal
  imaging to control the flow of people in stores
• Steve Bewick assumed responsibility as COO
  AS EMEA as of 1 January 2020
• Divestment of project installation business in
  Norway completed as of 31 August 2020

8              Presentation on full-year results 2019/20                          3 September 2020
Full-year results 2019/20 at a glance

Key & Wall Solutions: Despite strong negative impact from Covid-19 pandemic on
sales, EBITDA margin kept at a good level
Business Unit Key Systems:                                 CHF million                       FY 2019/20      FY 2018/19
                                                           Total segment sales                       351.4        401.9
• Heavily impacted by the Covid-19 pandemic in the
                                                           Third-party sales                         340.2        388.0
  second half of FY 2019/20 as major production
                                                           EBITDA                                     50.5         63.0
  sites in the US, in Italy, India, Columbia and Peru
                                                           EBITDA margin                             14.4%       15.7%
  were unexpectedly and temporarily closed
                                                           Organic sales growth                      -8.9%        2.2%
• Continued focus on innovative products like new
  digital solutions, including “MyKeys Safe”, a digital
  wallet for residential and automotive keys
Business Unit Movable Walls:
• Good organic growth in FY 2019/20, especially
  based on a strong performance of the North
  American Modernfold and Skyfold businesses
• New and innovative products support growth like
  cost-effective automated movable walls

9              Presentation on full-year results 2019/20                          3 September 2020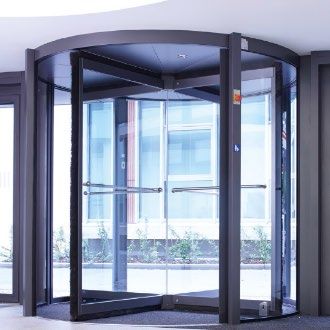
Full-year results 2019/20 at a glance

Changes in the Executive Committee

                                   Steve Bewick – COO AS EMEA
                               •      COO AS EMEA as of 1 January 2020
                               •      53 years of age, UK citizen
                               •      Joined dormakaba in 2008 and held various management and leadership positions with an impressive
                                      performance history at the company

                                   Alex Housten – COO AS AMER
                               •      COO AS AMER as of 1 July 2020
                               •      39 years of age, US citizen
                               •      Industry expert with an outstanding track record over more than 15 years in various management
                                      and leadership positions at United Technologies Corporation (UTC)

          A renewed Executive Committee, reduced from eleven to eight members since the merger. The
          role of CMO was discontinued as of 1 July 2020 as the operating model is now well-established.

10             Presentation on full-year results 2019/20                                                     3 September 2020
Agenda Full-year results 2019/20 at a glance Slide 3 Riet Cadonau Sustainable investments Slide 12 Riet Cadonau Financial results and outlook Slide 17 Bernd Brinker 11 Presentation on full-year results 2019/20 3 September 2020
Sustainable investments

Selection of products launched in FY 2019/20

                                                          •   Further development of this new generation of sensor barrier which is based on the company’s XEA design language and offers various
                               Argus                          features for more convenience while at the same time providing the same high level of safety and security. New features include
                                                              elements to support access control in times of a pandemic.

                                                          •   Launch of the new generation of self-locking panic locks with new advanced features like an advanced locking action, the possibility to be
                  Self-locking panic locks
                                                              operated by three protocols, and a LED indicator which eases handling by the installer and service technician.

                                                          •   A battery-powered, Bluetooth-enabled, Small Format Interchangeable Core (SFIC) that can replace a traditional mechanical core in an
                Switch Tech (Switch Core)                     existing lock, allowing customers to bring cost-efficiently electronic access control to openings. Switch Tech allows to go from mechanical
                                                              to digital in minutes and at a fraction of the costs of traditional hardwired access control.

                                                          •   ED ‘Force Balancing Technology’: major enhancement to our winning swing door operators ED series which significantly extends service
                   Swing Door Operators
                                                              lifetime.

                                                          •   A handle fingerprint lock in high-security design for advanced home security for the Asian markets, with various features such as vibration
                   FH9 Digital Door Lock
                                                              feedback, silent unlock, encryption management, and multiple alarms.

                                                          •   The self-closing patch fitting for toughened glass assemblies in Universal design. The door closes softly by itself, all components are
                       Universal Motion
                                                              integrated in the patch fitting, no power supply needed. Smart, almost invisible, comfortable and easy to install.

                                                          •   A redesign of the existing versatile Variflex system range, resulting in simplified production and sales processes. The products display an
                      Variflex Moduline                       optimized design to achieve high acoustic performance and offer advantages in terms of weight as well as in smaller dimension for space
                                                              saving in stacking and operation.

                                                          •   An innovative B2C (Business-to-Customer) digital service to allow end-users to store digitalized data of their residential and automotive
                          MyKeys Safe                         keys into a secure cloud wallet. Both key digitalizing and copying operations with Silca electronic machines at a locksmith’s shop are
                                                              controlled by the user.

12            Presentation on full-year results 2019/20                                                                                               3 September 2020
Sustainable investments
dormakaba well positioned to address demand in a post Covid-19 world
Smart and secure touchless access… … In attractive verticals such as healthcare
Facial recognition & temperature screening
Hygienic and user-centric access
Sensor & remote opening solutions
Automatic doors Tailor-made solutions
People flow management
Comprehensive portfolio
Access rights management platform
13 Presentation on full-year results 2019/20 3 September 2020Sustainable investments
Sustainability progress in the financial year 2019/20 in strategic focus areas
Emissions avoided through
green electricity purchase 16,400 Environmental Product
Declarations published
13
and energy efficiency tonnes CO2
ISO 14001 certified
manufacturing sites
36% 50% Products with
environmental and/or 19% 30%
of baseline target health product declarations of revenue share target
FY 2017/18
Manufacturing sites with
health & safety 73% 100% Suppliers invited for
sustainability assessment
475
management systems target
Participation rate in
80%
employee survey
dormakaba dialogue of full-time equivalent
employees
Statement of Commitment
on Human Rights published
Process & Production Products People Transparency
14 Presentation on full-year results 2019/20 3 September 2020Sustainable investments
dormakaba awarded gold medal for sustainability management from EcoVadis
EcoVadis, a leading provider for monitoring sustainability in global
supply chains, has rated dormakaba in the top 5% for sustainability
management in its assigned sector.
• Third-party assessment covers issues along the themes of
environment, labor & human rights, ethics, and sustainable
procurement
• dormakaba in top 30% from over 50,000 companies assessed by
EcoVadis
• Especially strong in the areas of sustainable procurement (top 21%)
and ethics (top 6%) among other companies in its assigned sector
15 Presentation on full-year results 2019/20 3 September 2020Agenda Full-year results 2019/20 at a glance Slide 3 Riet Cadonau Sustainable investments Slide 12 Riet Cadonau Financial results and outlook Slide 17 Bernd Brinker 16 Presentation on full-year results 2019/20 3 September 2020
Financial results and outlook

Key figures

• Covid-19 pandemic overshadows financial                  CHF million (except where indicated)                      FY 2019/20        FY 2018/19    Variance
  results for FY 2019/20, starting from February
                                                           Net sales                                                    2,539.8            2,818.3     -9.9%
  2020
• Organic sales growth of -6.9%                            - thereof: organic sales growth                               -6.9%               1.3%
    o H1: 0.8%                                             - thereof: acquisition sales growth                            0.7%              -1.0%
    o H2: -14.3%
                                                           - thereof: currency effect on sales                           -3.7%              -1.1%
• Net sales decreased by 9.9% due to volume
  decline in H2 as well as negative currency               EBITDA                                                         325.0             448.0     -27.5%
  translation effect                                                                                                     12.8%              15.9%     -3.1 ppt
                                                           EBITDA margin
• EBITDA margin of 12.8%
                                                           Profit before taxes                                            211.2             332.7     -36.5%
    o H1: 15.5%
    o H2: 9.6%                                             Net profit                                                     164.1             252.5     -35.0%
    o Includes extraordinary non-recurring                                                                                  84.6            131.8     -35.8%
                                                           Net profit after minorities
       costs (one-offs and Covid-19 related
       restructuring)                                      Earnings per share (diluted – in CHF)                          20.30             31.50
• Lower net profit driven by operational                   Dividend per share (in CHF)                                  10.501)             16.00
  performance
                                                           1) In   2019/20: proposal to the Annual General Meeting
• Proposed dividend per share of CHF 10.50
  (previous year CHF 16.00), in line with dividend
  policy

17             Presentation on full-year results 2019/20                                                                3 September 2020
Financial results and outlook
Sales development 2,818.3
2,714.0
• Organic growth of -6.9% due to Covid-19 related H2 business environment,
-104.3
all segments impacted
• Negative impact on net sales from currency translation (-3.7%) due to
stronger CHF against all major business portfolio currencies
19.0 2,539.8
• Positive impact of 0.7% on net sales from M&A related transactions, which
-193.2
improved business portfolio
• Relatively stable third-party sales contribution by segment vs. PY; AS AMER
continues to represent the highest share, while Key & Wall Solutions is the
smallest segment
FY 2018/19 Currency Currency Organic M&A FY 2019/20
translation adjusted
Third-party sales contribution and organic sales growth by segment
FX development against CHF (average rate)
Third-party sales contribution Organic sales growth
Segments FY 2019/20 FY 2018/19 FY 2019/20 FY 2018/19 Jun 2020 Jun 2019 Change
AS AMER 28.4% 27.7% -8.1% -1.8% USD 0.9770 0.9949 -1.8%
AS APAC 14.9% 15.5% -8.5% 3.7% EUR 1.0803 1.1350 -4.8%
AS DACH 19.7% 19.0% -3.5% 2.8% CAD 0.7286 0.7518 -3.1%
AS EMEA 23.0% 23.4% -5.7% 1.9% AUD 0.6559 0.7118 -7.9%
AS total 86.0% 85.6% -6.4% 1.1% GBP 1.2313 1.2880 -4.4%
Key & Wall Solutions 13.4% 13.8% -8.9% 2.2% CNY 0.1390 0.1458 -4.7%
Others 0.6% 0.6% 0.0% 1.4% INR 0.0135 0.0141 -4.3%
Total 100.0% 100.0% -6.9% 1.3% NOK 0.1048 0.1174 -10.7%
18 Presentation on full-year results 2019/20 3 September 2020Financial results and outlook
EBITDA development 448.0
432.0
-16.0
• EBITDA decreased by CHF 123.0 million vs PY (-27.5%), mostly Covid-19
related
o H1 contribution = CHF 214.1 million; H2 contribution = CHF 110.9 million
o Negative impact of CHF 16.0 million by currency translation (strong CHF)
9.3 325.0
o In addition, extraordinary non-recurring costs impacted the reporting
period (70 bps EBITDA margin) -116.3
• M&A activities contributed positively to EBITDA by CHF 9.3 million
• Relatively stable EBITDA contribution by segment vs. PY; AS AMER and
AS DACH continue to represent the highest share, while AS EMEA has the
smallest share due to its profile in our operating model FY 2018/19 Currency Currency Organic M&A FY 2019/20
translation adjusted
EBITDA contribution and EBITDA margin development by segment
EBITDA contribution EBITDA margin development
Segments FY 2019/20 FY 2018/19 FY 2019/20 FY 2018/19
AS AMER 31.4% 32.9% 17.0% 20.6%
AS APAC 13.4% 13.5% 13.6% 14.9%
AS DACH 31.7% 30.1% 16.3% 17.8%
AS EMEA 11.1% 11.1% 6.5% 7.3%
AS total 87.6% 87.6% 16.2% 18.4%
Key & Wall Solutions 12.4% 12.4% 14.4% 15.7%
Total 100.0% 100.0% 12.8% 15.9%
19 Presentation on full-year results 2019/20 3 September 2020Financial results and outlook
“Cash is King”
1 Early implementation of a comprehensive crisis management
• In March 2020, the “Cash is King“ principle was introduced throughout the entire organization to address the Covid-19 challenges
• Adjustment of financial management to retain entrepreneurial flexibility at all times
• Weekly steering by top management, strong collaboration between Operations, HR, Finance, IT
2 Measures (selection)
• Reduction in overtime, vacation days and of temporary workers, hiring freeze, short-time work in selected countries
• Re-assessment and adjustment of previously approved investments and projects
• Re-prioritization of M&A (continuation of pipeline management)
• Daily monitoring of cash flow development by tracking of all bank accounts
3 Status and results as at 30 June 2020 (selection)
• Significant improvement of working capital by reduction of trade receivables by more than CHF 100 million against PY
• Basically stable net debt and solid leverage (net debt/EBITDA) of 2.1x
• Sufficient committed credit lines available (undrawn amount of more than CHF 500 million)
20 Presentation on full-year results 2019/20 3 September 2020Financial results and outlook
Cost savings and restructuring program
Covid-19 pandemic impact Measures Financial impact
Unprecedented slump in Group-wide cost savings and Program will generate a
business activity restructuring program initiated positive financial impact
• Both supply and demand heavily impacted • Crisis counter-measures to maintain • Costs of the program are expected to
• Government-mandated lockdowns and operational and financial stability amount to CHF 26 million
many local restrictions limiting production • Program started early Q4 of FY 2019/20 • Thereof CHF 12 million already expensed
and/or execution of orders • Adjustment of internal capacities and costs in FY 2019/20 (provisions as of 30 June
• Substantial negative impact on dormakaba • Overall headcount reduction of up to 1,300 2020: CHF 8 million)
business; even usually very stable FTEs Group-wide, mainly in manufacturing • Limited additional CAPEX required to
businesses such as Services affected in Asia and the Americas to adjust for lower execute the entire program
• AS APAC hit first (China) and continues to volumes • Costs will be charged on Group level
be impacted severely (India), while Europe • Accretive to EBITDA by FY 2020/21
was second (Italy, Spain, France), later (dilution in FY 2019/20)
spreading across all regions; Key & Wall
Solutions most affected due its geographical
footprint
21 Presentation on full-year results 2019/20 3 September 2020Financial results and outlook
Income statement (condensed)
• Gross margin suffered from lower volume and CHF million FY 2019/20 % FY 2018/19 % Variance in %
decreased by 100 bps, mainly Covid-19 related Net sales 2,539.8 100.0 2,818.3 100.0 -9.9
• Lower SG&A spend as a result of lower volume
Gross margin 1,042.8 41.1 1,185.9 42.1 -12.1
and effective cost management initiatives
(Covid-19 related and beyond) Other operating income, net 11.3 0.4 21.2 0.8 -46.7
• R&D spending including capitalized R&D Sales and marketing -428.7 -16.9 -441.3 -15.7 -2.9
(CHF 9.6 million) = CHF 112.1 million (4.4% of General administration -269.7 -10.6 -283.4 -10.1 -4.8
sales); R&D expenses basically unchanged vs
PY (capitalized R&D PY of CHF 5.4 million, Research and development -102.5 -4.0 -107.4 -3.8 -4.6
total CHF 112.8 million; 4.0% of sales) EBIT 253.2 10.0 375.0 13.3 -32.5
• Stable net financial result (higher net debt on Financial result, net -42.0 -1.6 -42.3 -1.5 -0.7
average through FY, lower interest rates)
Profit before taxes 211.2 8.4 332.7 11.8 -36.5
• Favorable income tax rate of 22.3% due to
one-time benefits (PY 24.1%) Income taxes -47.1 -1.9 -80.2 -2.8 -41.3
• Decline of net profit driven by operational Net profit 164.1 6.5 252.5 9.0 -35.0
performance
22 Presentation on full-year results 2019/20 3 September 2020Financial results and outlook
Cash flow
• “Cash is King” principle introduced in March 2020 to handle CHF million FY 2019/20 FY 2018/19
the challenges of Covid-19 and to maintain financial stability Cash generated from operations 407.9 372.8
• As a result, strong improvement of operating cash flow Net cash from operating activities 328.1 280.7
margin to 12.9% (PY 10.0%)
Net cash used in investing activities -232.4 -67.8
• Strong trade receivables collection as the main driver for
improved operating cash flow (reduction in assets of - thereof: capital expenditure -94.9 -111.4
CHF 111.4m vs. PY closing) - thereof: acquisition and divestment related -147.2 33.2
• Cash flow from investing activities includes Free cash flow 95.7 212.9
• Capital expenditures of CHF 94.9 million (PY:
Operating cash flow margin1) 12.9% 10.0%
CHF 111.4 million), which represents 3.7% of sales
(PY: 4.0%)
• Acquisitions of CHF 147.2 million, while PY comprises Free cash flow before acquisitions/
242.9 179.7
net proceeds from divestments of CHF 33.2 million divestments
• Improvement of free cash before acquisitions / divestments 1) Net cash from operating activities / net sales
in the reporting period against PY due to strong operating
cash flow
23 Presentation on full-year results 2019/20 3 September 2020Financial results and outlook
Net debt
FY ended FY ended
• Net debt development benefited from implementation of CHF million
30.06.2020 30.06.2019
“Cash is King” principle
Cash and cash equivalents 156.8 122.4
• As a result, net debt improved significantly against HY
Short term debt 139.9 86.3
reporting (31 December 2019: net debt of CHF 836.1
million) Bond (long term) 680.4 680.5
• Solid leverage (net debt/EBITDA) of 2.1x Other long term debt 4.2 7.0
• Unused committed credit lines available of more than Net debt 667.7 651.4
CHF 500 million
Net debt / EBITDA (leverage) 2.1x 1.5x
• Slightly higher net debt by CHF 16.3 million mainly as a
result of acquisitions and capital expenditures as well as
dividend payments for FY 2018/19, which exceeded net
cash from operating activities of the reporting period
• Maturity of bonds (long-term debt) only in October 2021
(CHF 360 million) and October 2025 (CHF 320 million)
• Still comfortable with leverage of up to 2.5x (short term even
higher), which provides additional financial flexibility; M&A
re-prioritized as part of crisis management
24 Presentation on full-year results 2019/20 3 September 2020Financial results and outlook
Dividend payout proposal for financial year 2019/20
Dividend policy Proposed dividend payout FY 2019/20
Envisaged pay-out ratio of minimum of 50% of consolidated • Consolidated net profit after minority interests for
net profit after minority interests financial year 2019/20 = CHF 84.6 million
• CHF 10.50 per share (total CHF 44.2 million)
• Pay-out ratio = 52.1%;
distribution of an equal share from the reserves from capital
100% 18.00 contributions (balance today: CHF 93.5 million) and from
16.00
90% 15.00 16.00 statutory retained earnings (balance today: CHF 411.3 million)
14.00
80% 14.00
12.00 12.00
70% 10.50 12.00
60%
1)
10.00
50% 54.6%
51.2% 50.3% 50.2% 50.5% 52.1% 8.00
40%
6.00
30%
20% 4.00
10% 2.00
0% 0.00
2)
2014/15 2015/16 2016/17 2017/18 2018/19 2019/20
Payout ratio Dividende in CHF
1) FY 2015/16: Adjusted for merger related integration costs, “extraordinary result”
2) FY 2019/20: Dividend proposal, pay-out ratio calculation is based on the total number of shares as at 30 June 2020.
The effective ratio depends on the number of shares entitled to dividend as at 21 October 2020.
25 Presentation on full-year results 2019/20 3 September 2020Financial results and outlook
Economic environment: Sequential improvement expected – limited visibility for
FY 2020/21 due to Covid-19 pandemic
• Financial performance in the months of June and July 2020 indicate an
improvement of the economic environment for dormakaba’s businesses
compared with the very weak months of April and May 2020. While some
important countries for dormakaba continue to suffer from negative Covid-19
impacts, other important countries show resilience and an improved business
Outlook FY 2020/21 performance.
• However, due to the ongoing Covid-19 pandemic, global business visibility is
still very limited. Geopolitical risks like the ongoing trade conflicts create
additional uncertainty.
• Under the assumption that Covid-19 or geopolitical tensions will not create
additional significant deterioration of the business environment, dormakaba
expects for the first quarter of FY 2020/21 to outperform financial results of
the fourth quarter of FY 2019/20, both in terms of organic growth and EBITDA
margin. Based upon the same framework, expectation for the first half of
FY 2020/21 is to outperform second half of FY 2019/20.
• Due to the lack of visibility to the further course of business dormakaba does
not provide any additional financial and business guidance for FY 2020/21
and beyond.
26 Presentation on full-year results 2019/20 3 September 2020Financial results and outlook
Sabrina Soussan to take over as CEO on 1 April 2021
Co-CEO of Siemens Mobility since 2017
French and German citizen
51 years of age
Studied engineering and completed an MBA before
starting her career as a development engineer at
Renault
Held several leadership positions in Siemens’
mobility, building technologies and automotive
businesses over the past 20 years
Strong leadership and personal skills, profound
industrial knowledge and a successful track record
of growing businesses profitably
A smooth transition to a new CEO with a strong track record in delivering profitable growth and
driving innovation
27 Presentation on full-year results 2019/20 3 September 2020Thank you for your attention. 28 Presentation on full-year results 2019/20 3 September 2020
IR Agenda 2020/21

•    UBS, Best of Switzerland Virtual Conference                   17 September 2020

•    Baader Helvea, Investment Conference 2020, Munich & Virtual   24 September 2020

•    Jefferies, 2020 European Mid-Cap Industrials Virtual Forum    14 October 2020

•    Annual General Meeting                                        20 October 2020

•    Credit Suisse, Swiss EQ Mid-Cap Conference, Zurich            18 November 2020

•    Baader Helvea, Swiss Equities Conference, Bad Ragaz           15 January 2021

•    Publication and presentation of HY results 2020/21            03 March 2021

29            Presentation on full-year results 2019/20                                3 September 2020
If you want to find out more, visit us on one of our websites or channels

Annual Report 2019/20
     Read more about the financial results 2019/20 of dormakaba Group
     on report.dormakaba.com/2019_20.

Sustainability Report 2019/20
     Visit report.dormakaba.com/2019_20/sustainability to find out what
     we have achieved in sustainability during financial year 2019/20.

dormakaba Newsroom
     Find the latest news about dormakaba in our newsroom on
     newsroom.dormakaba.com.

dormakaba blog
     Latest insights and inspirations from the world of access in our blog
     on blog.dormakaba.com.

30         Presentation on full-year results 2019/20                         3 September 2020
Appendix Segment split – Key & Wall Solutions Product portfolio Currency exposure Shareholder structure 31 Presentation on full-year results 2019/20 3 September 2020
Appendix - Results FY 2019/20

Segment split – Key & Wall Solutions

 Business Units                                                                   Key Systems                                                                  Movable Walls
                                                                                                                 Change on                                                                  Change on
 CHF million                                                 FY 2019/20      %    FY 2018/191)          %     previous year       FY 2019/20               %     FY 2018/191)       %    previous year
                                                                                                                       in %                                                                       in %
 Net sales third parties                                          180.4                  229.7                        -21.5%            159.8                             158.3                  0.9%

 Intercompany sales                                                 3.5                    3.6                                             7.7                             10.3

 Total business unit sales                                        183.9                  233.3                        -21.2%            167.5                             168.6                 -0.7%

 Change in business unit sales                                    -49.4   -21.2            4.7        2.1                                 -1.1        -0.7                  9.7    6.1

 Of which translation exchange differences                         -8.9    -3.8            -1.1       -0.5                                -5.7        -3.4                 -0.5   -0.4

 Of which acquisition (disposal) impact                             0.0    0.0             8.2        3.6                                  0.0        0.0                  -0.7   -0.4

 Of which organic sales growth                                    -40.5   -17.4            -2.4       -1.0                                 4.6        2.7                  10.9    6.9
 Operating profit before depreciation
                                                                   22.9   12.5            36.9       15.8             -37.9%              27.6       16.5                  26.1   15.5           5.7%
 and amortization (EBITDA)

 Average number of full-time equivalent
                                                                  1,387                  1,497                                            801                              799
 employees

1) In   order to enable a fair comparison with current-year data, certain segment costs have been reclassified within “Key Systems” and “Movable Walls”.

32                   Presentation on full-year results 2019/20                                                                                         3 September 2020
Appendix – Financial data
Currency exposure
As every globally active group, dormakaba is exposed to currency risks.
The currency profile of dormakaba shows a broad balance between sales and cost per region (= natural hedge)
Sales per currency regions Cost per currency regions
33% 32% 29% 28%
USD USD
EUR EUR
CHF CHF
Other Other
7%
7%
28% 36%
33 Presentation on full-year results 2019/20 3 September 2020Appendix – Product portfolio
Product portfolio* – one stop shop – balanced mix between mechanical, electronic
and cloud-based solutions
Safe Locks
Lodging Systems
Door Hardware
Entrance Systems
Mechanical
Electronic
Key Systems
Access & Data
Services Interior Glass Systems
* Figures are rounded on a 5% basis
34 Presentation on full-year results 2019/20 3 September 2020Appendix – Shareholder structure
Shareholder structure (1) – supporting sustainable development
dormakaba Holding AG (CH) (2)
[listed on SIX Swiss Exchange]
Shareholder dormakaba Holding AG 30.06.2020 30.06.2019
Pool Shareholders(4) 28.7% 27.2%
Shareholder Pool Free Float 71.3% 72.8%
(28.7%) Free float 52.5%
(71.3%)
“Kaba” Family
(18.0%) • Members of the Pool Shareholder Group hold:
• An economic interest of 62.6% in dormakaba;
“Dorma” Family dormakaba Holding • 28.7% of the 52.5% in dormakaba Holding GmbH +
(10.7%) 47.5% GmbH + Co. KGaA (DE) (3) Co. KGaA, which are directly held by the ultimate
parent company dormakaba Holding AG;
• And 47.5% in dormakaba Holding GmbH + Co.
KGaA.
• “Dorma” Family has increased its shareholding during
dormakaba FY2019/20 from 9.2% to 10.7%.
operating entities (3)
(1) Asof 30 June 2020
(2) Strategic,
financial and operational decisions are made at level of listed holding entity
(3) Execution of M&A as well as financing take place at level of dormakaba Holding GmbH + Co. KGaA (intermediate holding entity) and below
(4) Based on a pool agreement dated 29.04.2015
35 Presentation on full-year results 2019/20 3 September 2020Disclaimer This communication contains certain forward-looking statements including, but not limited to, those using the words “believes”, “assumes”, “expects” or formulations of a similar kind. Such forward-looking statements are made on the basis of assumptions and expectations that the company believes to be reasonable at this time, but may prove to be erroneous. Undue reliance should not be placed on such statements because, by their nature, they are subject to known and unknown risks, uncertainties and other factors which could lead to substantial differences between the actual future results, the financial situation, the development or performance of the company or the Group and those either expressed or implied by such statements. Such factors include, but are not limited to: the general economic conditions / impacts of the Covid-19 pandemic / competition from other companies / the effects and risks of new technologies / the company’s continuing capital requirements / financing costs / delays in the integration of mergers or acquisitions / changes in the operating expenses / currency and raw material price fluctuations / the company’s ability to recruit and retain qualified employees / political risks in countries where the company operates / changes in applicable law / and other factors identified in this communication. Should one or more of these risks, uncertainties or other factors materialize, or should any underlying assumption or expectation prove incorrect, actual outcomes may vary substantially from those indicated. In view of these risks, uncertainties or other factors, readers are cautioned not to place undue reliance on such forward-looking statements. Except as required by applicable law or regulation, the company accepts no obligation to continue to report or update such forward-looking statements or adjust them to future events or developments. It should be noted that past performance is not a guide to future performance. Please also note that interim results are not necessarily indicative of the full-year results. Persons requiring advice should consult an independent adviser. For definition of alternative performance measures, please refer to the chapter 5.1 of the notes to the consolidated financial statements of the Annual Report 2019/20 of dormakaba. This communication does not constitute an offer or an invitation for the sale or purchase of securities in any jurisdiction. dormakaba®, dorma+kaba®, Kaba®, Dorma®, Ilco®, La Gard®, LEGIC®, Silca®, SAFLOK®, BEST®, etc. are registered trademarks of the dormakaba Group. Due to country-specific constraints or marketing considerations, some of the dormakaba Group products and systems may not be available in every market. dormakaba Holding AG Hofwisenstrasse 24 8153 Rümlang Switzerland www.dormakaba.com
You can also read