An Efficient Deep Learning Based Model to Predict Interest Rate Using Twitter Sentiment - MDPI
←
→
Page content transcription
If your browser does not render page correctly, please read the page content below
sustainability

Article
An Efficient Deep Learning Based Model to Predict
Interest Rate Using Twitter Sentiment
Muhammad Yasir 1 , Sitara Afzal 2 , Khalid Latif 3 , Ghulam Mujtaba Chaudhary 4 ,
Nazish Yameen Malik 1 , Farhan Shahzad 5 and Oh-young Song 6, *
 1    Department of Management Sciences, COMSATS University Islamabad, Attock Campus 43600, Pakistan;
      yasirfw@cuiatk.edu.pk (M.Y.); nymalik@cuiatk.edu.pk (N.Y.M.)
 2    Department of Computer Science, COMSATS University Islamabad, Attock Campus 43600, Pakistan;
      sitara.afzal@yahoo.com
 3    Department of Commerce, Government College University, Faisalabad 38000, Pakistan;
      khalidlatif@gcuf.edu.pk
 4    Department of Business Administration, University of Kotli AJ&K, Kotli,11100, Pakistan;
      adfuajk@yahoo.com
 5    Department of Management Sciences, University of Wah, Wah Cantt, 47040, Pakistan;
      Farhan.shahzad@uow.edu.pk
 6    Department of Software, Sejong University, Seoul 05006, Korea
 *    Correspondence: oysong@sejong.edu

 Received: 24 January 2020; Accepted: 19 February 2020; Published: 22 February 2020

 Abstract: In macroeconomics, decision making is highly sensitive and significantly influences the
 financial and business world, where the interest rate is a crucial factor. In addition, the interest rate
 is used by the governments to manage the monetary policy. There is a need to design an efficient
 algorithm for interest rate prediction. The analysis of the social media sentiment impact on financial
 decision making is also an open research area. In this study, we deploy a deep learning model for the
 accurate forecasting of the interest rate for the UK, Turkey, China, Hong Kong, and Mexico. For this
 purpose, daily data of the interest rate and exchange rate covering the period from Jan 2010 to Oct
 2019 is used for all the mentioned countries. We also incorporate the input of the twitter sentiments
 of six mega-events, namely the US election 2012, Mexican election 2012, Gaza under attack 2014,
 Hong Kong protest 2014, Refugee Welcome 2015, and Brexit 2016. Our results provide evidence that
 the error of the deep learning model significantly decreases when event sentiment is incorporated.
 A notable improvement has been observed in the case of the Hong Kong interest rate, i.e., a 266%
 decline in the error after incorporating event sentiments as an input in the deep learning model.

 Keywords: Deep learning; Interest rate forecasting; twitter sentiment

1. Introduction
      In economics and business applications, the accurate forecasting of time series data has always
been a critical issue, including wind speed prediction [1,2], portfolio risk [3,4], volatility of the energy
market [5,6], exchange rate [7], inflation [8], and stock market index [9,10]. In this context, the
forecasting of the interest rate has a crucial importance while making decisions in business and
economics. It affects the valuation of derivatives and fixed income securities. In addition, the interest
rate is a part of monetary policy and the government, to control the fluctuation in overall price levels.
It also impacts asset prices and business cycles. In the Capital asset pricing model (CAPM), the return
on risky securities is elucidated in terms of excess returns relative to the risk-free rate. Therefore, in the
existing body of knowledge, a number of studies have proposed different statistical and soft computing

Sustainability 2020, 12, 1660; doi:10.3390/su12041660                       www.mdpi.com/journal/sustainability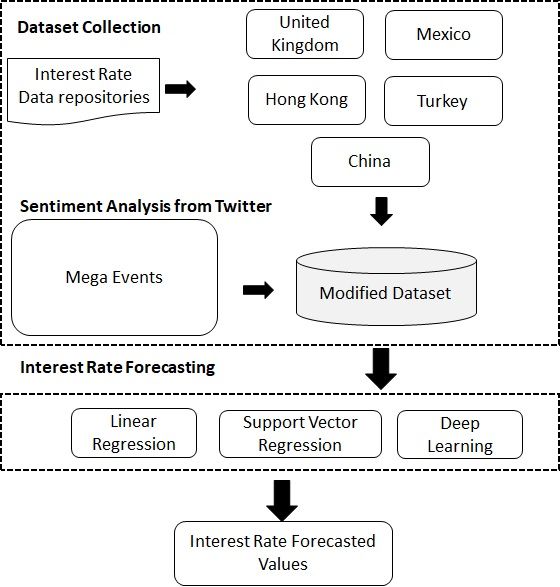
Sustainability 2020, 12, 1660                                                                      2 of 16

models for a more accurate forecasting, which is helpful for investors and business managers when
making decisions.
      Several mathematical finance models based on the theory of market equilibrium and no-arbitrage
assumption have been proposed in the last few decades to capture the changes incurred in the interest
rate. Furthermore, models based on stochastic processes are also common in the literature [11,12]. These
models are based on economic theories, but they fail to predict the dynamics of the interest rate during
the crises regime [11]. Therefore, the demand for a more practical and adaptive model has increased, in
order to model the dynamics of the interest rate [11]. There are a number of studies in which different
regression models, like vector autoregressive (VAR), autoregressive conditionally heteroskedastic
(ARCH), generalized autoregressive conditionally heteroskedastic (GARCH), and autoregressive
moving average, are used to forecast the time series interest rate [13,14]. All these regression models
only capture linear structures and generally fail to provide accurate prediction metrics [15]. These
models follow the assumption of normality of disturbance terms and the linear relationship among
variables. However, these assumptions are usually not valid for real-time data. Therefore, the use of
machine learning models to get accurate and robust results becomes inevitable [15,16]. These models
also capture non-linear patterns in time series data, which makes them more advantageous and useful.
There is very little work on social media relations with interest rate prediction. In particular, there
is no work where important local and global events are considered to check the effects on interest
rate prediction.
      In this study, we use advanced models of machine learning, i.e., linear regression, support vector
regression (SVR), and Deep Learning (DL) to predict the daily interest rates of the UK, Mexico, Turkey,
Hong Kong, and China. We used these models because of their ability to capture the nonlinear patterns
in time series datasets and also because they provide more accurate results. We used the exchange rate
for each respective country and the twitter sentiment of multiple events happening around the globe
as input. The twitter events used in this research are the US election 2012, Mexican election 2012, Gaza
under attack 2014, Hong Kong protest 2014, Refugee Welcome 2015, and Brexit 2016. These events are
categorized as local and global events with respect to each country. The sentiment of each event is
calculated and then used as a parameter for the interest rate prediction. We processed almost 9.6 million
tweets to calculate the daily event sentiment. The proposed approach is evaluated on the interest rate
dataset collected for almost 9 years for each country. The results showed a significant improvement
when the twitter sentiment is used along with deep learning. The proposed work contributes to the
literature in multiple ways. We used a deep learning-based algorithm for the efficient and accurate
prediction of interest rates by incorporating the twitter sentiment of local and global events for each
country. The system also uses the exchange rate as a parameter to predict the interest rate. Moreover,
we also compared our findings of a deep learning model with state-of-the-art forecasting methods and
showed the superiority of the proposed work.
      Our research study is organized as follows: the Section 2 is a precise literature review, Section 3
presents the detail of data and methodology, Section 4 discusses the results and discussion, and this is
followed by the last section, which presents the conclusions.

2. Literature Review
      There are a number of studies that focus on the mining of public opinions and emotions, which
is normally referred to as social media, where twitter is considered as one of the widely used social
platforms. In addition, these opinions, in the form of sentiments, have numerous applications in
market services and investment settings [17–20]. Social media plays a vital role in the return prediction
of Chief Executive Officer (CEO) through inside trading [21]. In the literature, there are studies that
focus on stock prediction using social the media sentiment of mega-events [22] and exchange rate
prediction in a similar context [23]. In terms of model comparison, there has been a formal comparison
of single-factor models [24]. The study was conducted on the data of the US and rejected the commonly
used square root diffusion model [25].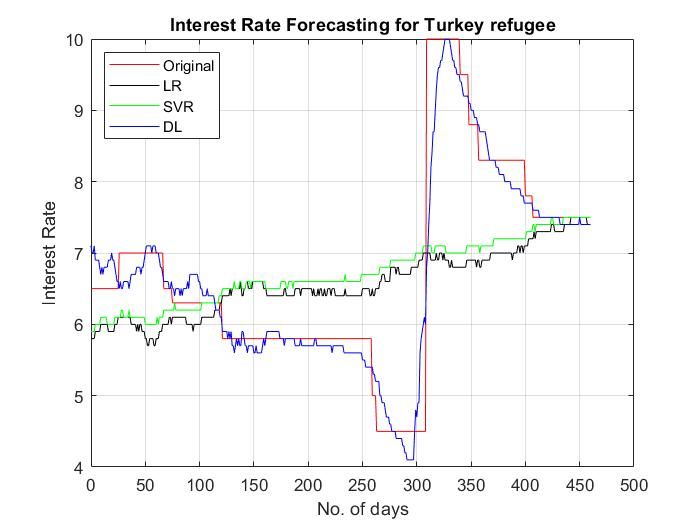
Sustainability 2020, 12, 1660                                                                        3 of 16

       The modeling of short-term interest rate prediction has been a crucial point in the literature
because it has a fundamental importance in fixed income securities and the risk associated with holding
such securities. In recent times, researchers have focused on those models that are capable of handling
issues of a complex nature without considering the structural assumption of time series datasets. These
assumptions are normality, non-heteroskedasticity, and linearity of variables. In this context, models
that can capture nonlinear patterns have become very common in recent research. In a study, US
3-months Treasury bills were forecasted using a Markov switching model by Hamilton [26], and the
model outperformed the linear model. Non-linearity exists in the interest rate because of the stochastic
swings [27]. This can also be understood by considering the business cycle [28]. Moreover, the term
structure of interest rate is also studied by considering nonlinearity in the time series datasets [29,30].
Artificial neural network (ANN) models outperform the state-of-the-art econometric models because
they provide robust results even if the time series data have violated the assumption of non-linearity.
These ANN models yield accurate results even if the sample size is low [31]. Contrary to this, the
traditional Box Jenkins (ARIMA) approach of forecasting provides reliable results only when the
sample size is above 50. Moreover, this technique is only suitable when there is a lack of information
about the data generating process [32].
       From the empirical perspective, the existing literature is divided into four different streams. The
first stream uses the change in the yield curve in order to predict the price level and GDP. Several studies
prevail in this stream and follow both linear and nonlinear models to use the spread among short
term and long term bond rates as an input factor for explaining different macroeconomic factors like
recession indices, price level, economic growth, and industrial production [33–38]. These econometric
models have great forecasting tendencies across different rejoins and time [39].
       The second part of the literature focuses on the “data-driven models”. In these studies,
mathematical models that are appropriate for focusing on spot rates are used for example splines [40]
and parsimonious [41,42]. However, these models focus on the future behavior of interest rates. In
addition, their focus is on the interpolation of the current shape and term structure. The third stream
focuses on “dynamic models” such as equilibrium models [11,43] and arbitrage-free models [44,45].
       The fourth stream of literature focuses on those data-driven models which rely on knowledge
discovery techniques to predict the interest rate. In addition, these models cope with complexities
like non-linearity, structural breaks, and seasonality issues laying in variables. Most of the research
focuses on the prediction of interest rates considering the time dynamics [46–50]. There are several
studies which follow machine learning models to predict the interest rate. Neural networks and
case-based reasoning (CBR) are used in the literature [47]. In the case of the US, the performance of the
neural network is better than that of CBR. In addition, it is important to incorporate the structural
changes in the economy in the neural network to get more refined results [48]. Furthermore, the
performance of the neural network improves when internet news of a positive or negative nature are
including as inputs in the neural network model. This news is related to a macroeconomic policy
like monetary policy, price levels, unemployment, etc. Another model called a fuzzy inference neural
network, dealing with non-linearity and the complex nature of interest rates, yield a better prediction
as compared to neural networks [51].
       In the existing literature, the deep learning model has not been used before to model the interest
rate. Moreover, the twitter sentiment on mega-events of a dynamic nature has never been incorporated
to predict the interest rate, which is a highly volatile and sensitive macroeconomic variable.

3. Data and Methodology
     In order to predict the interest rate, we follow a set of approaches that includes a state-of-the-art
econometric technique of linear regression, support vector regression, and deep learning. In the first
step, we predict the interest rate for different countries: the UK as a developed economy, and Turkey,
China, Hong Kong, and Mexico as emerging economies. We use the twitter sentiment of the relevant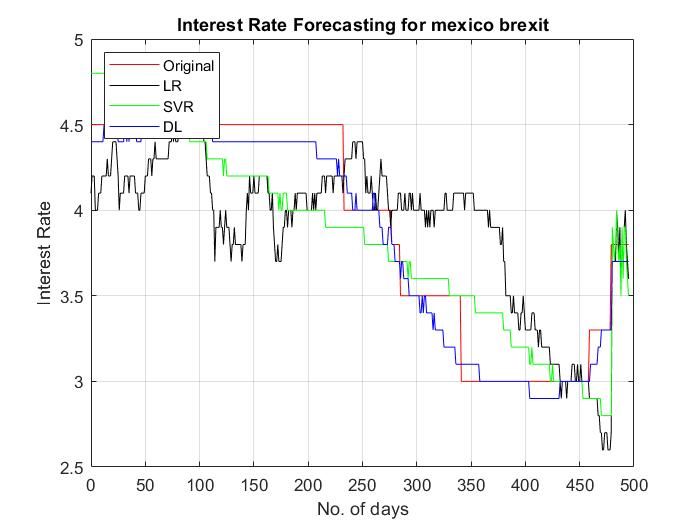
Sustainability 2020, 12, 1660                                                                                  4 of 16

events to predict the interest rate in the second step. Figure 1 shows the detailed flow of the process we
followed     for the interest rate prediction.
Sustainability 2020, 12, 1660                                                                        4 of 16

                                Figure 1.
                                Figure 1. The
                                          The methodology for the
                                              methodology for the interest
                                                                  interest rate
                                                                           rate prediction.
                                                                                prediction.

                         Twitter dataset
     First, we use the Twitter    dataset of
                                           of different
                                              different events
                                                         events and
                                                                 and calculate
                                                                       calculate the
                                                                                  the sentiment
                                                                                      sentiment for   for global
                                                                                                          global and
                                                                                                                  and
local events [52].
              [52]. Second,
                     Second,weweincorporate
                                 incorporatethisthissocial media
                                                      social mediasentiment
                                                                     sentimentto to
                                                                                 predict  thethe
                                                                                    predict     interest   raterate
                                                                                                     interest   of the
                                                                                                                    of
UK,UK,
the   Turkey,  China,
         Turkey,  China,Hong
                          Hong Kong,
                                 Kong,and
                                        and Mexico
                                              Mexicobybyusing
                                                           usingmultiple
                                                                 multipletechniques,
                                                                            techniques,i.e.,
                                                                                           i.e., linear
                                                                                                  linear regression,
          Vector Regression,
Support Vector    Regression, and
                               and deep
                                    deep learning
                                          learning (DL).
                                                     (DL). Table
                                                            Table 11 shows
                                                                     shows the
                                                                            the details
                                                                                 details of
                                                                                         of the
                                                                                             the dataset
                                                                                                    dataset we used
        interest rate
for the interest rate prediction.
                       prediction.

                                                Table 1.
                                                Table 1. Data
                                                         Data description.
                                                              description.

                            Countries                              Range of Range
                                                                             Data of Data
                           Countries     Variables Variables            Start             End
                                                             Start                End
                  UK, Turkey,                     Interest rate    1 January232010  23 2019
                                                                                       October 2019
           UK, Turkey, Mexico,Mexico,   Interest
                              China, Hong Kong rate    1 January   2010        October
                  China, Hong Kong               Exchange
                                       Exchange rate        rate   1
                                                       1 January 2010January  2010  23 October 2019
                                                                            23 October 2019

3.1. Sentiment Analysis of Social Media Tweet for Prediction of CC:
3.1. Sentiment Analysis of Social Media Tweet for Prediction of CC
      In order to calculate the sentiment from the textual data, we used the Alex Davies word list [53].
      In order to calculate the sentiment from the textual data, we used the Alex Davies word list [53].
In this approach, the list consists of almost five thousand words categorized into positive, negative,
In this approach, the list consists of almost five thousand words categorized into positive, negative,
and neutral sets. Tweets are tokenized, and the word list is prepared in order to remove whitespace,
and neutral sets. Tweets are tokenized, and the word list is prepared in order to remove whitespace,
emotions, punctuations, and URL. Tweets are classified as positive, negative, and neutral categories
emotions, punctuations, and URL. Tweets are classified as positive, negative, and neutral categories
by using an efficient and accurate dictionary. We replaced the word list by adding our own list of
by using an efficient and accurate dictionary. We replaced the word list by adding our own list
4000 words to improve the results because this list considers the relationship of each word and multi‐
of 4000 words to improve the results because this list considers the relationship of each word and
word expressions. At first, the daily textual data of positive, negative, and neutral tweets were
multi-word expressions. At first, the daily textual data of positive, negative, and neutral tweets were
represented in percentages, after which the net daily sentiment was calculated.
represented in percentages, after which the net daily sentiment was calculated.
      We processed the textual dataset of twitter of multiple events for the sentiment analysis. We
considered six mega‐events of a dynamic nature for the sentiment analysis, the details of which are
mentioned in Table 2. The dataset of the events was taken from twitter, which contains almost 9.6
million tweets. After the sentiment analysis, we predicted the interest rate by using a state‐of‐the‐art
econometric technique of linear regression and advanced robust techniques of SVM and DL.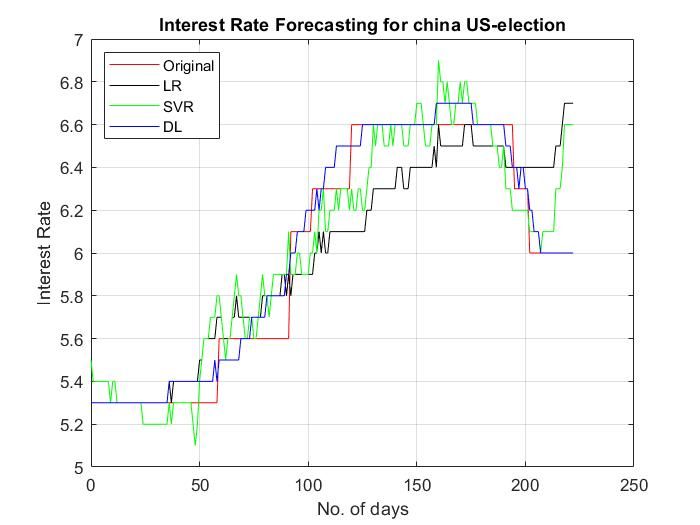
Sustainability 2020, 12, 1660                                                                         5 of 16

     We processed the textual dataset of twitter of multiple events for the sentiment analysis. We
considered six mega-events of a dynamic nature for the sentiment analysis, the details of which
are mentioned in Table 2. The dataset of the events was taken from twitter, which contains almost
9.6 million tweets. After the sentiment analysis, we predicted the interest rate by using a state-of-the-art
econometric technique of linear regression and advanced robust techniques of SVM and DL.

                                    Table 2. Dataset details with events.

                Events           Number of Tweets                Events             Number of Tweets
    Gaza under Attack (2014)         2,886,322            Mexican Election 2012           191,788
          Brexit (2016)              1,826,290              US Election 2012             1,740,258
    Hong Kong Protest (2014)         1,188,372           Refugees Welcome 2015           1,743,153

3.2. Forecasting Models
      In this section, we discuss the details of the models we applied for the interest rate prediction.
Support Vector Regression:
     The original SVM follows the theory of statistical learning algorithms. Furthermore, it manages
the structural risks [53,54]. In recent literature, the augmented form of SVM was used [54].
     Let us suppose the time series data is given as follows:

                                         D = (Xi , yi )s , 1 ≤ i ≤ N                                     (1)

where Xi represents the Exogenous Variable at the time i, and yi represents the Endogenous Variable.
The regression for the proposed dataset can be written as:

                                           f(Xi) = WT ϕ(Xi) + b                                          (2)

    In the above Equation (2), weight and bias are represented by W and b. The input vector X can be
mapped by ϕ(X) into a higher dimensional space. We solve the optimization problem represented in
Equations (3) and (4) for values of W and b:
                                                       X
                                  Min 1/2 ||W||2 + C       i=1N(εi + ε i ∗)                              (3)

      Subject to:
                                      yi − WT (φ(x)) − b ≤ ξ + εi
                                      WT (φ(x)) + b − yi ≤ ξ + ε I ∗                                     (4)
                                              εi , ε i ∗ ≥ 0
     In the above mathematical expressions, c represents the parameter that acts as a trade-off between
simplicity and generalizability, whereas ξi and ξ∗i the slack variables which are used for the cost of
errors. We used the kernel mapping approach to map the non-linear data from the original vector
space to higher-dimensional space. By this mapping, the regression form of SVM is obtained as follows
in Equation (5):                         X
                          yi = f(Xi) = N     i=1 ((αi − αi∗) K (Xi , Xj )) + b                       (5)

αi and α ∗ I show the Lagrange multipliers. Meanwhile, the Gaussian Radial Function is represented by:

                                  K(Xi , Xj ) = exp(− ||Xi − Xj||2 /(2σ 2 ))                             (6)

Linear Regression:
    Linear models are simple in nature, and therefore the time series data is predicted using these
simple models. We used multiple a linear regression in our modeling that considers a single variable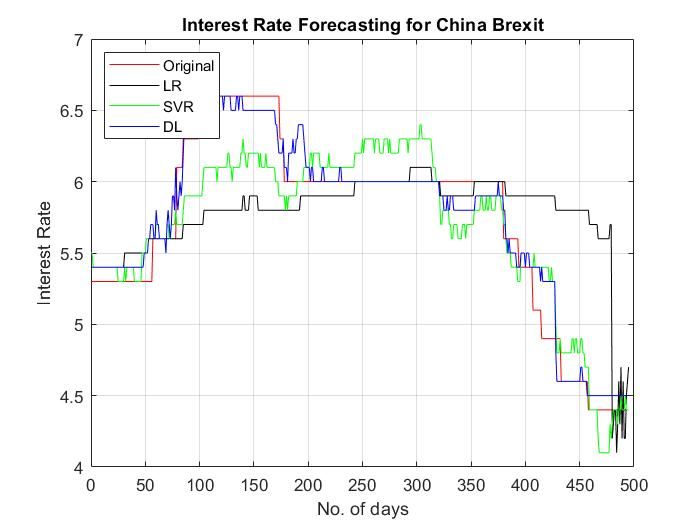
Sustainability 2020, 12, 1660                                                                      6 of 16

explained by multiple explanatory variables. We suppose y as the explained variable, which has a
linear relationship with k explanatory variables X1, X2, X3 . . . Xk:

                                     y = X1β1 + X2β2 . . . Xkβk + ε                                   (7)

Furthermore, β1, β2, β3 . . . βk are the slope coefficients of X1, X2, X3 . . . Xk respectively. ε is the
stochastic disturbance term, which is the difference between the fitted and observed values.
     The jth slope coefficient βj can be defined as the anticipated change in y due to the 1 unit change
in the jth explanatory variable Xj. Assuming E(ε) = 0, the equation can be written as:

                                             βj = ∂E(y) /∂Xj                                          (8)

Deep Learning Model:
     Deep learning is used to achieve more efficient results. There are hidden layers in neural networks,
and in each layer the net network learns new feature space through the linear transformation of the
given inputs. The continual non-linear function is applied, leading the process to the output layer.
Neural networks are defined as the process to get the output by flowing the information through
hidden layers. In our study, we apply the DL model, which contains a large number of hidden layers
and neurons which are interconnected and operate in a parallel way. Moreover, this approach is also
common for solving regression problems. The performance of the DL model improves when the
frequency of the data increases [55]. In this study, we use a DL model based on the Convolutional
Neural Network with the standard-setting.

3.3. Evaluation Metrics
     In time series prediction, there are multiple evaluation metrics, such as Absolute Error (AE) and
Root Mean Squared Error (RMSE). By subtracting the actual values from predicted values we obtain
these metrics [56,57].
Root Mean Squared Error—RMSE
     The following mathematical expression is used to calculate RMSE. It shows the average magnitude
of the estimated disturbance term of predicted values:
                                         s
                                             Pn                                 2
                                              t=1 ( f orecast(t) − actual(t))
                                RMSE =                                                                (9)
                                                               n

Mean Absolute Error–MAE
     MAE is obtained by taking the average of the estimated disturbance and avoiding the sign of the
predicted values. Equal weights are given to the estimated disturbance terms. All the estimated errors
are given equal weights. We use the following formula to calculate MAE:
                                           Pn
                                             t=1   f orecast(t) − actual(t)
                                 MAE =                                                               (10)
                                                           n
      Here, n shows the total number of estimated values. The predicted values are represented by
f orecast(t), which shows the forecasted values, whereas actual(t) shows the actual values.

4. Results and Discussion
      This part presents the details of the results and experimentation.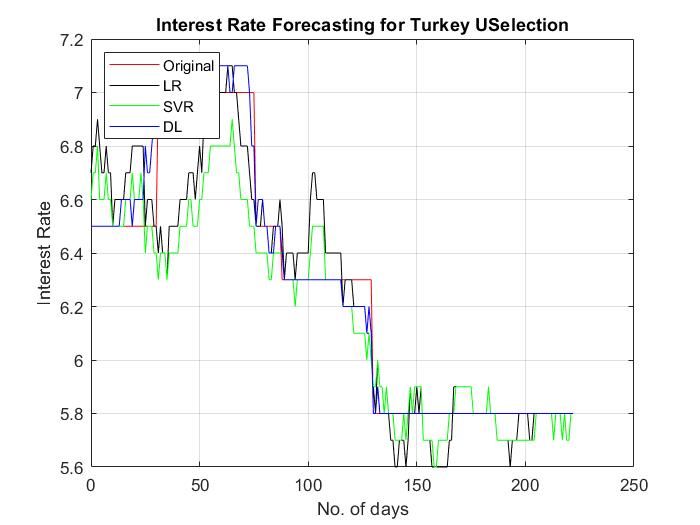
Sustainability 2020, 12, 1660                                                                                      7 of 16

4.1. Descriptive Statistics
     Table 3 below shows a summary of the interest rate of China, Hong Kong, Mexico, Turkey, and
the UK.

                                                  Table 3. Data Summary.

                                  China        Hong Kong            Mexico              Turkey           UK
                 Mean             5.192           0.961             4.962                8.925          0.499
                Median            5.310           0.500             4.500                7.500          0.500
                Std. Dev          0.834           0.739             1.698                5.349          0.125
                   JB           309.467 ***     860.188 ***       304.860 ***         2739.973 ***    108.597***
                   Pro            0.000           0.000             0.000                0.000          0.000
                  Obs              2733            2559              2548                2486           2558
                                              *** represent the significance at 1%.

      The interest rate of all the five countries follows a non-normal distribution because the normality
test statistic of JB (Jarque Bera) is highly significant at 1%. The interest rate of the UK has the lowest
mean (0.499), median (0.500), and standard deviation (0.125), as compared to the rest of the countries.
The Turkish interest rate shows the highest mean (8.925), median (7.50), and standard deviation (5.349).

4.2. Unit Root
      The results of the regression are only considered reliable when the time series data have the
problem of time dependence (Unit Root). For this reason, we use the Augmented Dicky Fuller (ADF)
test. The ADF test checks the problem of stationarity by testing the null hypothesis of “Unit root exists”
against the alternate of “No unit root”. The results are reported in Table 4. We check the stationarity of
the interest rate and exchange rate of all the countries in our dataset. The results show that both the
variables are stationary at a 1st difference in the case of all the five countries. Critical values are also
reported in Table 4.

                                                   Table 4. Unit root test.

                  Country                                      ADF Test Stat                 Critical Value (5%)
                                                         Level       1st Difference
                                   Interest Rate        −0.118         −50.341 ***                   −2.863
                   China
                                  Exchange Rate         −1.798         −12.635 ***                   −2.863
                                   Interest Rate        −0.624         −50.635 ***                   −2.863
                Hong Kong
                                  Exchange Rate         −2.056         −9.687 ***                    −2.863
                                   Interest Rate        −0.849         −31.252 ***                   −2.863
                   Turkey
                                  Exchange Rate         −1.568         −4.552 ***                    −2.863
                                   Interest Rate        −0.836         −50.512 ***                   −2.863
                   Mexico
                                  Exchange Rate         −0.368         −24.369 ***                   −2.863
                                   Interest Rate        −1.151         −50.524 ***                   −2.863
                     UK
                                  Exchange Rate         −1.765         −14.256 ***                   −2.863
                                              *** represent the significance at 1%.

4.3. Interest Rate Prediction without Sentiment
     In this part, we show the results of the interest rate prediction without incorporating the event
sentiment as input in our models. We used three different techniques, which are Linear Regression (LR),
SVR, and DL for the interest rate prediction. We also used the exchange rate as input or independent
variable for the interest rate prediction.
     We used the daily data interest rate and exchange rate of all the countries, ranging from 1st of
January 2010 to October 2019. The prediction results are reported in Table 5. It is evident from the
results of both the evaluation metrics (AE and RMSE) that the DL model yields more accurate results as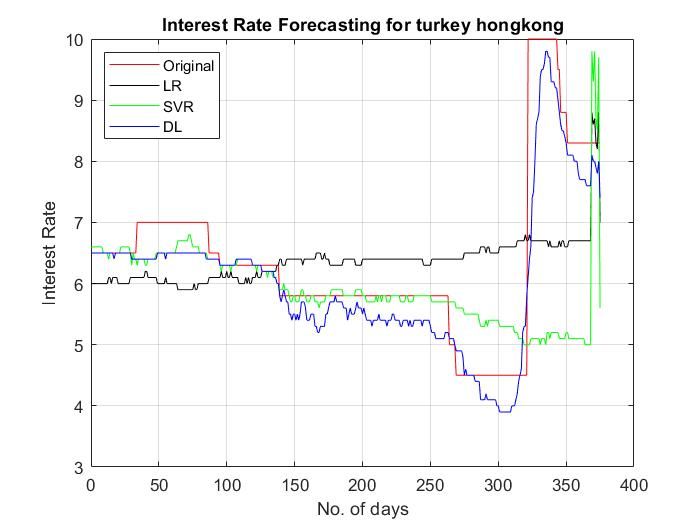
Sustainability 2020, 12, 1660 8 of 16
compared to SVR and LR for all the countries except the UK. The results of DL in the case of China and
Hong Kong are approximately 78% accurate as compared to LR. Similarly, DL in the case of Mexico
and Turkey yields approximately 64.5% and 52.1% better results as compared to LR. Both AE and
RMSE provide the same results.
Table 5. The results of the interest rate prediction without sentiments.
Without
Absolute Error (AE) Root Mean Squared Error (RMSE)
Sentiment
Linear Support Vector Linear Support Vector
Countries Deep Learning Deep Learning
Regression Regression Regression Regression
China 0.420 +/− 0.430 0.236 +/− 0.167 0.092 +/− 0.102 0.601 +/− 0.000 0.289 +/− 0.000 0.137 +/− 0.000
Hong Kong 0.029 +/− 0.058 0.020 +/− 0.064 0.006 +/− 0.021 0.064 +/− 0.000 0.067 +/− 0.000 0.022 +/− 0.000
Mexico 0.424 +/− 0.248 0.257 +/− 0.207 0.149 +/− 0.069 0.491 +/− 0.000 0.330 +/− 0.000 0.165 +/− 0.000
Turkey 0.975 +/− 0.864 0.973 +/− 0.874 0.479 +/− 0.406 1.303 +/− 0.000 1.307 +/− 0.000 0.628 +/− 0.000
UK 0.002 +/− 0.001 0.002 +/− 0.001 0.003 +/− 0.002 0.003 +/− 0.000 0.003 +/− 0.000 0.003 +/− 0.000
4.4. Interest Rate Prediction with the Sentiment
In this part, we consider the sentiment of different events as input for the interest rate prediction.
The details of the events is mentioned in Table 2. We processed the textual data of almost 9.6 million
tweets of different events in order to calculate the event sentiment. We used the sentiment of all the
events separately for all the countries as inputs in our data set.
The results of the interest rate prediction of Turkey are presented in Table 6. Our results provide
evidence that the event sentiment is a significant input in predicting the interest rate of Turkey because
the results have significantly improved in the case of all events except Brexit and Ghaza Attack. The
mean error of the DL model has decreased by almost 60% when the event sentiment of Hong Kong
Protest, Mexican Election, Refugees Welcome, and US election are incorporated as inputs. In addition,
the event of the US election stands out as being the most important event because the error of the DL
model has decreased by approximately 90% when we have used the sentiment of the US Election.
Table 6. The results of the interest rate prediction for Turkey with sentiment.
With
Absolute Error (AE) Root Mean Squared Error (RMSE)
Sentiment
Linear Support Vector Linear Support Vector
Turkey Deep Learning Deep Learning
Regression Regression Regression Regression
Brexit 0.975 +/− 0.864 0.972 +/− 0.876 0.467 +/− 0.441 1.303 +/− 0.000 1.308 +/− 0.000 0.642 +/− 0.000
Ghaza Attack 0.990 +/− 1.075 0.776 +/− 1.479 1.236 +/− 0.914 1.462 +/− 0.000 1.670 +/− 0.000 1.537 +/− 0.000
Hong Kong
1.043 +/− 0.837 0.766 +/− 1.328 0.361 +/− 0.423 1.338 +/− 0.000 1.533 +/− 0.000 0.556 +/− 0.000
Protest
Mexican
0.186 +/− 0.150 0.175 +/− 0.167 0.111 +/− 0.102 0.239 +/− 0.000 0.242 +/− 0.000 0.151 +/− 0.000
Election
Refugee
1.035 +/− 0.853 1.013 +/− 0.858 0.233 +/− 0.340 1.342 +/− 0.000 1.328 +/− 0.000 0.412 +/− 0.000
Welcome
US Election 0.143 +/− 0.138 0.141 +/− 0.160 0.039 +/− 0.053 0.199 +/− 0.000 0.213 +/− 0.000 0.066 +/− 0.000
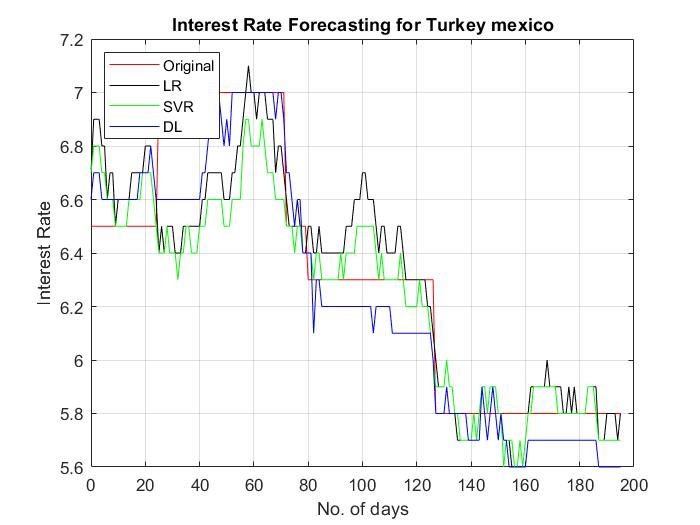
Figure 2 shows the plot of 500 actual and forecasted values of the interest rate of Turkey when we
incorporated the event sentiment of Brexit and Refugees Welcome as input in the LR, SVR, and DL
models. The graph shows that the forecasted values of the DL model are close to their actual values as
compared to LR and SVM.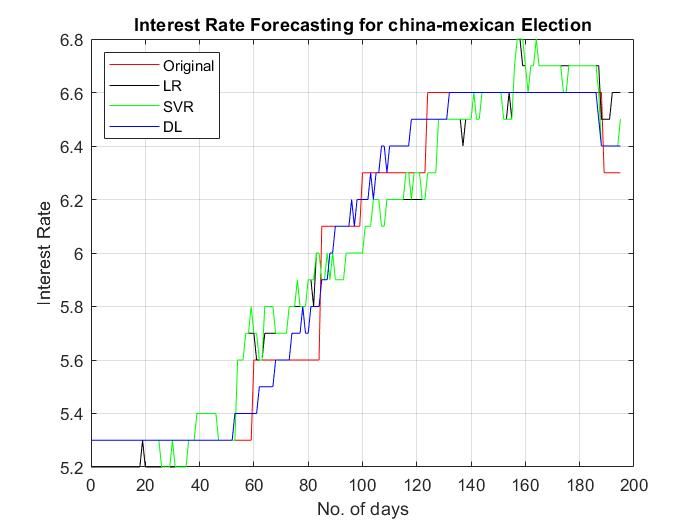
Sustainability 2020, 12, 1660 9 of 16
Sustainability
Sustainability2020,
2020,12,
12,1660
1660 99of
of16
16
Thespread
spreadshows
showsthe
therandom
random predicted
Figure2.2.The
Figure
Figure 2. The spread shows the randompredicted
predictedvalues
valuesfor
values fororiginal,
fororiginal,LR,
original,LR,SVM,
LR,SVM,and
SVM, DLDL
and
and forfor
DL thethe
for interest
the interest
interest
rate
rate ofof Turkey
Turkey using
using the
the event
event sentiments
sentiments of
ofBrexit
Brexitand
andRefugees
Refugees Welcome.
Welcome.
rate of Turkey using the event sentiments of Brexit and Refugees Welcome.
Figure 3 shows the plot of 200 actual and forecasted values of the interest rate of Turkey when we
Figure
Figure 33 shows
shows the
the plot
plot of
of 200
200 actual
actual and
and forecasted
forecasted values
values of
of the
the interest
interest rate
rate of
of Turkey
Turkey when
when
incorporated the event sentiment of US election and Mexican election as input in the LR, SVR, and DL
we
we incorporated
incorporated the event sentiment of US election and Mexican election as input in the LR, SVR,
models. The graphthe event
shows thatsentiment of US
the forecasted election
values of the and Mexican
DL model election
are close as actual
to their inputvalues
in theas LR,
and
SVR,DL models.
and DL The graph
models. The showsshows
graph that the forecasted values of the DL model are close to their actual
compared to LR and SVM.
values as compared to LR and SVM.
Figure
Figure3.
Figure 3.3.The
Thespread
The spreadshows
spread showsthe
shows therandom
randompredicted
random values
predictedvalues
predicted for
valuesfor
fororiginal,
original,
original, LR,
LR,
LR, SVM,
SVM,
SVM, and
and DLDL
and forfor
DL thethe
for the interest
interest
interest
rate of
rate Turkey
of Turkey
rate of Turkey using
using the
the event
event sentiments
sentiments of
of US
US Election
Election and
and Mexico
Mexico Election.
Election.
the event sentiments of US Election and Mexico Election.
Figure444shows
Figure
Figure showsthe
shows theplot
the plot of
plot of
of 400
400 actual
actualand
andforecasted
and forecastedvalues
forecasted values
valuesofof
the
of theinterest
the interestrate
interest of of
rate
rate Turkey when
of Turkey
Turkey when
when
weweincorporated
incorporatedthe theevents
events of
of Hong
Hong Kong
Kong Protest
Protest and
and Ghaza
Ghaza Attack
Attack asas
input
inputin in
thethe
LR,LR,
SVR,
SVR,andand
DLDL
we incorporated the events of Hong Kong Protest and Ghaza Attack as input in the LR, SVR, and DL
models. Thegraph
models. graph shows that the forecasted values of the SVM SVM
and DL models are close to their actual
models. TheThe graph shows
shows that
that the
the forecasted
forecasted values
values of
of the
the SVM andand DLDL models
models are are close
close to
to their
their
values
actual as compared
values as to
comparedLR. to LR.
actual values as compared to LR.
The results of the interest rate prediction of China are presented in Table 7. Our results provide
evidence that event sentiment is a significant input in predicting the interest rate of China because the
results have significantly improved in the case of all events except Refugees Welcome. The mean error
of the DL model has decreased by almost 34% when the event sentiment of Brexit, Ghaza Attack, Hong
Kong Protest, Mexican Election, and US election are incorporated as inputs.
Figure
Figure4.4.The
Thespread
spreadshows
showsthe
therandom
randompredicted
predictedvalues
valuesfor
fororiginal,
original,LR,
LR,SVM,
SVM,and
andDLDLfor
forthe
theinterest
interest
rate of Turkey using the event sentiments of Hong Kong Protest and Ghaza Attack.
rate of Turkey using the event sentiments of Hong Kong Protest and Ghaza Attack.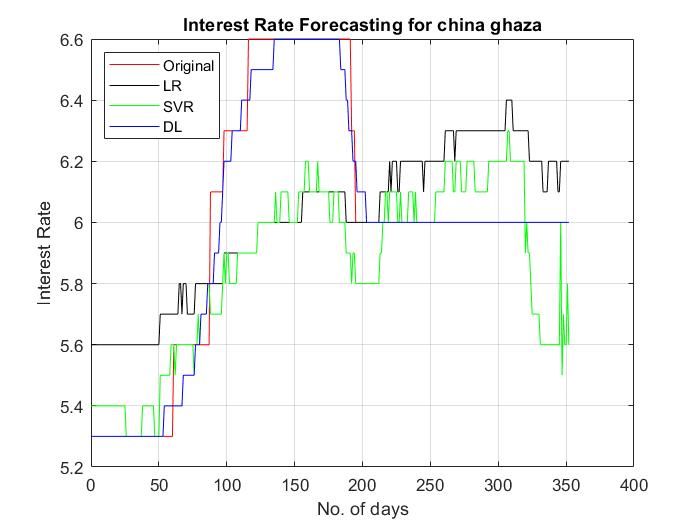
Figure 3. The spread shows the random predicted values for original, LR, SVM, and DL for the interest
rate of Turkey using the event sentiments of US Election and Mexico Election.
Figure 4 shows the plot of 400 actual and forecasted values of the interest rate of Turkey when
we incorporated the events of Hong Kong Protest and Ghaza Attack as input in the LR, SVR, and DL
Sustainability 2020, 12, 1660 10 of 16
models. The graph shows that the forecasted values of the SVM and DL models are close to their
actual values as compared to LR.
Sustainability 2020, 12, 1660 10 of 16
The results of the interest rate prediction of China are presented in Table 7. Our results provide
evidence that event sentiment is a significant input in predicting the interest rate of China because
the results have significantly improved in the case of all events except Refugees Welcome. The mean
error of the DL model has decreased by almost 34% when the event sentiment of Brexit, Ghaza Attack,
Hong Kong Protest, Mexican Election, and US election are incorporated as inputs.
Table 7. The results of the interest rate prediction for China with event sentiment.
With
Figure4.4. The
Figure The spread
spread shows
shows the
the random
Absolute Errorpredicted
random predicted
(AE) values
valuesforfororiginal, LR,
LR,SVM,
original,Root Meanand
SVM, and DL
DLfor
Squared the
theinterest
forError interest
(RMSE)
Sentiment
rate
rateofofTurkey
Turkeyusing
usingthe
theevent
eventsentiments
sentimentsofofHong
HongKong
KongProtest
Protestand
andGhaza
GhazaAttack.
Attack.
Linear Support Vector Deep Linear Support Vector Deep
China
Regression Regression Learning Regression Regression
Table 7. The results of the interest rate prediction for China with event sentiment. Learning
0.385 +/− 0.098 +/− 0.562 +/− 0.139 +/−
Brexit
With 0.235 +/− 0.159 0.284 +/− 0.000
0.409 Absolute Error (AE) 0.098 0.000
Root Mean Squared Error (RMSE) 0.000
Sentiment
0.305 +/− 0.050 +/− 0.348 +/− 0.070 +/−
Ghaza Attack Linear 0.256 Vector
Support +/− 0.207 Deep Linear Support0.330 +/− 0.000
Vector
China 0.166
Regression Regression 0.049
Learning 0.000
Regression Regression
Deep Learning0.000
Hong Kong 0.302 +/− 0.072 +/− 0.348 +/− 0.087 +/−
Brexit 0.385 +/− 0.409 0.235 +/−+/−
0.256 0.2560.098 +/− 0.098 0.562 +/− 0.000 0.284 +/−
0.159 0.362 0.139 +/− 0.000
+/− 0.000
0.000
Protest
Ghaza Attack 0.3050.173
+/− 0.166 0.256 +/− 0.207 0.050 +/−0.0480.049 0.348 +/−0.000
0.000 0.330 +/− 0.000 0.000
0.070 +/− 0.000
Mexican
Hong Kong 0.117 +/− 0.052 +/− 0.144 +/− 0.075 +/−
0.302 +/− 0.173 0.256 +/−+/−
0.104 0.0910.072 +/− 0.048 0.348 +/− 0.000 0.362 +/−
0.256 0.138 0.087 +/− 0.000
+/− 0.000
0.000
Protest
Election 0.084 0.053 0.000 0.000
Mexican
Refugee +/−+/−
0.327
0.117 0.084 0.104 +/− 0.091 0.052 +/− 0.156 +/− 0.144 +/−
0.053 0.451 +/− 0.138 +/− 0.000
0.000 0.075 +/− 0.000
0.242 +/−
Election 0.405 +/− 0.433 0.593 +/− 0.000
Welcome
Refugee 0.311 0.185 0.000 0.000
0.327 +/− 0.311 0.405 +/− 0.433 0.156 +/− 0.185 0.451 +/− 0.000 0.593 +/− 0.000 0.242 +/− 0.000
Welcome 0.180 +/− 0.066 +/− 0.238 +/− 0.086 +/−
US
USElection
Election 0.138
+/− 0.156 0.138
0.1800.156 +/−+/− 0.1280.066 +/− 0.056 0.238 +/− 0.000 0.189 +/−
0.128 0.189 +/− 0.000
0.000 0.086 +/− 0.000
0.056 0.000 0.000
Figure
Figure 5 shows
5 shows theplot
the plotofof200
200actual
actualand
andforecasted
forecasted values
values ofofthe
theinterest
interest rate
rate ofofChina
Chinawhen
whenwe we
incorporated
incorporated the
the events
events ofof theUS
the USElection
Electionand
andMexican
MexicanElection
Electionasasinput
inputininLR,
LR,SVM,
SVM,and andDLDLmodels.
models.
The
The graph
graph shows
shows that
that the
the forecasted
forecasted values
values ofof
thethe SVM
SVM and
and DLDL modelare
model are close
close tototheir
theiractual
actualvalues
values
asascompared
compared toto
LR.LR.
Figure
Figure5.5.The
Thespread
spreadshows
showsthe
therandom
randompredicted
predictedvalues forfor
values original, LR,
original, SVM,
LR, SVM,and DL
and forfor
DL the interest
the interest
rate ofof
rate China
China using the
using event
the sentiments
event sentimentsofof
USUSElection and
Election and Mexican
Mexican Election.
Election.
Figure
Figure6 6shows
showsthe
theplot
plotof
of400
400 actual
actual and forecasted values
and forecasted valuesof
ofthe
theinterest
interestrate
rateofofChina
Chinawhen
when we
we incorporated the events of Hong Kong Protest and Ghaza Attack as input in LR, SVR,
incorporated the events of Hong Kong Protest and Ghaza Attack as input in LR, SVR, and DL models. and DL
models. The graph
The graph showsshows thatforecasted
that the the forecasted values
values of the
of the DLDL modelare
model areclose
close to
to their
their actual
actualvalues
valuesasas
compared
compared toto
LR.LR.Sustainability 2020,
Sustainability 12,12,
2020, 1660
1660 1111
ofof
1616
Sustainability 2020, 12, 1660 11 of 16
Figure 6. The spread shows the random predicted values for original, LR, SVM, and DL for the interest
Figure
Figure 6. 6.
TheThe spread
spread shows
shows thethe random
random predicted
predicted values
values forfor original,
original, LR,LR, SVM,
SVM, and
and DLDL
forfor
thethe interest
interest
rate of China using the event sentiments of Hong Kong Protest and Ghaza Attack.
rate
rate of of China
China using
using thethe event
event sentiments
sentiments of of Hong
Hong Kong
Kong Protest
Protest andand Ghaza
Ghaza Attack.
Attack.
Figure7 7shows
Figure showsthe
theplot
plotofof500
500actual
actualand
andforecasted
forecastedvalues
valuesofofthe
theinterest
interestrate
rateofofChina
Chinawhen
whenwewe
Figure 7 shows the plot of 500 actual and forecasted values of the interest rate of China when we
incorporated
incorporated the
thetheevents
events of
of ofBrexit
Brexit and
and Refugee
Refugee as
as as input
input in
in in LR,
LR, SVR,
SVR, and
and DL
DLDL models.
models. The
The graph
graph shows
shows
incorporated events Brexit and Refugee input LR, SVR, and models. The graph shows
that
that the
thethe forecasted
forecasted values
values of
of the the
SVMSVM and
andand DL models
DL models are close
are close to
to their their
actualactual values
values as compared
as compared to LR.to
that forecasted values of the SVM DL models are close to their actual values as compared to
LR.
LR.
Figure7.7.The
Figure Thespread
spreadshows
showsthe
therandom
randompredicted
predictedvalues for
values fororiginal,
original,LR,
LR,SVM,
SVM,and
andDL
DLfor
forthe
theinterest
interest
Figure 7. The spread shows the random predicted values for original, LR, SVM, and DL for the interest
rate
rateofofChina
Chinausing
usingthe event
the sentiments
event ofof
sentiments Brexit and
Brexit andRefugees
Refugees Welcome.
Welcome.
rate of China using the event sentiments of Brexit and Refugees Welcome.
The
Theresults
resultsofofthe
theinterest
interestrate
rateprediction
predictionofofthe theUK UKare arepresented
presentedininTable Table8.8.Our
Ourresults
resultsprovide
provide
evidence The results ofsentiment
the interest rate prediction of the UK are presented inrate
Table 8. Our results provide
evidence that event sentiment is a significant input to predict the interest rate of the UKbecause
that event is a significant input to predict the interest of the UK becausethe the
evidence
results have that event sentiment
significantly improved is in
a significant
the case of input
the to predict
Mexican the interest
election and US rate of theThe
election. UKmean
because
errorthe
results have significantly improved in the case of the Mexican election and US election. The mean
results
oferror
the DL have
model significantly improved in the case of the Mexican election and US election. The mean
of the DLhas decreased
model by almost
has decreased by33% when
almost 33% thewhen
eventthe sentiment of Mexican
event sentiment of Election
Mexicanand US
Election
error
Election of the DL model has decreased by almost 33% when the event sentiment of Mexican Election
and USare incorporated
Election as inputs. as
are incorporated However, the interest
inputs. However, rate
the of therate
interest UK of remains
the UKinsensitive towards
remains insensitive
andthe
both USlocal
Election
event are
of incorporated
Brexit and as inputs.
global events However,
like the Ghazathe Attack,
interestHong
rate ofKongthe UK remains
Protest and insensitive
Refugees
towards both the local event of Brexit and global events like the Ghaza Attack, Hong Kong Protest
towards These
Welcome. both the localendorsed
results event of the Brexit
factandthatglobal events like
the economy theUK
of the Ghaza Attack, Hong
is relatively KongtoProtest
insensitive the
and Refugees Welcome. These results endorsed the fact that the economy of the UK is relatively
and
events Refugees
(Brexit,toHongWelcome. These
Kong Protest) results endorsed the fact that the economy of the UK is relatively
insensitive the events (Brexit,thatHong are Kong
significant
Protest)for the
thatinterest rate of emerging
are significant for the economies
interest ratelikeof
insensitive
China, Turkey, toandtheHong
events (Brexit, Hong Kong Protest) that are significant for the interest rate of
Kong.
emerging economies like China, Turkey, and Hong Kong.
emerging
When economies like China, Turkey, and Hong Kong.
Whenwe weincorporated
incorporatedthe theevent
eventsentiment
sentimentofofallallthe theevents
eventstotoplotplotthethegraph
graphofofforecasted
forecastedand and
actual When
values, we
thereincorporated
was no the
fluctuation eventin sentiment
the spread of all
because the events
there was to noplot the graph
significant of forecasted
variation or trendand
actual values, there was no fluctuation in the spread because there was no significant variation or
actual
intrend
the datavalues,
of the there was no fluctuation in the spread because there was no significant variation or
in the datainterest rate of the
of the interest rateUK. Therefore,
of the the graph
UK. Therefore, theisgraph
not shown
is nothere.
shown here.
trend
The in the data of the interest rate of the UK. Therefore, the graph in is not shown here.
Theresults
resultsofofthe
theinterest
interestrate
rateprediction
predictionofofMexico
Mexicoare arepresented
presented inTable Table9.9.Our
Ourresults
resultsprovide
provide
evidence The results of the interest rate prediction of Mexico are presented in Table 9. Our results provide
evidence that event sentiment is a significant input to predict the interest rate of Turkeybecause
that event sentiment is a significant input to predict the interest rate of Turkey becausethe the
evidence that
results event sentiment is a significant input to predictThe the interest rate of Turkey because the
resultshave
havesignificantly
significantlyimproved
improvedininthe thecase
caseofofallallevents.
events. Themean meanerror errorofofthetheDLDLmodel
modelhas has
results
decreased have
byby significantly
almost 74%74% improved
whenwhenthe event in the case
sentiment of all events.
of HongofKong The mean
Protest, error of the DL model has
decreased almost the event sentiment Hong KongMexican
Protest,Election,
MexicanRefugees
Election,
decreased
Welcome, byUS almost 74% when the event as sentiment of addition,
Hong Kong Protest, Mexican Election,
Refugees Welcome, and US Election were incorporated as inputs. In addition, thethe
and Election were incorporated inputs. In the event of US of
event election
the US
Refugees
stands Welcome,
outstands
as being and USimportant
Election were incorporated the as inputs. In addition, the
has event of the US
election outtheasmost
being the mostevent because
important event error
because of the
theDL model
error of the decreased
DL model by has
election stands
approximately out when
98.65% as beingwe the most
have used important
the sentiment event
of USbecause
Election. the error of the DL model has
decreased by approximately 98.65% when we have used the sentiment of US Election.
decreased by approximately 98.65% when we have used the sentiment of US Election.With
Absolute Error (AE) Root Mean Squared Error (RMSE)
Sentiment
Linear Support Vector Deep Linear Support Vector Deep
UK
Regression Regression Learning Regression Regression Learning
0.002 +/− 0.003 +/− 0.003 +/− 0.003 +/−
Brexit 2020, 12, 1660
Sustainability 0.002 +/− 0.001 0.003 +/− 0.000 12 of 16
0.001 0.002 0.000 0.000
0.002 +/− 0.003 +/− 0.003 +/− 0.003 +/−
Ghaza Attack 0.002 +/− 0.001 0.003 +/− 0.000
Table 0.001 0.002 for the 0.000
8. The results of the interest rate prediction UK with event sentiment. 0.000
Hong Kong 0.002 +/− 0.003 +/− 0.003 +/− 0.003 +/−
0.002 +/− 0.001 0.003 +/− 0.000
Protest
With 0.001 0.002 0.000 0.000
Absolute Error (AE) Root Mean Squared Error (RMSE)
Sentiment
Mexican 0.002 +/− 0.002 +/− 0.003 +/− 0.003 +/−
0.002 +/− 0.001 0.003 +/− 0.000
Election
UK 0.001
Linear Support Vector 0.001
Deep Learning 0.000
Linear Support Vector 0.000
Deep Learning
Refugee Regression
0.002 +/− Regression 0.003 +/− Regression
0.003 +/− Regression 0.003 +/−
Brexit 0.002 +/− 0.001 0.002
0.002+/−
+/− 0.001 0.003 +/− 0.002 0.003 +/− 0.000 0.003 +/−
0.001 0.003 0.003 +/− 0.000
+/− 0.000
0.000
Welcome
Ghaza Attack
0.001 0.002 0.000
0.002 +/− 0.001 0.002 +/− 0.001 0.003 +/− 0.002 0.003 +/− 0.000 0.003 +/− 0.000
0.000
0.003 +/− 0.000
Hong Kong 0.002 +/− 0.002 +/− 0.003 +/− 0.003 +/−
US Election 0.002 +/− 0.001 0.002
0.002+/−
+/− 0.001 0.003 +/− 0.002 0.003 +/− 0.000 0.003 +/−
0.001 0.003 0.003 +/− 0.000
+/− 0.000
0.000
Protest 0.001 0.002 0.000 0.000
Mexican
0.002 +/− 0.001 0.002 +/− 0.001 0.002 +/− 0.001 0.003 +/− 0.000 0.003 +/− 0.000 0.003 +/− 0.000
Election
Refugee Table 9. The results of the interest rate prediction for Mexico with event sentiment.
0.002 +/− 0.001 0.002 +/− 0.001 0.003 +/− 0.002 0.003 +/− 0.000 0.003 +/− 0.000 0.003 +/− 0.000
Welcome
With
US Election 0.002 +/− 0.001 Absolute
0.002 +/−Error 0.002 +/− 0.002
0.001 (AE) 0.003 +/− 0.000Mean +/− 0.000Error
0.003Squared 0.003 +/− 0.000
Root (RMSE)
Sentiment
Linear Support Vector Deep Linear Support Vector Deep
Mexico Table 9. The results of the interest rate prediction for Mexico with event sentiment.
Regression Regression Learning Regression Regression Learning
With 0.394 +/− 0.082 +/− 0.471 +/− 0.109 +/−
Brexit Absolute
0.231Error (AE)
+/− 0.171 Root Mean Squared Error
0.287 +/− (RMSE)
0.000
Sentiment 0.259 0.072 0.000 0.000
Ghaza
Mexico 0.332 +/−
Linear Support Vector 0.054 +/− 0.401 +/−
Linear Support Vector 0.088 +/−
Regression 0.202 +/− 0.156Deep Learning
Regression Regression 0.255 +/− 0.000
Regression
Deep Learning
Attack 0.225 0.070 0.000 0.000
Brexit 0.394 +/− 0.259 0.231 +/− 0.171 0.082 +/− 0.072 0.471 +/− 0.000 0.287 +/− 0.000 0.109 +/− 0.000
HongAttack
Ghaza Kong 0.3320.383 +/−
+/− 0.225 0.202 +/− 0.156 0.054 0.040
+/− +/− 0.401 0.460
0.070 +/− +/− 0.255 +/− 0.000 0.088 +/−
0.000 0.069 +/−
0.000
0.220 +/− 0.181 0.285 +/− 0.000
Protest
Hong Kong 0.254 0.056 0.000 0.000
0.383 +/− 0.254 0.220 +/− 0.181 0.040 +/− 0.056 0.460 +/− 0.000 0.285 +/− 0.000 0.069 +/− 0.000
Protest
Mexican 0.002 +/− 0.003 +/− 0.003 +/− 0.003 +/−
Mexican 0.002 +/− 0.001 0.003 +/− 0.000
Election +/− 0.001 0.002 +/− 0.001 0.003 +/−
0.002 0.001 0.002 0.003 +/−
0.002 0.000 0.003 +/− 0.000
0.000 0.003 +/−0.000
0.000
Election
Refugee
Refugee 0.405 +/− 0.052 +/− 0.484 +/− 0.086 +/−
0.226
0.405 +/− 0.265 0.226 +/−+/− 0.1980.052 +/− 0.068 0.484 +/− 0.000 0.3000.300
0.198 +/− 0.000
+/− 0.000 0.086 +/− 0.000
Welcome
Welcome 0.265 0.068 0.000 0.000
US Election 0.002 +/− 0.001
0.002 +/− 0.002 +/− 0.001 0.002 +/− 0.002
0.002 +/− 0.003 +/− 0.000
0.003 +/− 0.003 +/− 0.000 0.003 +/− 0.000
0.003 +/−
US Election 0.002 +/− 0.001 0.003 +/− 0.000
0.001 0.002 0.000 0.000
Figure 8 shows the plot of 500 actual and forecasted values of the interest rate of Mexico when we
Figure 8the
incorporated shows theofplot
events of 500
Refugee actual and
Welcome andforecasted values
Brexit as input in of
thethe
LR,interest rateDL
SVM, and of Mexico
models.when
The
we incorporated the events of Refugee Welcome and Brexit as input in the LR, SVM, and DL
graph shows that the forecasted values of the SVM and DL models are close to their actual values as models.
The graphtoshows
compared LR. that the forecasted values of the SVM and DL models are close to their actual values
as compared to LR.
Figure8.8.The
Figure Thespread
spreadshows
showsthe
therandom
randompredicted
predictedvalues
valuesfor
fororiginal,
original,LR,
LR,SVM,
SVM,and
andDL
DLfor
forthe
theinterest
interest
rate
rateofofMexico
Mexicousing
usingthe
theevent
eventsentiments
sentimentsofofRefugees
RefugeesWelcome
Welcomeand andBrexit.
Brexit.
Figure 9 shows the plot of 400 actual and forecasted values of the interest rate of Mexico when we
incorporated the events of Hong Kong Protest and Ghaza as input in the LR, SVM, and DL models. The
graph shows that the forecasted values of the DL model are close to their actual values as compared to
SVM and LR.Sustainability 2020, 12, 1660 13 of 16
Figure 9 shows the plot of 400 actual and forecasted values of the interest rate of Mexico when
we incorporated the events of Hong Kong Protest and Ghaza as input in the LR, SVM, and DL models.
Sustainability 2020, 12, 1660 13 of 16
The graph shows that the forecasted values of the DL model are close to their actual values as
compared to SVM and LR.
Figure9.9.The
Figure Thespread
spreadshows
showsthetherandom
randompredicted
predictedvalues
valuesfor
fororiginal,
original,LR,
LR,SVM,
SVM,and
andDL
DLfor
forthe
theinterest
interest
rateofofMexico
rate Mexicousing
usingthe
theevent
eventsentiments
sentimentsofofHong
HongKong
KongProtest
Protestand
andGhaza
GhazaAttack.
Attack.
When
Whenwe weincorporated
incorporatedthe theevent
eventsentiment
sentimentofofthe
theUS
USelection
electionand
andMexico
Mexicoelection
electiontotoplot
plotthe
the
graph, we could not see any fluctuation in the spread because there was no significant variation
graph, we could not see any fluctuation in the spread because there was no significant variation or or trend
intrend
the data of data
in the the interest rate of Mexico.
of the interest Therefore,
rate of Mexico. the graph
Therefore, theof theseoftwo
graph events
these two is not shown
events here.
is not shown
The results of the interest rate prediction of Hong Kong are presented in Table 10. Our results
here.
provide evidence
The results that event
of the sentiment
interest is a significant
rate prediction input
of Hong to predict
Kong the interest
are presented rate of
in Table 10.Hong
Our Kong
results
because the results have significantly improved in the case of all the events except Brexit.
provide evidence that event sentiment is a significant input to predict the interest rate of Hong The mean
Kong
error of the
because theDL model
results havehas decreased improved
significantly by almost in266% when
the case of event
all thesentiments were
events except incorporated
Brexit. The mean
aserror
inputs.
of the DL model has decreased by almost 266% when event sentiments were incorporated as
inputs.
Table 10. The results of the interest rate prediction for Hong Kong with event sentiment.
With Table 10. The results of the interest rate prediction for Hong Kong with event sentiment.
Absolute Error (AE) Root Mean Squared Error (RMSE)
Sentiment
With
Linear Absolute
SupportError
Vector(AE) Linear Root Mean
SupportSquared
Vector Error (RMSE)
Hong Kong
Sentiment Deep Learning Deep Learning
Regression Regression Regression Regression
Brexit 0.016 +/− 0.046 0.013
Linear +/− 0.048
Support Vector0.007 +/−Deep
0.023 0.049 +/− 0.000 0.050 +/−
Linear Support 0.024 +/− 0.000
0.000 Vector Deep
Hong Kong
Ghaza Attack 0.002 +/− 0.001 0.002 +/− 0.001 0.003 +/− 0.002 0.003 +/− 0.000 0.003 +/− 0.000 0.003 +/− 0.000
Regression Regression Learning Regression Regression Learning
Hong Kong
0.016+/−
0.002 0.002 +/− 0.001 0.002 +/−
+/−0.001 0.007 +/− 0.003 +/−
0.001 0.049 +/− 0.003 +/− 0.000 0.003 +/− 0.000
0.000 0.024 +/−
Protest
Brexit 0.013 +/− 0.048 0.050 +/− 0.000
Mexican 0.046 0.023 0.000 0.000
0.002 +/− 0.001 0.002 +/− 0.001 0.002 +/− 0.001 0.003 +/− 0.000 0.003 +/− 0.000 0.003 +/− 0.000
Election 0.002 +/− 0.003 +/− 0.003 +/− 0.003 +/−
GhazaRefugee
Attack 0.002 +/− 0.001 0.003 +/− 0.000
0.001
0.003 +/− 0.001 0.003 +/− 0.001 0.003 +/−0.002 0.002 0.003 +/−0.000
0.000 0.003 +/− 0.000 0.000
0.004 +/− 0.000
Welcome
Hong
US Kong 0.002 +/−
0.002 +/− 0.001 0.002 +/− 0.002 +/− 0.003 +/− 0.003 +/− 0.000 +/−
0.003
Election 0.002 0.001 0.003 +/− 0.001 0.003 +/− 0.000 0.003 +/−
+/−0.001 0.000
0.003 +/− 0.000
Protest 0.001 0.001 0.000 0.000
Mexican 0.002 +/− 0.002 +/− 0.003 +/− 0.003 +/−
When we incorporated the0.002
event+/− sentiment
0.001 of0.001
all the events0.000 0.003 +/−
to plot the graph of0.000
forecasted 0.000
and
Election 0.001
actual values,
Refugee we could
0.003 +/−not see any fluctuation in the spread
0.003 +/− because there
0.003 +/− was no significant variation
0.004 +/−
0.003 +/− 0.001 0.003 +/− 0.000
orWelcome
trend in the data0.001
of the interest rate of Hong Kong. 0.002Therefore,0.000
the graph is not shown here. 0.000
0.002 +/− 0.003 +/− 0.003 +/− 0.003 +/−
US Election 0.002 +/− 0.001 0.003 +/− 0.000
5. Conclusions 0.001 0.001 0.000 0.000
This research study demonstrates the deep learning technique to predict the interest rate of the
When we incorporated the event sentiment of all the events to plot the graph of forecasted and
UK, Turkey, China, Hong Kong, and Mexico. We used the daily data of the interest rate, ranging
actual values, we could not see any fluctuation in the spread because there was no significant
from 1st of Jan 2010 to 23rd of Oct 2019. The exchange rate of the relevant country and twitter-based
variation or trend in the data of the interest rate of Hong Kong. Therefore, the graph is not shown
sentiment of some mega-events like the US election 2012, Mexican election 2012, Gaza under attack
here.
2014, Hong Kong protest 2014, Refugee Welcome 2015, and Brexit 2016 were used as input parameters
of the model. We calculated the sentiment using the twitter dataset of almost 9.6 million tweets in
response to these six mega-events. Our results suggest that the deep learning model outperforms the
support vector model and linear regression. Furthermore, the events sentiment has improved the
predictive power of the deep learning model. Since the interest rate is highly volatile and complex in
nature, it is also responsive towards mega-events happening across the globe. Therefore, we argueSustainability 2020, 12, 1660 14 of 16
that the interest rate is sensitive towards the social media response of investors, which may also affect
financial inclusion in the economy. Therefore, the social media sentiment can be used along with deep
learning models to improve the performance of financial predictions, as these time series data are
dependent on general opinion. These models can be further extended to design intelligent business
plans which can guide investors to invest and gain maximum profit. Moreover, these results are also
useful for policymakers when implementing monetary policy because the interest rate is one of the
major tools for managing money supply in the economy.
Author Contributions: Data curation, M.Y., G.M.C., N.Y.M.; Formal analysis, M.Y., K.L.; Investigation,
S.A.; Methodology, M.Y., S.A., G.M.C., F.S., O.-y.S.; Visualization, F.S.; Writing—original draft, M.Y., N.Y.M.;
Writing—review & editing, K.L., O.-y.S. All authors have read and agreed to the published version of the manuscript.
Funding: This work was supported in part by the MSIT (Ministry of Science and ICT), South Korea, through the
Information Technology Research Center (ITRC) Support Program supervised by the Institute for Information &
Communications Technology Planning & Evaluation (IITP) under Grant IITP-2020-2016-0-00312, and in part by
the Faculty Research Fund of Sejong University in 2019.
Conflicts of Interest: The authors declare no conflict of interest.
References
1. D’Amico, G.; Petroni, F.; Prattico, F. First and second order semi-Markov chains for wind speed modeling.
Phys. A Stat. Mech. Its Appl. 2013, 392, 1194–1201. [CrossRef]
2. D’Amico, G.; Petroni, F.; Prattico, F. Wind speed and energy forecasting at different time scales: A
nonparametric approach. Phys. A Stat. Mech. Its Appl. 2014, 406, 59–66. [CrossRef]
3. Sandoval, L., Jr.; Bortoluzzo, A.B.; Venezuela, M.K. Not all that glitters is RMT in the forecasting of risk of
portfolios in the Brazilian stock market. Phys. A Stat. Mech. Its Appl. 2014, 410, 94–109. [CrossRef]
4. Zhang, B.; Wei, Y.; Yu, J.; Lai, X.; Peng, Z. Forecasting VaR and ES of stock index portfolio: A Vine copula
method. Phys. A Stat. Mech. Its Appl. 2014, 416, 112–124. [CrossRef]
5. Lv, X.; Shan, X. Modeling natural gas market volatility using GARCH with different distributions. Phys. A
Stat. Mech. Its Appl. 2013, 392, 5685–5699. [CrossRef]
6. Wei, Y. Forecasting volatility of fuel oil futures in China: GARCH-type, SV or realized volatility models?
Phys. A Stat. Mech. Its Appl. 2012, 391, 5546–5556. [CrossRef]
7. Pincak, R. The string prediction models as invariants of time series in the forex market. Phys. A Stat. Mech.
Its Appl. 2013, 392, 6414–6426. [CrossRef]
8. Binner, J.M.; Tino, P.; Tepper, J.; Anderson, R.; Jones, B.; Kendall, G. Does money matter in inflation
forecasting? Phys. A Stat. Mech. Its Appl. 2010, 389, 4793–4808. [CrossRef]
9. Jilani, T.A.; Burney, S.M.A. A refined fuzzy time series model for stock market forecasting. Phys. A Stat.
Mech. Its Appl. 2008, 387, 2857–2862. [CrossRef]
10. Yamamura, M.; Shoji, I. A nonparametric method of multi-step ahead forecasting in diffusion processes.
Phys. A Stat. Mech. Its Appl. 2010, 389, 2408–2415. [CrossRef]
11. Vasicek, O. An equilibrium characterization of the term structure. J. Financ. Econ. 1977, 5, 177–188. [CrossRef]
12. Black, F.; Karasinski, P. Bond and option pricing when short rates are lognormal. Financ. Anal. J. 1991, 47,
52–59. [CrossRef]
13. Dotsey, M. Monetary policy, secrecy, and federal funds rate behavior. J. Monet. Econ. 1987, 20, 463–474.
[CrossRef]
14. Holston, K.; Laubach, T.; Williams, J.C. Measuring the natural rate of interest: International trends and
determinants. J. Int. Econ. 2017, 108, S59–S75. [CrossRef]
15. Streit, R.E.; Borenstein, D. Design and development of a fuzzy agent-based model to measure interest rate
expectations. Expert Syst. Appl. 2012, 39, 7391–7402. [CrossRef]
16. Hong, T.; Han, I. Knowledge-based data mining of news information on the Internet using cognitive maps
and neural networks. Expert Syst. Appl. 2002, 23, 1–8. [CrossRef]
17. Chevalier, J.A.; Mayzlin, D. The effect of word of mouth on sales: Online book reviews. J. Mark. Res. 2006,
43, 345–354. [CrossRef]You can also read