Crude oil price prediction using CEEMDAN and LSTM-attention with news sentiment index
←
→
Page content transcription
If your browser does not render page correctly, please read the page content below
Oil & Gas Science and Technology – Rev. IFP Energies nouvelles 76, 28 (2021)                                                  Available online at:
Ó Z. Hu, published by IFP Energies nouvelles, 2021                                                                        ogst.ifpenergiesnouvelles.fr
https://doi.org/10.2516/ogst/2021010

 REGULAR ARTICLE

Crude oil price prediction using CEEMDAN and LSTM-attention
with news sentiment index
Zhenda Hu*

School of Information Management and Engineering, Shanghai University of Finance and Economics, Shanghai 200433, PR China

            Received: 27 September 2020 / Accepted: 8 March 2021

            Abstract. Crude oil is one of the most powerful types of energy and the fluctuation of its price influences the
            global economy. Therefore, building a scientific model to accurately predict the price of crude oil is significant
            for investors, governments and researchers. However, the nonlinearity and nonstationarity of crude oil prices
            make it a challenging task for forecasting time series accurately. To handle the issue, this paper proposed a
            novel forecasting approach for crude oil prices that combines Complete Ensemble Empirical Mode Decomposi-
            tion with Adaptive Noise (CEEMDAN), Long Short-Term Memory (LSTM) with attention mechanism and
            addition, following the well-known “decomposition and ensemble” framework. In addition, a news sentiment
            index based on Chinese crude oil news texts was constructed and added to the prediction of crude oil prices.
            And we made full use of attention mechanism to better integrate price series and sentiment series according
            to the characteristics of each component. To validate the performance of the proposed CEEMDAN-
            LSTM_att-ADD, we selected the Mean Absolute Percent Error (MAPE), the Root Mean Squared Error
            (RMSE) and the Diebold-Mariano (DM) statistic as evaluation criterias. Abundant experiments were
            conducted on West Texas Intermediate (WTI) spot crude oil prices. The proposed approach outperformed
            several state-of-the-art methods for forecasting crude oil prices, which proved the effectiveness of the
            CEEMDAN-LSTM_att-ADD with the news sentiment index.

1 Introduction                                                              including financial policy, the price of related financial prod-
                                                                            ucts, news sentiment and public opinions, to better predict
Crude oil is one of the most powerful resources in the world.               the future trend of the original series.
The fluctuation of crude oil price plays an important role in                    For the first direction, a lot of models have been pro-
the development of bulk commodity and global economy                        posed [3–11]. And in recent years, a novel “decomposition
[1]. Under the comprehensive effects of market supply and                   and ensemble” framework has been widely used in time
demand game, US dollar exchange rate, speculative trad-                     series prediction, which can significantly improve the fore-
ing, geographical conflicts, natural disasters and other                     casting accuracy [12]. In this framework, the original
factors, the international crude oil price fluctuates sharply,               sequence is first decomposed into several components, and
which increases the difficulty of crude oil price prediction.                then each component is predicted by a single model.
Therefore, to build a scientific and reasonable model to                     Finally, the several prediction results are integrated to get
accurately predict the trend of international crude oil price               the final prediction result. For the second direction, some
has become a hot and difficult issue in academic circles,                    researchers [13, 14] found that news articles and social
investment circles and political circles.                                   media data were pretty beneficial in financial prediction.
     However, due to the comprehensive effects of factors                   And other research methods proved that crude oil price
mentioned above, the fluctuation of crude oil price presents                 had a significant relationship with different economic indi-
nonstationarity and nonlinearity [2], making the prediction                 cators. Oladosu [15] used Empirical Mode Decomposition
of crude oil price a challenging task. The research of crude                (EMD) method to study the relationship between Gross
oil price forecasting mainly includes two directions. The                   Domestic Product (GDP) of US and crude oil prices. King
first direction is choosing effective models or improving                    et al. [16] found that political events and economic news,
the algorithm to better extract the features of price series                the same as oil supply and demand, played an important
and then predict. The second direction is to find the                        role of oil prices.
external indicators that affect the crude oil prices series,                    In the financial market, information sentiment con-
                                                                            tained in news articles and social media data is an impor-
* Corresponding author: huzhenda2020@gmail.com                              tant index reflecting the sentiment and viewpoint of
This is an Open Access article distributed under the terms of the Creative Commons Attribution License (https://creativecommons.org/licenses/by/4.0),
              which permits unrestricted use, distribution, and reproduction in any medium, provided the original work is properly cited.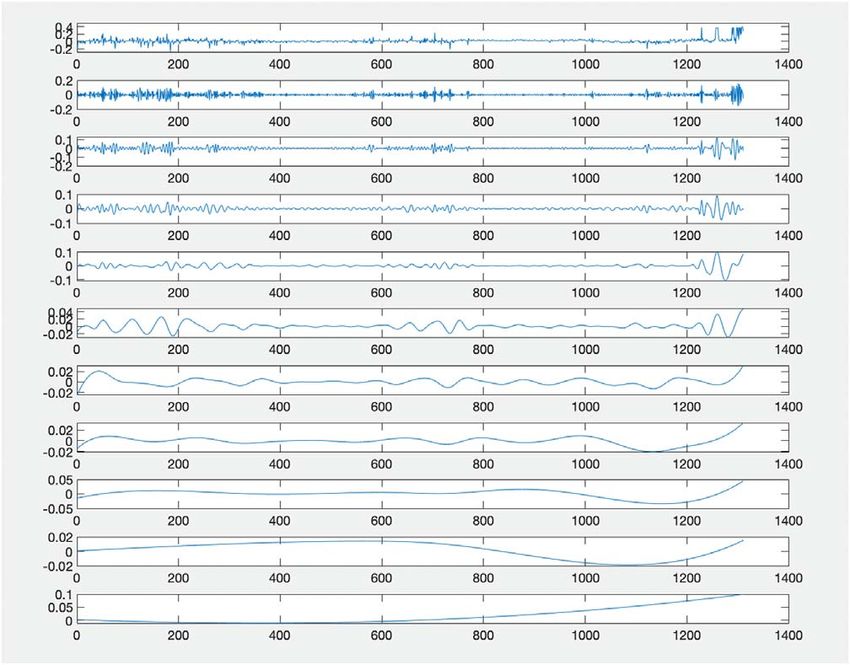
2                     Z. Hu: Oil & Gas Science and Technology – Rev. IFP Energies nouvelles 76, 28 (2021)

investors and traders. The text contents of news include not       January 1992 to June 2008. Yu et al. [6] utilized Least
only the report of facts, but also the intonation of language      Squares Support Vector Regression (LSSVR) model to pre-
and emotion. Therefore, the news describing the fluctuation         dict US WTI crude oil price. And taking gold prices into
of crude oil price reflects the crude oil market situation          consideration in the forecasting, Tang and Zhang [7] built
through texts and influences the investor sentiment through         a multiple wavelet Recurrent Neural Network (RNN)
the way of network communication. However, the consider-           model for crude oil price forecasting. The experimental
ation of these text data makes the analysis of financial            results showed the effectiveness of the model. Zhao et al.
market even more complex [17, 18]. Inspired by this corre-         [8] applied deep neural network model to the price predic-
lation, we quantify crude oil news as a sentiment index and        tion of WTI crude oil and achieved good results. Because
introduce it into crude oil price prediction model.                of the multiple characteristics of the crude oil price series,
     Overall, we combine these two directions mentioned            the mixed model with different models became an effective
above for crude oil price prediction. This paper leads a           choice. Kristjanpoller and Minutolo [9] showed that the
news sentiment index to predict crude oil price more pre-          proposed network approach had ability to improve the pre-
cisely in the framework of “decomposition and ensemble”.           diction results for both spot oil prices and future oil prices.
Concretely, we first construct a crude oil news sentiment           Safari and Davallou [10] proposed a hybrid forecasting
index, which quantifies news text as a numerical index.             model which integrated exponential smoothing model,
Then we decompose the raw crude oil prices series and              ARIMA model and nonlinear autoregressive neural network.
crude oil news sentiment index into several components,                Owing to nonstationarity and nonlinearity of the
respectively, via Complete Ensemble Empirical Mode                 original price series, the family of EMD provides a new
Decomposition with Adaptive Noise (CEEMDAN). Next,                 method for processing time series data. It starts from the
Long Short-Term Memory (LSTM) with attention mecha-                characteristics of data itself and reveals the internal fluctu-
nism is applied to forecasting each prices component with          ation characteristics of data by decomposing the fluctuation
corresponding sentiment component. Finally, the prediction         information of original signal on different scales. Some
values of each component are summed to get the final price          researches [19–23] have demonstrated that it is an effective
prediction value.                                                  time series analysis tool and applied it to price forecasting.
     The main contributions of this paper are as follows: 1) A         For the consideration of text data, many studies have
news sentiment index based on crude oil news texts was             proved the correlation between investor sentiment and
constructed and added to the prediction of crude oil prices.       stock market volatility. Devitt and Ahmad [24] used the
2) This paper proposed a novel forecasting approach for            emotional tendency of financial reviews to predict future
crude oil prices that combines CEEMDAN, LSTM with                  financial trends. Das and Chen [25] proved that there was
attention mechanism and addition, following the well-              a high positive correlation between stock index and online
known “decomposition and ensemble” framework. And we               sentiment analysis using linear regression. Bollen et al.
made full use of attention mechanism to better integrate           [26] tracked the public mood state from the content of huge
price series and sentiment series according to the character-      amount of micro-blog feeds by simple text processing tech-
istics of each component. 3) Abundant experiments were             niques. However, in the field of crude oil market, there are
conducted on West Texas Intermediate (WTI) spot crude              few researches on news sentiment analysis and crude oil
oil prices from US Energy Information Administration               price fluctuation. Lechthaler and Leinert [27] utilized the
(EIA). The proposed approach outperformed several                  VAR model to study the price fluctuation of global crude
state-of-the-art methods for forecasting crude oil prices,         oil market, which showed that news sentiment has an
which proved the effectiveness of the news sentiment index         important influence on the fluctuation of crude oil price.
and attention mechanism.                                           Alfano et al. [28] demonstrated news sentiment not only
                                                                   has an impact on the noise residual of oil, but also on the
                                                                   basic price trend through the regression analysis of news
                                                                   sentiment and oil time series decomposition components.
2 Related work
In recent years, a large number of prediction models have
been proposed. It can be divided into three categories: time       3 Approach
series models, Artificial Intelligence (AI) models and hybrid
prediction models. For the first categories, Abledu and             3.1 The construction of news sentiment index
Agbodah [3] established Autoregressive Integrated Moving           3.1.1 The construction of sentiment dictionary
Average (ARIMA) model to quantitatively predict the
international oil price. Baumeister and Kilian [4] proved          Basic sentiment dictionary
that Vector AutoRegression (VAR) models could have                 This paper uses HowNet Sentiment Dictionary as basic
good performance when forecasting short-term crude oil             dictionary and adds NTUSD Chinese Sentiment Dictionary
prices. Although the time series model can better describe         of Taiwan University of China in order to enrich the
the linear characteristics of crude oil price series, it is hard   vocabulary. To adapt to the field of the news texts, we also
to fit the nonlinear characteristics of crude oil price series.     add common financial sentiment words and related senti-
Therefore, many researchers introduced AI models into oil          ment vocabulary in the field of crude oil. After deleting
price prediction. Shin et al. [5] used neural network model        duplicate words, the final basic sentiment dictionary can
to forecast the monthly price of WTI crude oil from                be obtained.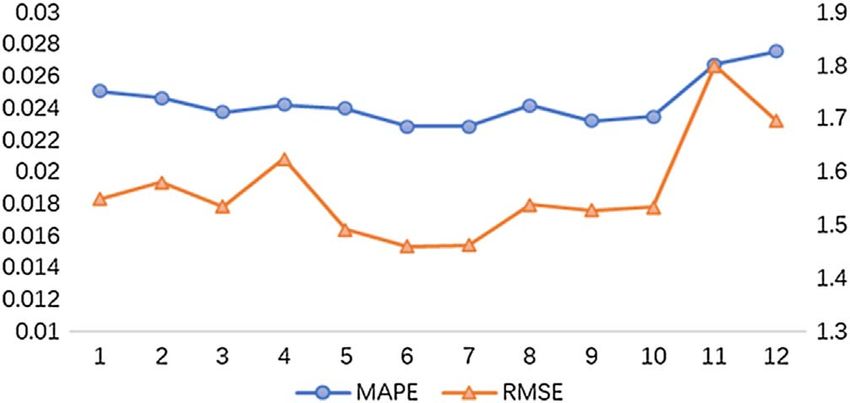
Z. Hu: Oil & Gas Science and Technology – Rev. IFP Energies nouvelles 76, 28 (2021)                             3

Modified dictionary                                                Table 1. Adverbs of degree and the weights.
Next, this paper constructs the modified dictionary which
includes degree level dictionary and the dictionary of nega-      Level Word (English translation)                           Weight
tor. The degree level dictionary consists of adverbs of           Six     Extreme, Extraordinary, Doubly and so on               1.7
degree, transition words and so on with different weights.
According to [29], the weights of adverbs of degree are           Five    Over, Excessive, More than and so on                   1.5
directly from HowNet Dictionary and shown in Table 1.             Four    Especially, Particularly and so on                     1.3
The weights are determined according to the intensity of          Three   Further, More and so on                                1.1
degree adverbs. The weights defined in HowNet Dictionary           Two     A little, slightly and so on                           0.9
are widely used in Chinese sentiment analysis [30, 31]. Level     One     Relatively, Not much and so on                         0.7
One and Level Two represent emotional decline so we set
the value less than 1. And from Level Three to Level Six,         The calculation of daily news sentiment index
the words represent emotional enhancement so we set the           We can get the final emotional value by summing all the
value more than 1. The weight difference of each level is         sentiment words in the news. The summing formula is rep-
set to 0.2. The detailed weight distribution is shown in          resented as equation (1):
Table 1.                                                                                          X
                                                                                                  n1
    In addition, the dictionary of negator includes all                       article sentiment ¼    w i ðw i > 0Þ;    ð1Þ
negative words, such as never, no, shouldn’t, don’t, won’t                                               i¼1
and so on.
                                                                  where article_sentiment represents the sentiment score of
3.1.2 The calculation of weighted sentiment series                each news, n1 represents the number of sentiment words
                                                                  in each news. And then, we can obtain the sentiment score
Combined with the characteristics of international crude oil      of crude oil news in each trading day by averaging the sen-
news and financial news, this paper designs the relevant           timent scores of all crude oil news in the day. The formula
news sentiment analysis rules. The contents of news               is represented as equation (2):
sentiment analysis are as follows:
                                                                                                 X
                                                                                                 Z
                                                                          daily sentiment ¼            article sentimenti =Z ;     ð2Þ
The score and weights of sentiment words                                                         i¼1
After text segmentation, we utilize the basic sentiment dic-
tionary to conduct sentiment analysis. We set the score of        where daily_sentiment represents the sentiment score of
positive sentiment words as 1 (Wp = 1) and the score of           each trading day, Z represents the number of articles in
negative sentiment words as 1 (Wn = 1).                         that day.
    In addition, in order to distinguish the importance of           Through the above calculation of sentiment scores for
different sentiment words, we use TFIDF (Term                     crude oil news, we get the Chinese news sentiment index.
Frequency–Inverse Document Frequency) value as the
weight of each sentiment word. TFIDF is used to evaluate          3.2 The proposed CEEMDAN-LSTM_att-ADD
the importance of a word in a document. If a word or phrase           with news sentiment index
appears frequently in one article and rarely appears in other
articles, it is considered that the word or phrase has good       3.2.1 Ensemble empirical mode decomposition
classification ability and should be given a higher degree
of importance.                                                    Huang et al. [32] first proposed EMD in 1999. It is a signal
                                                                  processing method, which can be used to process nonlinear
                                                                  and nonstationary signals. However, EMD has some short-
The calculation of modified words and position                     comings, which may lead to the problem of “mode mixing”.
After setting the score and weights of sentiment words, we        In order to solve this problem, Wu and Huang [33] proposed
need to calculate the influence of modified words and the           ensemble EMD based on EMD in 2009. The steps of EEMD
position between modified words and sentiment words to             are as follows:
optimize the weights. We develop weight optimization rules
based on semantic rules. The rules are as follows:                    Step 1: Determine the standard Gaussian white noises
                                                                  gi(t) ~ N(0, r2), (the standard deviation r is usually set
(a) If there are no modifiers or negatives in front of             as 0.1 or 0.2), the ensemble number E and a loop variable
    semantic words, the score of the emotional word does          i = 1.
    not change.                                                       Step 2: Add a Gaussian white noise gi(t) to the raw ser-
(b) If there is any negative in front of semantic words,          ies Y(t) to obtain the following new series:
    the score of the semantic word needs to be multiplied                              Y i ðt Þ ¼ Y ðt Þ þ g i ðt Þ:               ð3Þ
    by 1.
(c) If there is any modifier in front of semantic words, the          Step 3: Conduct EMD on Yi(t) to get m intrinsic mode
    score of the semantic word needs to be multiplied by          functions (IMFs) and one residue series ri(t):
    the weight of this modifier.
                                                                                             X
                                                                                             m

   We can obtain the sentiment scores optimized by the                            Y i ðt Þ ¼   cij ðt Þ þ r i ðt Þ;   ð4Þ
above three semantic rules.                                                                     j¼1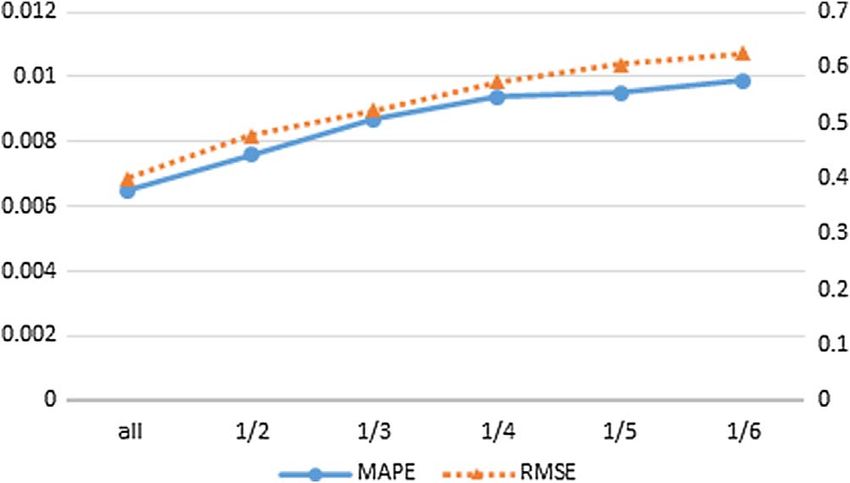
4                     Z. Hu: Oil & Gas Science and Technology – Rev. IFP Energies nouvelles 76, 28 (2021)

where m = blog2Tc  1 [33], determined by the length of
raw series T.
   Step 4: Add 1 to the loop variable i. If i > m, execute
Step 5; otherwise, go back Step 2.
   Step 5: Calculate the jth final IMF Cj(t) in E trials as
shown in equation (5):
                              1 XI
                   C j ðt Þ ¼       cij ðt Þ:          ð5Þ
                              E j¼1

    Step 6: Obtain the residue series as shown in equation
(6):
                                   X
                                   m
                 r ðt Þ ¼ Y ðt Þ    C j ðt Þ:         ð6Þ
                                    j¼1

Finally, the raw series can be divided into m IMFs and one       Fig. 1. The unit structure of LSTM.
residue.
    However, due to the difference of the chosen white noise,
the mode functions obtained by decomposition are differ-         The output gate controls what input data and long-term
ent, which makes EEMD unstable. And EEMD method is               status should be output at the current time. Output gate
difficult to completely eliminate the reconstruction error        determines the output information. This gives the output
caused by Gaussian white noise. In order to further solve        cell state which is obtained through sigmoid layer and then
these problems, Torres et al. [34] proposed CEEMDAN,             through a tan h function. The formulas are given in
on the basis of EEMD in 2011, which can better obtain            equations (11) and (12):
the intrinsic mode functions and accurately reconstruct
the original signal, with lower operation cost than EEMD                        ot ¼ rðW o h t1 þ U o x t þ bo Þ;        ð11Þ
algorithm.
                                                                                     h t ¼ ot  tan h ðC t Þ:             ð12Þ
3.2.2 LSTM with attention mechanism
                                                                 LSTM method has been widely used in many fields, such as
Hochreiter and Schmidhuber [35] proposed LSTM in 1997            Natural Language Processing (NLP), image processing,
to overcome the problem of gradient disappearing in              speech recognition and so on. In recent years, LSTM has
RNN. The difference between LSTM and RNN is that three           also been applied in time series analysis and achieved good
gates including input gates, output gates and forget gates       performances.
are added in LSTM. LSTM is well suited for dealing with              And the attention mechanism [36] was proposed by
long-term dependency issues. The specific structure of the        Google Deep Learning team in 2014. The mechanism of
model is shown in Figure 1, where the cell state C is used       attention originates from the study of vision, which is pro-
to record the long-term status of the sequence and hidden        posed by referring to the operation of human brain. It can
state h is used to record the current status of the sequence.    help us to find more important information in the deep
     The forget gate decides what information needs to be        learning task. Bahdanau et al. [37] used the similar atten-
retained. It is a sigmoid function whose value is from 0 to 1    tion mechanism to translate and align in the machine trans-
and determines the degree of forgetting the input information.   lation task, which is the first work to propose the attention
And forget gate’s input includes output of last sequence and     mechanism to apply to the NLP field. Recently, attention
input of this sequence. The formula is represented as equation   mechanism has become a hot research field of machine
(7):                                                             learning.
                                                                   The principle of attention mechanism is to change the
                 ft ¼ r W f h t1 þ U f x t þ bf :         ð7Þ
                                                                 hidden state ht which should be directly transferred to the
                                                                 neural network of the previous layer to the weight of all
The input gate determines what information will be added
                                                                 hidden states of the previous all layers. The formula is
to the current input information in the long-term state.
                                                                 expressed as equation (13):
And then we building a new vector. The formulas are
defined as follows in equations (8) and (9):                                                    X
                                                                                               T
                                                                                      ct ¼         at;i h i :           ð13Þ
               it ¼ r W i h t1 þ U f x t þ bi ;     ð8Þ                                       i¼1

             a t ¼ tan h ðW a h t1 þ U a x t þ bi Þ:     ð9Þ    The attention mechanism makes that the final output is not
                                                                 the previous value of all hidden layers, but the weighted
Passing through forgetting gate and input gate, old cell         sum of hidden layers values obtained by the similarity of
state Ct1 is updated to Ct. The formula is represented as       input vector and goal vector so as to focus on the important
equation (10):                                                   information. The attention mechanism can better integrate
                                                                 the historical price series and news sentiment series to fore-
                  C t ¼ C t1  ft þ it  a t :          ð10Þ    cast future price.
Z. Hu: Oil & Gas Science and Technology – Rev. IFP Energies nouvelles 76, 28 (2021) 5
Fig. 2. The flowchart for the proposed approach.
3.2.3 The proposed CEEMDAN-LSTM_att-ADD component along with corresponding sentiment index com-
with news sentiment index ponent, and then, the forecasting model can predict the test
data of each single component. Finally, the predicted values
Considering the powerful abilities of CEEMDAN on signal from each component can be aggregated as the final fore-
preprocessing and the advantages of LSTM on time series pre- casting results of crude oil prices. All these steps contribute
diction, this paper puts forward a novel approach that inte- to improve the performance for crude oil prices prediction.
grates CEEMDAN, LSTM with attention mechanism and
addition, termed CEEMDAN-LSTM_att-ADD, in addition
with news sentiment index, for forecasting crude oil prices, 4 Experiment
which follows the “decomposition and ensemble” framework.
The approach is shown in Figure 2, consisting of three stages: 4.1 Data description
Stage 1: Decomposition. CEEMDAN is applied to 4.1.1 Crude oil Chinese news texts
decompose the raw series of crude oil prices Y(t)
(t = 1, 2,. . ., T) into two parts: (1) m components hj(t) According to the authority and integrity of news, we selected
(j = 1, 2,. . ., m); (2) one residue component r(t). The same two websites including the website of ZhongYou (http://
operation is applied to the raw news sentiment index X(t) www.cnoil.com/) and the website of international oil
(t = 1, 2,. . ., T). (http://oil.in-en.com/) as our data sources. The news con-
Stage 2: Individual prediction. For each component tents of these two websites mainly focus on the field of crude
from Stage 1, the sentiment index component is attached oil. We crawl crude oil news texts from the two websites
with corresponding price component. The LSTM with using crawler technology, totally 31 525 articles from
attention model is fit on the training set, and then, the 28 February 2006 to 9 March 2020. Due to the lack of news
model is applied to the test set. data in some time periods, we choose the news data from
Stage 3: Ensemble prediction. The test results of all 4 December 2014 to 25 February 2020 to ensure data conti-
components from Stage 2 are aggregated by simple addition nuity. Finally, after deleting the part of news, we get totally
as the final forecasting results. 23 033 news texts and an average of 17 news samples per day.
The CEEMDAN-LSTM_att-ADD with news senti- The specific steps are as follows: 1) get the URL list of
ment index first used CEEMDAN to decompose the origi- the page to be grabbed; 2) grab the page and 3) parse the
nal crude oil price series and the sentiment index into page. First of all, by analyzing the source code of the two
several components, which transformed the complex series websites, the URL lists of relevant news can be obtained.
into several relatively simple components. And each compo- And then we grab the pages. In the final step of page pars-
nent reflects some characteristics of raw series. Specifically, ing, we use HTML tag rules and regular expression to
the first several IMFs reflect high-frequency parts, while the match and crawl the content of the news we need.
last several IMFs and the residue reflect the low-frequency After obtaining the news texts, we utilized them to con-
parts of raw series. Secondly, the CEEMDAN-LSTM_att- struct the news sentiment index via the approach men-
ADD builds a forecasting model for each single price tioned above.6 Z. Hu: Oil & Gas Science and Technology – Rev. IFP Energies nouvelles 76, 28 (2021)
4.1.2 Crude oil price series
In order to test the validity of our approach CEEMDAN-
LSTM_att-ADD with news sentiment index, this paper
used an open crude oil price series, WTI crude oil daily spot
prices, from US EIA for its authority and importance in the
international crude oil markets. Considering the start and
end time of crude oil news in the two websites, we used
the daily close prices from 4 December 2014 to 25 February
2020, with a total 1311 samples, as experimental data.
Among the samples, the first 80% ones were used as train-
ing samples, and the remaining 20% ones were used as test-
ing samples.
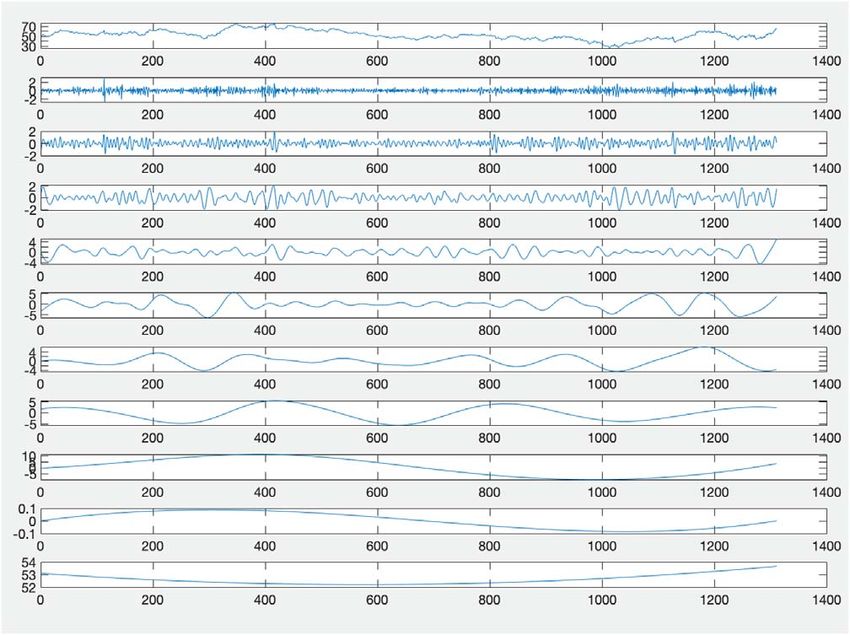
The news sentiment index and the original crude oil
prices with corresponding components decomposed by
CEEMDAN of WTI are shown in Figure 3 and Figure 4,
respectively. The top series in the two figures are the origi-
nal data, followed by the IMFs and the residual series.
4.2 Evaluation criteria Fig. 3. The daily news sentiment index decomposed by
CEEMDAN.
As for the evaluation criteria, we chose two most frequently
used evaluation indicators for time series prediction: the
Mean Absolute Percent Error (MAPE) and the Root Mean
Squared Error (RMSE). MAPE and RMSE are defined as
equation (14) and equation (9), respectively:
N
1 X Y i y i
MAPE ¼ ; ð14Þ
N i¼1 Y i
vffiffiffiffiffiffiffiffiffiffiffiffiffiffiffiffiffiffiffiffiffiffiffiffiffiffiffiffiffi
u N
1u X
RMSE ¼ t
2
ðY i y i Þ ; ð15Þ
N i¼1
where Yi is the actual value, yi is the predicted value at
time i and N is the total number of test samples.
In addition, we utilized the Diebold-Mariano (DM)
statistic to compare the prediction accuracy of two models,
which is defined as equation (16):
1
P
n
Fig. 4. WTI crude oil daily prices decomposed by CEEMDAN.
n
dt
S ¼ sffiffiffiffiffiffiffiffiffiffiffiffiffiffiffiffiffiffiffiffiffiffiffiffiffiffiffiffiffiffiffiffiffiffiffiffiffiffiffiffiffiffiffiffiffiffiffiffiffiffiffiffiffiffi
t¼1
ffi ; ð16Þ
nP1
1
c0 þ 2 covðd t ; d tk Þ Three popular models of time series prediction including
n
k¼1 SVR, AdaBoost and Random Forest were used to compare
with it. Then we did experiments on the decomposed series
where d t ¼ ðy t y^1t Þ2 ðy t y^2t Þ2 , y^1t represents the via CEEMDAN under the framework of “decomposition
values predicted by the first model at time t, while y^2t is and ensemble”. And the prediction values of each compo-
predicted by the other model. If the value is negative, it nent were added to get the final price prediction value
means the first model is statistically better than the other owing to the ADDition (ADD) operation’s simplicity and
one. effectiveness. We call this approach as CEEMDAN-
LSTM_att-ADD. At the same time, other three ensemble
4.3 Experimental settings models were further compared with the approach to verify
the validity of it.
As for crawling crude oil news, we used the package For LSTM, we set 16 as the number of hide layer nodes
Beautiful Soup 4 because it can provide users with different after experimental comparison. In addition, we chose 4 and
resolution strategies and strong speed flexibly. And for 100 as the value of batch size and the value of epochs,
word segmentation, we used the tool called jieba. respectively. For SVR, we used Radial Basis Function
To show the prediction ability of LSTM with atten- (RBF) as the kernel function of the model. For AdaBoost
tion mechanism on crude oil price series, firstly, we and Random Forest, 50 sub-models and 20 sub-models were
conducted experiments on raw series using single models. chosen.Z. Hu: Oil & Gas Science and Technology – Rev. IFP Energies nouvelles 76, 28 (2021) 7
In addition, we conducted the operation of data normal- Table 2. The MAPE values by different single models on
ization, which is helpful for time series forecasting. Data WTI crude oil daily prices.
normalization can speed up the training of objective func-
tion and unify the dimension of sample. In this paper, we Horizon LSTM_att SVR AdaBoost RF
used the Min-Max normalization for all models, which maps One 0.0229 0.0361 0.0250 0.0245
the raw values in the range of [0, 1]. The normalization
Two 0.0325 0.0405 0.0358 0.0325
formula is as equation (17):
Three 0.0381 0.0456 0.0410 0.0393
Y Y min Four 0.0447 0.0502 0.0464 0.0454
Y norm ¼ ; ð17Þ
Y max Y min Five 0.0497 0.0545 0.0501 0.0530
where Ymax and Ymin are the maximum and minimum Six 0.0537 0.0586 0.0550 0.0575
values of the original dataset, respectively. Y and Ynorm Note: The values in bold signify the minimum MAPE or
are the raw values and the normalized values, respec- RMSE values of different models for each horizon.
tively. After the prediction sequence is obtained, we can
carry out the inverse normalization operation.
In order to explore the ability of model prediction in Table 3. The RMSE values by different single models on
advance, we chose horizons from 1 to 6 and conducted mul- WTI crude oil daily prices.
ti-step-ahead prediction. The forecast horizon means the
number of days ahead of the predicting day. For example, Horizon LSTM_att SVR AdaBoost RF
the horizon at 6 means that we used Yt, (t = 1, 2, 3,. . ., One 1.4455 2.1408 1.5949 1.5690
T) to predict Yt+6. For predicting the value of crude oil Two 2.0848 2.4467 2.2113 2.0590
price using a price time series Yt, (t = 1, 2, 3,. . ., T) and Three 2.4754 2.7494 2.5719 2.5356
a news sentiment series Xt, (t = 1, 2, 3,. . ., T), it can be
formulated as equation (18): Four 2.7841 3.0050 2.8739 2.8457
Five 3.0893 3.2504 3.0883 3.2762
y tþh ¼ f Y t ; Y t1 ; Y t2 ; ; Y tðl1Þ ; X t ; X t1 ; X t2 ; ; X tðl1Þ ; Six 3.3587 3.4988 3.3713 3.5635
ð18Þ Note: The values in bold signify the minimum MAPE or
RMSE values of different models for each horizon.
where Yt, yt represents the predicted value of Yt at time t
and l represents the lag order. As suggested by Zhou et al.
[38] and shown by our comparative experiments, we set 6 Table 4. The MAPE values by different ensemble models
as the lag order. on WTI crude oil daily prices.
All the experiments were conducted by Python3.7 on a
64-bit Windows 10 professional edition with an i7-8565U CEEMDAN
CPU @1.8 GHz and 8 GB RAM. The experiments have Horizon LSTM_att SVR AdaBoost RF
been performed with the following Python libraries.
Packages pandas and numpy were used for data processing One 0.0095 0.0295 0.0281 0.0201
while packages BeautifulSoup, requests and jieba were used Two 0.0142 0.0310 0.0322 0.0248
for crawling and word segmentation. As for the models, we Three 0.0145 0.0316 0.0354 0.0273
utilized packages sklearn and Keras for machine learning Four 0.0147 0.0328 0.0403 0.0323
and deep learning models, respectively.
Five 0.0226 0.0347 0.0434 0.0351
4.4 Results and analysis Six 0.0239 0.0368 0.0467 0.0396
Note: The values in bold signify the minimum MAPE or
4.4.1 Single models RMSE values of different models for each horizon.
The MAPE and RMSE values for single models on WTI
crude oil prices are shown in Table 2 and Table 3, respec- improved significantly. As for LSTM-attention model, the
tively. For MAPE values, LSTM with attention achieved MAPE values and RMSE values at least reduced 50%.
the lowest values in all horizons. For RMSE values, LSTM But for AdaBoost model and Random Forest model, the
with attention got the best performance in 5 out of 6 cases. results did not improve obviously, even worse sometimes.
And for all models, MAPE values and RMSE values This shows that CEEMDAN has little effect on some
increased when the horizon increased. ensemble models.
4.4.2 Ensemble models 4.4.3 Ensemble models with news sentiment index
The results are shown in Tables 4 and 5. As for the ensem- After the news sentiment index taken into consideration,
ble models, CEEMDAN-LSTM_att-ADD achieved the the MAPE values and RMSE values of all models on
lowest (the best) values among all models in all horizons WTI crude oil prices almost improved. The results could
for MAPE values and RMSE values. Compared with the be seen from Tables 6 and 7. For CEEMDAN-
above single models, the performance of ensemble models LSTM_att-ADD, the MAPE values and RMSE values8 Z. Hu: Oil & Gas Science and Technology – Rev. IFP Energies nouvelles 76, 28 (2021)
Table 5. The RMSE values by different ensemble models Table 7. The RMSE values by ensemble models with
on WTI crude oil daily prices. news sentiment index on WTI crude oil daily prices.
CEEMDAN With news sentiment index CEEMDAN
Horizon LSTM_att SVR AdaBoost RF Horizon LSTM_att SVR AdaBoost RF
One 0.5879 1.8764 1.8408 1.4335 One 0.4014 1.7183 1.9010 1.1280
Two 0.9270 1.9819 2.1427 1.6910 Two 0.7587 1.8312 2.1330 1.4607
Three 0.9405 2.0447 2.3145 1.8269 Three 0.8485 1.8882 2.3769 1.7392
Four 0.9387 2.1205 2.6146 2.0612 Four 0.9055 1.9808 2.6660 2.1096
Five 1.3900 2.2489 2.8004 2.2277 Five 1.3654 2.1267 2.8289 2.3699
Six 1.5075 2.3766 3.0138 2.5068 Six 1.4562 2.2093 3.0841 2.6136
Note: The values in bold signify the minimum MAPE or Note: The values in bold signify the minimum MAPE or
RMSE values of different models for each horizon. RMSE values of different models for each horizon.
Table 6. The MAPE values by ensemble models with the impact of number of news texts dataset samples, we
news sentiment index on WTI crude oil daily prices. conducted three groups of comparative experiments. The
With news sentiment index CEEMDAN results can be seen from Table 9, Figure 5 and Figure 6,
respectively.
Horizon LSTM_att SVR AdaBoost RF
One 0.0065 0.0291 0.0276 0.0173 4.5.1 The impact of the weight of sentiment words
Two 0.0116 0.0306 0.0312 0.0221
For simplicity, the first comparative experiment set the
Three 0.0129 0.0311 0.0359 0.0262 single model LSTM with attention to baseline. “+ News”
Four 0.0143 0.0321 0.0411 0.0322 represents the news sentiment index was added and
Five 0.0208 0.0337 0.0427 0.0359 “+ News + TFIDF” represents the news sentiment index
Six 0.0231 0.0347 0.0461 0.0398 was added and TFIDF value of sentiment words were used
as their weights. Some interesting results can be found from
Note: The values in bold signify the minimum MAPE or Table 9. When we add the sentiment index to LSTM_att
RMSE values of different models for each horizon. model, the MAPE values got smaller only in horizons
four and six while all RMSE values did not get improved.
both improved significantly, achieving 46.15% reduction The result showed that untreated sentiment index could
and 46.46% reduction, respectively in horizon one. In other not make the performance better. And we continued to
horizons, the values also improved obviously, which proved add TFIDF value of sentiment words, the situation
the function of news sentiment index. And for CEEMDAN- changed. It achieved the best values in 4/6 cases for
SVR, the MAPE values and RMSE values improved MAPE and 3/6 cases for RMSE. The results illustrated
slightly and the effect is not as good as the effect of LSTM that it might cause noise if the sentiment index was not
with attention, showing that the attention mechanism processed.
could better combine the price series and sentiment index.
For CEEMDAN-AdaBoost-ADD and CEEMDAN-RF- 4.5.2 The impact of lag order
ADD, the results changed unsteadily with the horizon
increasing, which further proved that LSTM with attention To further analyze the impact of the lag order on
could utilize the sentiment index effectively. LSTM_att + News + TFIDF, we chose one-step-ahead
As for the statistical test, the results of the DM test for prediction with the lag order in the range of 1–12.
the ensemble methods on WTI are shown in Table 8, The results were shown in Figure 5. It can be seen that
statistically confirming the above results. Firstly, the the MAPE values and RMSE values slightly improved
superiority of the proposed CEEMDAN-LSTM_att-ADD with the lag order increasing from 1 to 6. After the lag
was validated from the perspective of statistics. Specifically, order 6, the values did not change obviously or became
the p-values of the CEEMDAN-LSTM_att-ADD were far worse. The reason might be that more noises were intro-
below 0.01 in all cases. This demonstrates that the pro- duced to the model. By contrastive analysis, we can choose
posed CEEMDAN-LSTM_att-ADD performed statisti- a suitable lag order 6 for forecasting crude oil prices
cally better than other benchmark models at a confidence accurately.
level of 99.9% in most cases when it was treated as the
model of testing the target. 4.5.3 The impact of number of news texts dataset
samples
4.5 Discussion
In order to further illustrate the impact of number of news
In addition, in order to explain the impact of the weight of texts dataset samples on the prediction results, we
sentiment words in news texts, the impact of lag order and randomly eliminate part of news samples in the step ofZ. Hu: Oil & Gas Science and Technology – Rev. IFP Energies nouvelles 76, 28 (2021) 9
Table 8. The DM test results for ensemble models on WTI crude oil daily prices.
CEEMDAN Benchmark Model
Horizon Test Model SVR(s) AdaBoost(s) RF(s) LSTM_att SVR AdaBoost RF
One LSTMatt(s) 15.33 12.76 10.54 9.21 20.34 18.87 17.63
(0.0000) (0.0000) (0.0000) (0.0000) (0.0000) (0.0000) (0.0000)
Two LSTMatt(s) 13.64 10.45 9.23 8.98 17.76 16.22 16.85
(0.0000) (0.0000) (0.0000) (0.0014) (0.0000) (0.0000) (0.0000)
Three LSTMatt(s) 12.78 11.98 8.46 9.34 15.34 17.26 15.37
(0.0000) (0.0000) (0.0003) (0.0000) (0.0000) (0.0006) (0.0000)
Four LSTMatt(s) 11.65 10.12 7.39 7.54 13.77 15.39 13.94
(0.0000) (0.0000) (0.0000) (0.0025) (0.0000) (0.0000) (0.0000)
Five LSTMatt(s) 10.98 10.76 8.11 6.33 14.34 14.36 13.55
(0.0000) (0.0000) (0.0031) (0.0000) (0.0000) (0.0000) (0.0000)
Six LSTMatt(s) 9.35 7.58 6.87 7.85 12.65 13.93 11.58
(0.0000) (0.0000) (0.0045) (0.0000) (0.0000) (0.0000) (0.0000)
Table 9. The impact of the news index for LSTM_att.
MAPE RMSE
LSTM_att + News + News + TFIDF LSTM_att + News + News + TFIDF
One 0.0229 0.0267 0.0228 1.4455 1.7150 1.4597
Two 0.0325 0.0345 0.0310 2.0848 2.3392 2.0890
Three 0.0381 0.0400 0.0374 2.4754 2.7808 2.5367
Four 0.0447 0.0435 0.0437 2.7841 2.9340 2.7411
Five 0.0497 0.0497 0.0483 3.0893 3.3694 3.0208
Six 0.0537 0.0511 0.0538 3.3587 3.3902 3.3317
Note: The values in bold signify the minimum MAPE or RMSE values of different models for each horizon.
Fig. 5. The impact of lag on WTI crude oil prices with one-step-
ahead prediction (Note: left and right scales on the vertical axis
stand for, respectively, MAPE and RMSE). Fig. 6. The impact of number of news texts dataset samples on
WTI crude oil prices with one-step-ahead prediction (Note: left
and right scales on the vertical axis stand for, respectively,
MAPE and RMSE).
constructing news sentiment index. The results were shown
in Figure 6. We selected 1/2, 1/3, 1/4, 1/5, 1/6, respec-
tively as the proportions of remaining samples to original
samples. It can be seen that when the number of remaining 5 Conclusion
samples decreased, the MAPE values and RMSE values
correspondingly increased, which means enough news texts The nonlinearity and nonstationarity of crude oil prices
samples is necessary for constructing good news sentiment make it a challenging task for forecasting time series accu-
index. rately. Traditional methods including statistical methods10 Z. Hu: Oil & Gas Science and Technology – Rev. IFP Energies nouvelles 76, 28 (2021)
and AI-based models usually cannot achieve satisfactory 8 Zhao Y., Li J., Yu L. (2017) A deep learning ensemble
results when the forecasting is performed on raw crude oil approach for crude oil price forecasting, Energy Econ. 66, 9–16.
prices. To handle the issue, this paper proposed a novel 9 Kristjanpoller W., Minutolo M.C. (2016) Forecasting volatil-
forecasting approach for crude oil prices that combines ity of oil price using an artificial neural network GARCH
CEEMDAN, LSTM with attention mechanism and addi- model, Expert Syst. Appl. 65, 233–241.
tion (namely CEEMDAN-LSTM_att-ADD), under the 10 Safari A., Davallou M. (2018) Oil price forecasting using a
well-known “decomposition and ensemble” framework. hybrid model, Energy 148, 49–58.
Inspired by the correlation between the news sentiment 11 Yu L., Zhao Y., Tang L. (2014) A compressed sensing based
AI learning paradigm for crude oil price forecasting, Energy
and crude oil prices, a news sentiment index based on
Econ. 46, 236–245.
Chinese crude oil news texts was constructed and added
12 Zhang X., Lai K.K., Wang S. (2008) A new approach for
to the prediction of crude oil prices. crude oil price analysis based on empirical mode decompo-
After the results and analyses above mentioned, the sition, Energy Econ. 30, 905–918.
conclusions are as follows: 1) Compared with other models, 13 Xing F.Z., Cambria E., Welsch R.E. (2018) Natural language
LSTM with attention mechanism model was very powerful based financial forecasting: a survey, Artif. Intell. Rev. 50, 1,
for forecasting crude oil prices in both single models and 49–73.
ensemble models; 2) The ensemble models significantly 14 Xing F.Z., Cambria E., Welsch R.E. (2018) Intelligent
improved the forecasting accuracy when compared with asset allocation via market sentiment views, IEEE Comput.
single models, owing to the strategy of decomposing and Intell. 13, 4, 1–20.
ensemble; 3) The attention mechanism could utilize the 15 Oladosu G. (2009) Identifying the oil price-macroeconomy
sentiment index effectively and the results improved signif- relationship: An empirical mode decomposition analysis of
icantly when combining the price series and sentiment US data, Energy Policy 37, 12, 5417–5426.
index for CEEMDAN-LSTM_att-ADD. 16 King K., Deng A., Metz D. (2012) An econometric analysis
In the future, we can improve our work from the of oil price movements: The role of political events and
following three aspects. First, a more detailed syntax anal- economic news, financial trading, and market fundamentals,
ysis can be carried out for crude oil news text to remove the Bates White Economic Consulting.
text noise and make the calculation of emotional indicators 17 Bohn T.A. (2017) Improving long term stock market
more accurate. In addition, for different components after prediction with text analysis, Electronic Thesis and Disser-
decomposition, different models are adaptively selected tation Repository, The University of Western Ontario.
according to their properties to improve the prediction Available at https://ir.lib.uwo.ca/etd/4497.
18 Li X., Wang C., Dong J., Wang F., Deng X., Zhu S. (2011)
results. Finally, exploring the impact of a sentiment index
Improving stock market prediction by integrating both
in level term but also in variance term using structural
market news and stock prices, in Database and Expert Systems
VAR models a valuable research direction. Applications, 22nd International Conference, DEXA 2011,
Bilbao, Spain, August 29 – September 2, 2011, Proceedings,
Part II, A. Hameurlain, S.W. Liddle, K.-D. Schewe, X. Zhou
Acknowledgments. This work was supported by the graduate (eds), Springer-Verlag, Berlin Heidelberg, pp. 279–293.
innovation fund of Shanghai University of Finance and 19 Li T., Hu Z., Jia Y., Wu J., Zhou Y. (2018) Forecasting crude
Economics (under Project No. CXJJ-2020-428). oil prices using ensemble empirical mode decomposition and
sparse bayesian learning, Energies 11, 7, 1882.
20 Yu L., Dai W., Tang L. (2016) A novel decomposition
References ensemble model with extended extreme learning machine for
crude oil price forecasting, Eng. Appl. Artif. Intel. 47, 110–121.
1 Galyfianakis G., Garefalakis A., Mantalis G. (2017) The 21 Li J., Wang J. (2020) Stochastic recurrent wavelet neural
effects of commodities and financial markets on crude oil, Oil network with EEMD method on energy price prediction, Soft
Gas Sci. Technol. – Rev. IFP Energies nouvelles 72, 1, 3. Comput. 24, 17133–17151.
2 Wang Y., Wei Y., Wu C. (2011) Detrended fluctuation 22 Abdollahi H. (2020) A novel hybrid model for forecasting
analysis on spot and futures markets of West Texas Interme- crude oil price based on time series decomposition, Appl.
diate crude oil, Phys. A, Stat. Mech. Appl. 390, 5, 864–875. Energy 267.
3 Abledu G.K., Agbodah K. (2012) Stochastic forecasting and 23 Wu Y., Wu Q., Zhu J. (2019) Improved EEMD-based crude
modelling of volatility of oil prices in Ghana using ARIMA oil price forecasting using LSTM networks, Physica A Stat.
time series model, Eur. J. Bus. Manag. 4, 16, 122–131. Mech. Appl. 516, 114–124.
4 Baumeister C., Kilian L. (2012) Real-time forecasts of the 24 Devitt A., Ahmad K. (2007) Sentiment polarity identifica-
real price of oil, J. Bus. Econ. Stat. 30, 2, 326–336. tion in financial news: A cohesion-based approach. Associa-
5 Shin H., Hou T., Park K., Park C.K., Choi S. (2013) Prediction tion for Computational Linguistics, in: A. Zaenen, A. Van
of movement direction in crude oil prices based on semi- Den Bosch (eds), Proceedings of the 45th Annual Meeting of
supervised learning, Decis. Support Syst. 55, 1, 348–358. the Association for Computational Linguistics, Association
6 Yu L., Xu H., Tang L. (2017) LSSVR ensemble learning with for Computational Linguistics, pp. 984–991.
uncertain parameters for crude oil price forecasting, Appl. 25 Das S.R., Chen M.Y. (2007) Yahoo! for Amazon: Sentiment
Soft Comput. 56, 692–701. extraction from small talk on the web, Manage Sci. 53, 9,
7 Tang M., Zhang J. (2012) A multiple adaptive wavelet 1375–1388.
recurrent neural network model to analyze crude oil prices, J. 26 Bollen J., Mao H., Zeng X. (2011) Twitter mood predicts the
Bus. Econ. 64, 4, 275–286. stock market, J. Comput. Sci. 2, 1, 1–8.Z. Hu: Oil & Gas Science and Technology – Rev. IFP Energies nouvelles 76, 28 (2021) 11 27 Lechthaler F., Leinert L. (2012) Moody oil-What is driving 34 Torres M.E., Colominas M.A., Schlotthauer G., Flandrin P. the crude oil price? CER-ETH Economics working paper (2011) A complete ensemble empirical mode decomposition series 12/168, CER-ETH-Center of Economic Research with adaptive noise, in: Proceedings of the 36th IEEE (CER-ETH) at ETH Zurich. International Conference on Acoustics, Speech, and Signal 28 Alfano S.J., Feuerriegel S., Neumann D. (2015) Is news Processing (ICASSP), IEEE, pp. 4144–4147. sentiment more than just noise? 35 Hochreiter S., Schmidhuber J. (1997) Long short-term 29 Dong Z., Dong Q. (2003) HowNet – a hybrid language and memory, Neural Comput. 9, 8, 1735–1780. knowledge resource, in C. Zong (ed), Proceedings of Inter- 36 Mnih V., Heess N., Graves A., Kavukcuoglu K. (2014) national Conference on Natural Language Processing and Recurrent models of visual attention, in: Z. Ghahramani, M. Knowledge Engineering, IEEE, pp. 820–824. Welling, C. Cortes, N.D. Lawrence, K.Q. Weinberger (eds), 30 Yan J., Bracewell D.B., Ren F., Kuroiwa S. (2008) The Proceedings of the 27th International Conference on Neural creation of a Chinese emotion ontology based on HowNet, Information Processing Systems, Vol. 2, MIT Press, Eng. Lett. 16, 1, 166–171. Cambridge, MA, United States, pp. 2204–2212. 31 Liu J., Xu J., Zhang Y. (2013) An approach of hybrid 37 Bahdanau D., Cho K., Bengio Y. (2015) Neural machine hierarchical structure for word similarity computing by translation by jointly learning to align and translate, in: HowNet, in: R. Mitkov, J.C. Park (eds), Proceedings of the Y. Bengio, Y. LeCun (eds), 3rd International Conference on 6th International Joint Conference on Natural Language Learning Representations, ICLR 2015, San Diego, CA, USA, Processing, Asian Federation of Natural Language Process- May 7–9, 2015, Conference Track Proceedings, Interna- ing, pp. 927–931. tional Conference on Learning Representations, ICLR. 32 Huang N.E., Shen Z., Long S.R. (1999) A new view of 38 Zhou Y., Li T., Shi J., Qian Z. (2019) A CEEMDAN nonlinear water waves: The Hilbert Spectrum, Ann. Rev. and xgboost-based approach to forecast crude oil prices, Fluid Mech. 31, 1, 417–457. Complexity 2019, 1–15. 33 Wu Z., Huang N.E. (2009) Ensemble empirical mode decomposition: A noise-assisted data analysis method, Adv. Adapt. Data Anal. 1, 1, 1–41.
You can also read