Purple Feed: Identifying High Consensus News Posts on Social Media - Max ...
←
→
Page content transcription
If your browser does not render page correctly, please read the page content below
Purple Feed: Identifying High Consensus News Posts on Social Media
                     Mahmoudreza Babaei† , Juhi Kulshrestha† , Abhijnan Chakraborty†‡
                      Fabrı́cio Benevenuto†∗ , Krishna P. Gummadi† , Adrian Weller∗∗
                                 †
                                  Max Planck Institute for Software Systems (MPI-SWS), Germany
                                         ‡
                                           Indian Institute of Technology Kharagpur, India
                                           ∗
                                             Universidade Federal de Minas Gerais, Brazil
                               ∗∗
                                  University of Cambridge & Alan Turing Institute, United Kingdom

                            Abstract                                reinforce their pre-existing views. This selective exposure,
                                                                    where red users read red news and blue users read blue news,
  Although diverse news stories are actively posted on social       leads to a more politically fragmented, less cohesive society
  media, readers often focus on the news which reinforces their
  pre-existing views, leading to ‘filter bubble’ effects. To com-
                                                                    (Liu and Weber 2014). Further, this selective exposure ef-
  bat this, some recent systems expose and nudge readers to-        fect is often amplified by social media platforms which rec-
  ward stories with different points of view. One example is the    ognize users’ preferences and thence recommend more red
  Wall Street Journal’s ‘Blue Feed, Red Feed’ system, which         news to red users and more blue news to blue users. While
  presents posts from biased publishers on each side of a topic.    this approach may work well for recommending consumer
  However, these systems have had limited success.                  goods such as movies or music, there are concerns that such
  We present a complementary approach which identifies high         stilted news selections limit exposure to differing perspec-
  consensus ‘purple’ posts that generate similar reactions from     tives and lead to the formation of ‘filter bubbles’ or ‘echo
  both ‘blue’ and ‘red’ readers. We define and operationalize       chambers’ (Bakshy, Messing, and Adamic 2015; Bozdag
  consensus for news posts on Twitter in the context of US pol-     2013; Flaxman, Goel, and Rao 2016; Pariser 2011), resulting
  itics. We show that high consensus posts can be identified and    in worrying increase in societal polarization (Sunstein 2002;
  discuss their empirical properties. We present a method for       Schkade, Sunstein, and Hastie 2007).
  automatically identifying high and low consensus news posts
  on Twitter, which can work at scale across many publishers.          To combat this polarization, a number of systems intended
  To do this, we propose a novel category of audience leaning       to promote diversity have been proposed. These systems de-
  based features, which we show are well suited to this task. Fi-   liberately expose users to different points of view by show-
  nally, we present our ‘Purple Feed’ system which highlights       ing red news to blue users, and blue news to red users; or by
  high consensus posts from publishers on both sides of the po-     showing both red and blue news to both red and blue user
  litical spectrum.                                                 groups. The hope is to nudge users to read viewpoints which
                                                                    disagree with their own (Munson, Lee, and Resnick 2013;
                        Introduction                                Park et al. 2009). A prominent example is the Wall Street
                                                                    Journal’s ‘Blue feed, Red feed’ system (Keegan 2017),
A growing number of people rely on social media platforms,          which presents posts from the most extreme news publish-
such as Twitter and Facebook, for their news and informa-           ers on Facebook, with the aim of showing diametrically op-
tion needs (Lichterman 2010; Teevan, Ramage, and Morris             posed perspectives on news stories.
2011). As a result, the users themselves play a role in select-        Unfortunately, however, such systems have had limited
ing the sources from which they consume information, over-          success. While some diversity-seeking users enjoy the added
throwing traditional journalistic gatekeeping (Shoemaker,           perspectives, many users either ignore or reject disagreeable
Vos, and Reese 2009). To cope with the huge amount of in-           points of view (Munson and Resnick 2010). Indeed, by con-
formation available, most social media platforms, together          fronting users with the most radical posts from the other ide-
with third party developers, have deployed information se-          ological side, such systems may even increase polarization
lection and retrieval systems which help users discover and         by encouraging users to retreat to a more entrenched version
read interesting news and information.                              of their initial position (Lord and Ross 1979; Miller et al.
   Within our societies, there are many topics for which dif-       1993; Munro and Ditto 1997).
ferent subgroups hold opposing ideological positions. For
                                                                       In this work, we propose a complementary approach by
example, there are primarily two distinct political affiliations
                                                                    identifying and highlighting news posts which are likely to
in the US: Republicans (the ‘red’ group) and Democrats (the
                                                                    evoke similar reactions from the readers, irrespective of their
‘blue’ group). Social media platforms provide a wide vari-
                                                                    political leanings. We define these ‘purple’ news posts to
ety of news sources covering this ideological spectrum, yet
                                                                    be those with high consensus, i.e., having a general agree-
many users largely limit themselves to news stories which
                                                                    ment in their readers’ reactions to them. We propose that
Copyright c 2018, Association for the Advancement of Artificial     these high consensus purple stories could be recommended
Intelligence (www.aaai.org). All rights reserved.                   to both red and blue users, evoking a more unified response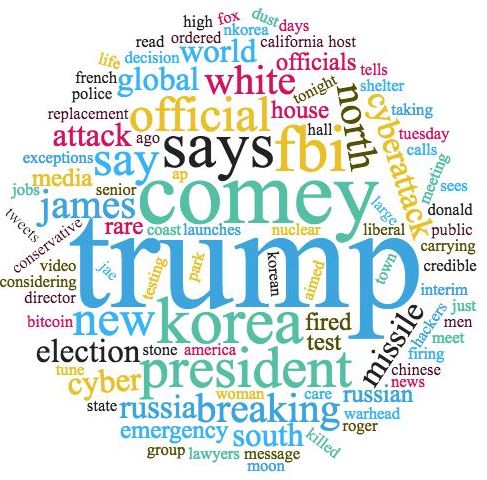
across society, which we hope might lead to lower segrega-                             Fox News: @seanhannity: “The real reason that
                                                                      Red Posts
tion in information consumption (Chakraborty et al. 2017),                             President #Trump fired James Comey is be-
                                                                                       cause the former @FBI Director was incompe-
and might help to promote greater understanding and cohe-
                                                                                       tent.”. https://t.co/YlP6SLOfgw
sion among people. In Table 1, we show a sample of red,                                Fox News: @POTUS: “All of the
blue and purple news stories about the dismissal of FBI di-                            Democrats, I mean, they hated Jim Comey.
rector James Comey by President Trump, to highlight the                                They didn’t like him, they wanted him
differences between the three types of stories.1                                       fired”.https://t.co/1ebOtqfIOc
Given this context, we investigate the following questions:                            Salon: Comey firing coverage shows right-
                                                                     Blue Posts
                                                                                       wing media has lost it’s grip on reality
1. How can we define the consensus of news posts in order to                           https://t.co/DC6cAYEDoX
   operationalize the identification of high consensus purple                          CNN: Pres. Trump’s firing of FBI Direc-
   posts?                                                                              tor James Comey is a “grotesque abuse of
                                                                                       power,” legal analyst Jeffrey Toobin says
2. Do helpful purple news posts exist on social media?                                 http://cnn.it/2q1FQd4
                                                                                       NYTimes: He was fired by President
3. How do purple posts compare with low consensus (blue             Purple Posts
                                                                                       Trump. Where does James Comey go next?
   or red only) posts?                                                                 https://t.co/loXwc5aNFd
4. Can we automate the identification of consensus of news                             Politico: What happens to Comey’s inves-
   posts on social media in order to discover purple posts?                            tigative files that have already been gath-
                                                                                       ered? A former FBI special agent weighs
                                                                                       in.politi.co/2qbBJfj
Contributions
                                                                   Table 1: Sample “red”, “blue” and “purple” news posts about
1. We begin by defining and operationalizing the concept of        the event of FBI director James Comey’s dismissal by Pres-
   consensus of news posts in terms of general agreement in        ident Trump.
   readers’ reactions.
                                                                     Our work provides a fresh tool which we hope will help to
2. We use human judgments to generate a ground truth               break filter bubbles, encourage healthier interaction between
   dataset of high and low consensus news posts on social          population subgroups, and lead to a more cohesive society.
   media, and observe that a substantial amount of high con-
   sensus purple posts are posted by news publishers on so-
   cial media (perhaps surprisingly, even by politically ex-              Consensus Definition and Measurement
   treme publishers).                                              A key step of our work consists of understanding if there are
                                                                   news posts with high consensus in social media. To verify
3. We empirically analyze the properties of high and low
                                                                   that, first we need to operationalize the concept of ‘consen-
   consensus posts, finding that both types of tweets are
                                                                   sus’ for news posts, that is, to provide a definition for con-
   equally popular with users (i.e., garner similar number of
                                                                   sensus that allows one to measure it, both empirically and
   retweets) and also cover similar topics. Further, we ob-
                                                                   quantitatively. Second, we need to construct ground truth
   serve that high consensus purple posts tend to provide
                                                                   datasets to measure consensus of real news posts in social
   more cross-cutting exposure to views than low consensus
                                                                   media. Next, we describe how we performed these steps.
   posts.
                                                                   Operationalizing consensus for news posts
4. To identify high consensus purple news posts automati-          According to the Oxford English Dictionary, consensus is
   cally, we propose a novel class of features of social media     defined as “a general agreement”.2 Inspired by this defini-
   posts on Twitter, which we term audience leaning based          tion, we consider a post to have high consensus if there is
   features. These features describe the distribution of the       a general agreement in readers’ reaction to it, irrespective
   political leanings of audience subgroups interacting with       of their own political leaning. Particularly, in the context of
   a post – namely the retweeters and repliers of a post. In-      US politics, a post would have high consensus if the reaction
   tuitively, retweeters are more likely to be supportive of it,   of democrat readers to the post is similar to the reaction of
   while repliers have a higher likelihood of opposing it. Ad-     republican readers. For a given social media post, we mea-
   ditionally, the followers of the publisher of the post also     sure the reaction of democrats and republicans as whether
   form a passive audience subgroup for the post. We use           the readers agree or disagree with the content of a post. For-
   these audience leanings as features to capture the degree       mally, we measure the amount of consensus as,
   of consensus that a social media post is likely to have. We
   present an evaluation showing that our proposed features                                     #Ddisagree   #Rdisagree
   are well suited to help identify high and low consensus                  consensus = 1 − |              −            |        (1)
                                                                                                  #D           #R
   tweets automatically with high accuracy, leading to sig-
   nificantly better performance than can be achieved using        where #Ddisagree and #Rdisagree respectively denote the
   previously proposed publisher based and content based           number of democrats and republicans who disagree with the
   features.                                                       post, while #D and #R are the total number of democrats
    1                                                                 2
        See en.wikipedia.org/wiki/Dismissal of James Comey.               See en.oxforddictionaries.com/definition/consensus.
1
Blue Feed, Red Feed dataset
0.8 Twitter dataset
0.6
CDF
0.4
0.2
0
0 0.2 0.4 0.6 0.8 1
Consensus score
Figure 1: Distribution (CDF) of consensus values of news
posts from the two datasets.
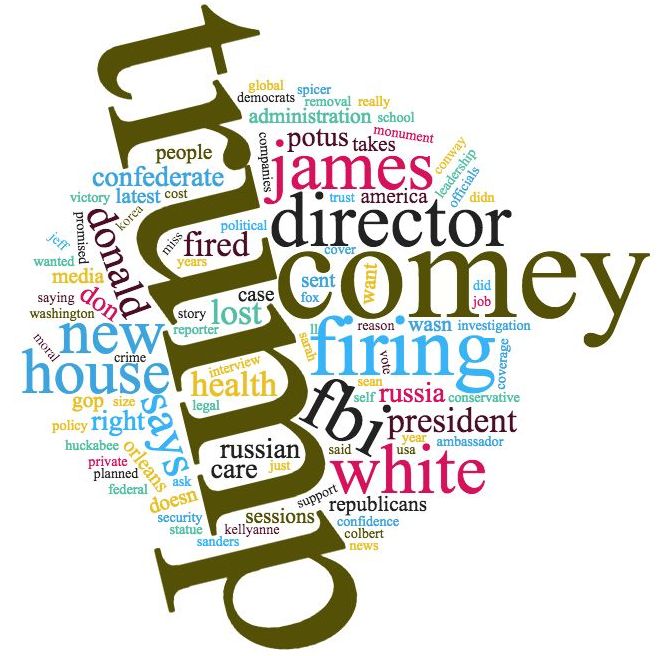
(A) Low consensus tweets (B) High consensus tweets
and republicans.3 A consensus value closer to 1 indicates Figure 2: Topical coverage of low & high consensus tweets.
that both democrats and republicans disagreed with it to sim-
ilar extents, thereby indicating high consensus; while a value extremely biased news outlets tend to pick lower consen-
closer to 0 is indicative of low consensus for the post. sus content which makes readers with different leanings re-
Measuring consensus of news posts on social media act differently to it. In this paper, we argue for presenting
high consensus news posts for increasing exposure to ideo-
Using our definition of consensus, we conducted an Amazon
logically cross-cutting content, which can potentially lead to
Mechanical Turk (AMT) experiment to quantify the consen-
lower societal polarization.
sus of two distinct datasets of news posts:
(i) Blue Feed, Red Feed dataset - Using Wall Street Journal’s
‘Blue Feed, Red Feed’ system (Keegan 2017), we collected Empirical Study of Consensus of News Posts
the top 10 posts each from the liberal and conservative sides Given that news posts with high consensus do exist, next we
for the queries “trump” and “healthcare”, giving us a total of conduct an empirical study on consensus of news posts on
40 news posts. social media. Our main goal in this section is to understand
(ii) Twitter dataset - We also collected 40 news posts tweeted whether news posts with high consensus are interesting to
by each of the following 10 news publishers with well users (i.e., do they get popular), whether they cover a wide
known political biases varying from liberal to neutral to con- range of topics, and whether they expose users to relatively
servative: Slate, Salon, New York Times, CNN, AP, Reuters, more cross-cutting content. We refer to the 100 news posts
Politico, Fox News, Drudge Report, and Breitbart News, with the highest consensus values in our ground truth Twitter
giving us a total of 400 posts. These news posts were col- dataset as high consensus news posts, and the 100 tweets
lected during the one week period of 9th to 15th May, 2017. with lowest consensus values as low consensus news posts.
In this experiment, we only recruited AMT workers from
the US and at the end of the experiment, we also collected To what extent do high and low consensus news posts get
their political leanings. We showed every news post to work- popular? To measure the popularity, we count the number
ers and asked them for their reaction to the post by select- of retweets for high and low consensus tweets. On average,
ing one out of three options – agreement, neutral or dis- high consensus tweets are retweeted 158 times, whereas, low
agreement. After the experiment, applying Equation 1 to re- consensus tweets are retweeted 177 times. So, although a
sponses from equal number (seven) of democratic and re- typical high consensus tweet tends to be retweeted slightly
publican AMT workers, we computed the consensus values lesser than a typical low consensus tweet, both their aver-
for the news posts in our two datasets. age retweets are in the same order of magnitude. We ob-
serve a similar pattern when we compare the median num-
Figure 1 shows the distribution (CDF) of consensus val-
ber of retweets of high consensus tweets (93) with low con-
ues for the news posts from our datasets. From the figure, we
sensus tweets (89), indicating that both high and low con-
can notice that news posts from the ‘Blue Feed, Red Feed’
sensus tweets engage their readers to similar extents. There-
dataset are skewed more towards lower values of consen-
fore, recommendation systems which highlight high consen-
sus, indicating that the readers from the two different parties
sus tweets would feature as popular content as those systems
have different reactions to them. While, the random news
which highlight low consensus tweets.
posts from the 10 publishers from the Twitter dataset have a
noticeable skew towards higher consensus posts. These ob- Do high and low consensus news posts cover different
servations indicate that while news outlets on social media topics? To verify whether high and low consensus tweets
do publish posts with varying degrees of consensus, systems cover similar (or very different) topics, we present the 100
such as ‘Blue Feed, Red Feed’, which highlight posts from most common words for both sets of tweets in Figure 2.
From the figure, it is evident that although both sets do cover
3
Considering the fraction of readers from each side who dis- popular political topics (e.g. ‘Trump’, ‘Comey’, ‘FBI’), high
agree with a post implicitly takes into account the fraction of read- consensus tweets are topically more diverse and also contain
ers who have neutral or favorable reactions to it. posts on non-US centric political topics (e.g. ‘north korea’)Feature Category Features 20
Number of followers/friends/tweets 14 Retweeters Retweeters
12 Repliers Repliers
Publisher based Average number of retweets/replies/favorites Followers 15 Followers
Political leaning, Language, Location 10
8
PDF
PDF
Bag of words, Creation time 10
Tweet based 6
Number of retweets/replies/favorites
4 5
2
Table 2: Features used in prior work. The three most impor- 01.0 01.0
0.5 0.0 0.5 1.0 0.5 0.0 0.5 1.0
tant features from each category are highlighted in blue. Political leaning Political leaning
@CNN You mean, like the UNFOUNDED claims of Russian (A) High consensus tweet (B) Low consensus tweet
collusion? You people are typically selective in your bias pro?
https://t.co/CESkVpIZOk Figure 3: Distributions of political leanings of different au-
@nytimes His actions were disgraceful. Being fired does not diences for the following news posts: (A) High consensus:
make him a sympathetic figure. He affected the outcome? “Trump ordered emergency meeting after global cyber attack: of-
https://t.co/bIbiuj2CJJ ficial http://reut.rs/2r6Qkt8” posted by Reuters, (B) Low consen-
@BreitbartNews I just wonder, what motivates these libtards... sus: “Michelle Obama criticizes Trump administration’s school
https://t.co/mzpBIKdPr4 lunch policy http://cnn.it/2qckHwZ” posted by CNN .
@CNN hey fakenews do some homework, get out of office!
Every illegal that get a drivers license is registered to vote dem! Category Features
I’d card, regs! # Dem/Rep/Neu, Sum/Avg/Median/Skew of PL
@AP Jews are so desperate to take over Syria that they will Followers
Sum(PL) of Dem/Rep/Neu, PLD
make up anything. # Dem/Rep/Neu, Sum/Avg/Med/Skew of PL
Sum(PL) of Dem/Rep/Neu, PLD of baseline
Retweeters
Table 3: Random sample of replies for tweets in our dataset. Avg #Dem/Rep/Neu in baseline, PLD
χ2 Distance bw PLD[Retweeters] of tweet & baseline
# Dem/Rep/Neu, Sum/Avg/Med/Skew of PL
and other more niche topics (e.g. ‘jobs’, ‘cyberattack’).4 Sum(PL) of Dem/Rep/Neu, PLD of baseline
Repliers
Avg #Dem/Rep/Neu in baseline, PLD
Do high consensus posts lead to more exposure to ide- χ2 Distance bw PLD[Repliers] of tweet & baseline
ologically cross-cutting content? To investigate whether χ2 Distance bw PLD[Repliers] and PLD[Retweeters]
highlighting high consensus tweets leads to higher expo- Combination χ2 Distance bw PLD[Repliers] and PLD[Followers]
sure to ideologically cross-cutting contents, we examine χ2 Distance bw PLD[Retweeters] and PLD[Followers]
whether the higher consensus tweets have relatively more
retweets from the users of opposite leaning (with respect to Table 4: Audience leaning based features. In the table, Dem,
the publisher’s leaning), when compared to lower consensus Rep, and Neu denote Democrat, Republican, and Neutral re-
tweets. This analysis is motivated by the reasoning that as spectively, PL denotes political leaning, and PLD denotes
users from opposite leaning retweet the publisher’s tweets, the distribution of political leanings. Baselines are computed
more opposite leaning users from these users’ neighbor- by taking average of PLD across all tweets. Most important
hoods would get exposed to them, leading to higher expo- features are highlighted in blue.
sure to cross-cutting content for users, and potentially lower
polarized news consumption on social media.
To validate whether our reasoning holds, we consider a identifying high and low consensus news posts, which can
particular tweet to have high cross-cutting exposure, if the scale up to cover a large number of news publishers on Twit-
number of opposite leaning retweeters for this tweet are ter. In this section, we first briefly discuss different features
higher than the baseline number of opposite leaning retweet- of social media posts that have been applied in prior predic-
ers of it’s publisher (computed as the average across random tion and classification tasks. Then, we propose and validate
100 tweets of the publisher). When we rank the tweets by a novel class of audience leaning based features which are
their consensus values and compare the top and bottom 10% ideally suited for our consensus identification task.
tweets, we find that a much larger fraction of the high con-
sensus tweets (45%) have high cross-cutting exposure than Features used in prior work
low consensus tweets (30%), indicating that high consensus The prior work on classification and prediction tasks for so-
tweets indeed lead to higher exposure to cross-cutting con- cial media posts has mostly used two broad types of features:
tent. publisher based, and tweet based features. For instance, the
political leaning of the publisher has been used to quantify
Identifying High and Low Consensus News the tweet’s leaning (Kulshrestha et al. 2017), or the lean-
Posts on Social Media ing of news story URLs being shared by them on Face-
After empirically exploring the consensus of social media book (Bakshy, Messing, and Adamic 2015). Others have
news posts, we now turn our attention towards automatically used tweet based features for predicting the relevance of a
tweet for a topic (Tao et al. 2012), to rank tweets (Duan et
4
FBI director James Comey’s dismissal by President Trump al. 2010), or to quantify to what extent a tweet is interest-
was a major event that occurred during our data collection period: ing (Naveed et al. 2011). Many other studies have combined
en.wikipedia.org/wiki/Dismissal of James Comey. both publisher and tweet based features for various tasks in-1 1 1
0.8 0.8 0.8
0.6 0.6 0.6
CDF
CDF
CDF
0.4 0.4 0.4
0.2 High Consensus tweets 0.2 High Consensus tweets 0.2 High Consensus tweets
Low Consensus tweets Low Consensus tweets Low Consensus tweets
0 0 0
0 0.2 0.4 0.6 0.8 1 0 0.2 0.4 0.6 0.8 1 0 0.2 0.4 0.6 0.8 1
Χ2 Distance bw PLD[Repliers] and PLD[Retweeters] Χ2 Distance bw PLD[Followers] and PLD[Retweeters] Χ2 Distance bw PLD[Repliers] of tweet baseline
(A) χ2 Distance between PLD[Retweeters] (B) χ2 Distance between PLD[Retweeters] (C) χ2 Distance between PLD[Repliers] &
& PLD[Repliers] & PLD[Followers] publisher baseline PLD[Repliers]
Figure 4: Distributions of χ2 distance between different audience political leaning distributions for 25% tweets with highest
and lowest consensus values.
cluding predicting future retweets (Petrovic, Osborne, and distributions are much more similar than for the low con-
Lavrenko 2011; Suh et al. 2010), and even predicting users’ sensus tweet. More interestingly, retweeters typically being
personality traits (Golbeck, Robles, and Turner 2011). Ta- supporters, have similar political leaning distribution as the
ble 2 shows the features from each class which we are aware followers of the publishers (for both types of posts). How-
were used previously. ever, for a lower consensus post, repliers being opposers,
have a different distribution. Therefore, we find that the de-
Our proposed audience leaning based features gree of similarity of the leaning distributions of the audi-
ences of the post contains a useful signal to approximate
We propose a novel class of audience leaning based fea- the consensus for a post (i.e., the similarity in reaction of
tures, which to our knowledge have not previously been used readers of different leanings). We compute the χ2 distances
for predicting and classifying tweet properties. We use these between the leaning distributions of the different audiences
features to identify high and low consensus news posts on to capture their similarities. In Figure 4, we show the dis-
Twitter. tribution of these χ2 values for high and low tweets. The
For every tweet, there are three types of audience: difference in the distributions for the high and low consen-
(i) Followers of the publisher of the tweet – they are the pas- sus posts give evidence for the discriminative power of these
sive supporters of the post (on average 67% of followers are features. Building upon these observations, we construct a
of the same political leaning as the publisher), number of audience leaning based features by utilizing the
(ii) Retweeters of the tweet – they are more active support- political leanings of the three types of audiences of a tweet.
ers of the post (on average 78% of retweeters are of the same Table 4 lists all such features, which we use in this work.
leaning as the publisher), and
(iii) Repliers to the tweet – they are usually a mix of users Experimental Evaluation
supporting or opposing the news post (on average 35% of
followers are of the opposite leaning to the publisher). In We begin by describing our experimental setup and then
Table 3, we show a random sample of replies from our Twit- present our experimental results for the aforementioned cat-
ter dataset, and we notice that many of them are opposing egories of features.
either the news content or the publisher. Experimental setup: In this section, we use supervised
We hypothesize that we can use the political leaning learning approaches to identify whether a news tweet has
distributions of the three audiences of a post to quantify high consensus or low consensus using the features de-
whether different readers of a post are having similar reac- scribed in the previous section. For setting up the classifiers,
tions to it (i.e., to measure consensus). To demonstrate our we first need a ground truth dataset of high and low con-
hypothesis, we select one high consensus and one low con- sensus tweets. We use the consensus values computed using
sensus post for which we computed consensus values using AMT workers’ judgements for the Twitter dataset described
AMT workers’ judgments, and then computed the political previously and label the top 25% consensus value tweets as
leaning distributions of the three audiences. high consensus, and bottom 25% tweets as low consensus
Inferring political leaning of Twitter users is a research tweets. We use this set of 200 labeled tweets as our ground
challenge on its own, and beyond the scope of this work. truth dataset.
We adopt the methodology proposed in (Kulshrestha et al. Using the features described earlier, we apply four differ-
2017), which returns the political leaning of a Twitter user ent types of supervised learning classifiers for our task of
in the range [−1.0, 1.0], with scores in [−1.0, −0.03) indi- tweet consensus classification: Linear SVM, Naive Bayes,
cating Republican leaning, [−0.03, 0.03] indicating neutral Logistic Regression and Random Forest classifiers. While
and (0.03, 1.0] indicating Democrat leaning. In Figure 3, we using textual features of the tweets, we follow a two step
plot the political leaning distributions of the three audiences, approach as described in (Chakraborty et al. 2016): (i) first,
for a high consensus and a low consensus post. we treat the textual features as bag-of-words and use Naive
We can observe that there is a striking difference between Bayes classifier to predict the class using these textual fea-
the audience leaning distributions of high and low consen- tures, and (ii) then we input these prediction outputs of
sus tweets in Figure 3. For the high consensus tweet, these Naive Bayes classifier as features (along with our other fea-Different feature categories
Classifier
Publisher based (P) Tweet based (T) P and T Audience leaning based (A) P, T, and A
Logistic Regression 0.58 ±0.008 0.58 ±0.008 0.68 ±0.009 0.72 ±0.012 0.72 ±0.011
Linear SVM 0.58 ±0.008 0.58 ±0.008 0.68 ±0.009 0.72 ±0.012 0.72 ±0.011
Naive Bayes 0.59 ±0.007 0.57 ±0.015 0.60 ±0.01 0.66 ±0.015 0.66 ±0.012
Random Forest 0.58 ±0.008 0.57 ±0.01 0.64 ±0.01 0.67 ±0.015 0.67 ±0.017
Table 5: Average accuracies and 90% confidence intervals for different categories of features used for predicting consensus of
news tweets. Our proposed audience leaning based features perform best for this news post consensus classification task.
tures) to the different classifiers as the second step. Conclusion
For training our classifiers, we use 5-fold cross-validation. To minimize the possibility of social media users getting
In each test, the original sample is partitioned into 5 sub- trapped in ‘echo chambers’ or ‘filter bubbles’, prior works
samples, out of which 4 are used as training data, and the have proposed to introduce diversity in the news that users
remaining one is used for testing the classifier. The process are consuming (Munson, Lee, and Resnick 2013; Park et al.
is then repeated 5 times, with each of the 5 sub-samples 2009; Keegan 2017). Often, such approaches which high-
used exactly once as the test data, thus producing 5 results. light the most belief challenging news, increase the chances
The entire 5-fold cross validation was then repeated 20 times of users rejecting them, thereby defeating the original pur-
with different seeds used to shuffle the original dataset, thus pose (Munson and Resnick 2010; Lord and Ross 1979;
producing 100 different results. The results reported are av- Miller et al. 1993; Munro and Ditto 1997). In this paper,
erages of the 100 runs, along with the 90% confidence in- we propose a complementary approach to inject diversity in
terval. Also, we use feature ranking with recursive feature users’ news consumption by highlighting news posts which
elimination that prunes out the insignificant features by ob- evoke similar reactions from different readers, irrespective
taining their importance from the supervised techniques.5 of their own political leanings.
Experimental results: We successively implemented the Towards that end, to our knowledge, we made the first at-
different classifiers first using features from each category tempt to define and operationalize consensus of news posts
separately, and then by combining the features from differ- on social media. Subsequently, we compared several prop-
ent categories, and their accuracies are shown in Table 5. erties of high and low consensus news posts and found them
We observe that the tweet based features have the worst per- to be equally popular, and covering similar topics. Addition-
formance. This poor performance is most likely due to the ally, we observed that high consensus posts lead to higher
short size of the tweets, which often means that there is very cross-cutting exposure for the users. Next, utilizing our pro-
little information in the tweet text and it is hard to under- posed novel class of audience leaning based features, we de-
stand them without also inspecting the content of weblink, veloped a method to automatically infer the consensus of
photograph or video included in the tweet. The performance news posts on Twitter.
of publisher based features is better than that of tweet based Finally, using our proposed consensus inference method,
features. The political leaning of the publisher is found to we publicly deployed “Purple Feed” – a system which high-
be the most important feature for this category, and while it lights high consensus posts from different news outlets on
helps, it does not perfectly capture the notion of consensus. Twitter. With “Purple Feed”, the users can view the high
When we combine publisher and tweet based features, there consensus tweets posted by both republican-leaning and
is improvement in performance. democratic-leaning media outlets during the last one week.6
Next, we examine the performance of our proposed audi- Users can also view both high and low consensus posts
ence leaning based features and find it to perform the best posted by individual publishers.7
amongst the three categories of features. Digging deeper, In future, we plan to conduct a large scale characteriza-
we find that we correctly classified 74% of high consensus tion study of news posts and publishers on social media, as
tweets and 70% of low consensus tweets. We find χ2 dis- well as, evaluate the impact of showing high consensus news
tance between the repliers’ and retweeters’ leaning distribu- posts on the users. We believe that our work on identifying
tion to be the most important feature, matching the intuition high consensus news posts could be integrated with differ-
we built earlier in the paper. In fact, even when we com- ent information retrieval mechanisms on social media, and
bine the three categories of features, we do not find a per- could be useful for designing mechanisms for mitigating fil-
formance gain over using the audience leaning based fea- ter bubble and echo chambers, for reducing fragmentation
tures alone. This is because when we inspect the 10 most in news consumption, and for encouraging healthy debate
important features out of all the categories, the top 7 most on diverse issues on social media platforms.
important features (highlighted in Table 4 in blue) are from
our proposed category of audience leaning based features,
highlighting how ideally suited they are for our consensus 6
identification task. Available at http://twitter-app.mpi-sws.org/purple-feed/.
7
For instance, high and low consensus tweets posted by
5
See http://scikit-learn.org/stable/modules/generated/sklearn. New York Times can be viewed at: http://twitter-app.mpi-
feature selection.RFE.html. sws.org/purple-feed/app-tweet-1.php?query=NYTimes.References Munson, S. A., and Resnick, P. 2010. Presenting diverse Bakshy, E.; Messing, S.; and Adamic, L. A. 2015. Expo- political opinions: How and how much. In Proceedings of sure to ideologically diverse news and opinion on facebook. the SIGCHI Conference on Human Factors in Computing Science 348(6239):1130–1132. Systems, CHI ’10, 1457–1466. New York, NY, USA: ACM. Bozdag, E. 2013. Bias in algorithmic filtering and personal- Munson, S.; Lee, S.; and Resnick, P. 2013. Encouraging ization. Ethics and Information Technology 15(3):209–227. reading of diverse political viewpoints with a browser wid- Chakraborty, A.; Paranjape, B.; Kakarla, S.; and Ganguly, N. get. In Proceedings of the 7th International Conference on 2016. Stop clickbait: Detecting and preventing clickbaits in Weblogs and Social Media, ICWSM 2013, 419–428. Boston, online news media. In 2016 IEEE/ACM International Con- USA: AAAI press. ference on Advances in Social Networks Analysis and Min- Naveed, N.; Gottron, T.; Kunegis, J.; and Alhadi, A. C. 2011. ing (ASONAM). San Francisco, CA, USA: IEEE. Bad news travel fast: A content-based analysis of interest- Chakraborty, A.; Ali, M.; Ghosh, S.; Ganguly, N.; and Gum- ingness on twitter. In Proceedings of the 3rd International madi, K. P. 2017. On quantifying knowledge segregation in Web Science Conference, WebSci ’11, 8:1–8:7. New York, society. arXiv preprint arXiv:1708.00670. NY, USA: ACM. Duan, Y.; Jiang, L.; Qin, T.; Zhou, M.; and Shum, H.-Y. Pariser, E. 2011. The Filter Bubble: What the Internet Is 2010. An empirical study on learning to rank of tweets. In Hiding from You. Penguin Group. Proceedings of the 23rd International Conference on Com- Park, S.; Kang, S.; Chung, S.; and Song, J. 2009. News- putational Linguistics, COLING ’10, 295–303. Strouds- cube: delivering multiple aspects of news to mitigate media burg, PA, USA: Association for Computational Linguistics. bias. In Proceedings of the SIGCHI Conference on Human Flaxman, S.; Goel, S.; and Rao, J. M. 2016. Filter bub- Factors in Computing Systems, 443–452. ACM. bles, echo chambers, and online news consumption. Public Petrovic, S.; Osborne, M.; and Lavrenko, V. 2011. Rt to win! Opinion Quarterly 80(S1):298–320. predicting message propagation in twitter. In Proceedings of Golbeck, J.; Robles, C.; and Turner, K. 2011. Predicting the International AAAI Conference on Web and Social Me- personality with social media. In CHI ’11 Extended Ab- dia, ICWSM’11. Oxford, UK: The AAAI Press. stracts on Human Factors in Computing Systems, CHI EA Schkade, D.; Sunstein, C. R.; and Hastie, R. 2007. What ’11, 253–262. New York, NY, USA: ACM. happened on deliberation day? California Law Review Keegan, J. 2017. Blue feed, red feed - see lib- 95(3):915–940. eral facebook and conservative facebook, side by side. Shoemaker, P. J.; Vos, T. P.; and Reese, S. D. 2009. Jour- http://graphics.wsj.com/blue-feed-red-feed/. nalists as gatekeepers. The handbook of journalism studies Kulshrestha, J.; Eslami, M.; Messias, J.; Zafar, M. B.; 73. Ghosh, S.; Gummadi, K. P.; and Karahalios, K. 2017. Quan- Suh, B.; Hong, L.; Pirolli, P.; and Chi, E. H. 2010. Want tifying search bias: Investigating sources of bias for political to be retweeted? large scale analytics on factors impacting searches in social media. In Proceedings of the 2017 ACM retweet in twitter network. In Proceedings of the 2010 IEEE Conference on Computer Supported Cooperative Work and Second International Conference on Social Computing, SO- Social Computing, CSCW ’17, 417–432. New York, NY, CIALCOM ’10, 177–184. Washington, DC, USA: IEEE USA: ACM. Computer Society. Lichterman, J. 2010. New Pew data: More Amer- Sunstein, C. R. 2002. The law of group polarization. Journal icans are getting news on Facebook and Twitter. of Political Philosophy 10(2):175–195. http://tinyurl.com/News-on-Social-Media. Tao, K.; Abel, F.; Hauff, C.; and Houben, G.-J. 2012. What Liu, Z., and Weber, I. 2014. Is twitter a public sphere for makes a tweet relevant for a topic? In #MSM- Workshop on online conflicts? a cross-ideological and cross-hierarchical Making Sense of Microposts, volume 838 of CEUR Work- look. In International Conference on Social Informatics, shop Proceedings, 49–56. CEUR-WS.org. 336–347. Springer. Teevan, J.; Ramage, D.; and Morris, M. R. 2011. # twit- Lord, C. G., and Ross, L. 1979. Biased assimilation and tersearch: a comparison of microblog search and web search. attitude polarization: The effects of prior theories on sub- In WSDM ’11 Proceedings of the fourth ACM international sequently considered evidence. Journal of Personality and conference on Web search and data mining, 35–44. Hong Social Psychology 2098–2109. Kong, China: ACM. Miller, A. G.; McHoskey, J. W.; Bane, C. M.; and Dowd, T. G. 1993. The attitude polarization phenomenon: Role of response measure, attitude extremity, and behavioral conse- quences of reported attitude change. Journal of Personality and Social Psychology 64(4):561. Munro, G. D., and Ditto, P. H. 1997. Biased assimilation, attitude polarization, and affect in reactions to stereotype- relevant scientific information. Personality and Social Psy- chology Bulletin 23(6):636–653.
You can also read