The Initial Impacts of the COVID-19 Pandemic on Ireland's Labour Market
←
→
Page content transcription
If your browser does not render page correctly, please read the page content below
The Initial Impacts of the COVID-19
   Pandemic on Ireland’s Labour Market

    Working Paper

    May 2020

This paper has been prepared by IGEES staff in the
Department    of   Employment    Affairs   and   Social
Protection. The views presented in this paper do not
represent the official views of the Department or
Minister for Employment Affairs and Social Protection.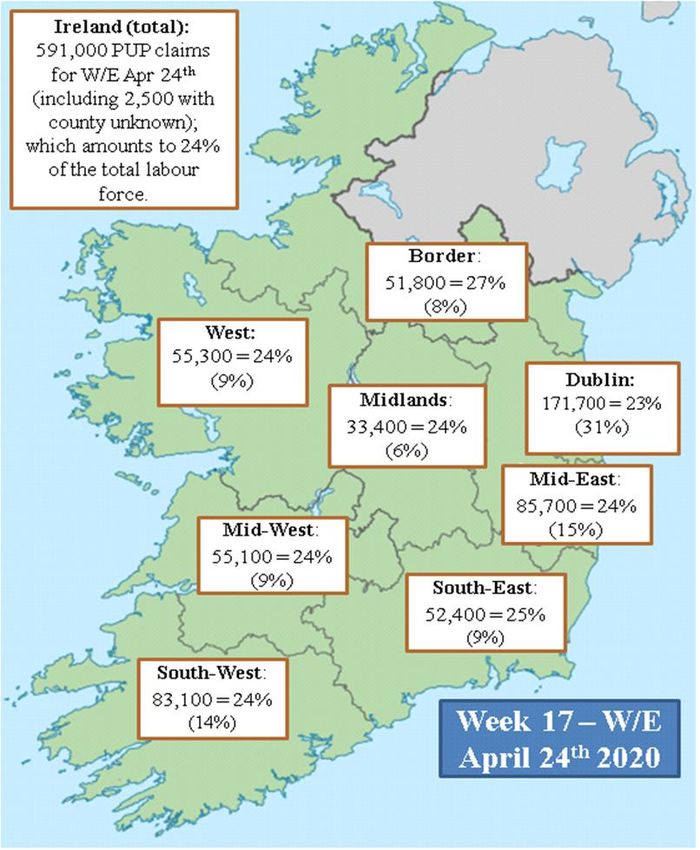
1
Authors :

Department of Employment Affairs and Social Protection: Dermot Coates*, Dermot Corcoran,
Hugh Cronin* and Ailbhe Brioscú*

and

Central Bank of Ireland: Stephen Byrne, Enda Keenan & Tara McIndoe-Calder

Disclaimer: The views expressed herein are those of the authors and do not reflect the views of the
Department of Employment Affairs and Social Protection, the Central Bank of Ireland or the European
System of Central Banks. All errors are our own.

This paper is also published (in abridged form) by the Central Bank of Ireland as ‘The Initial Labour
Market        Impact       of      COVID-19’.          Economic         Letters.       Vol       2020,       No.      4
(www.centralbank.ie/publication/economic-letters)

Acknowledgements: The authors would like to thank Frank Humphreys*, Louise Kavanagh and
Michelle Reilly for their assistance.

We also acknowledge the helpful comments received from the members of the Labour Market
Advisory Council (see: Annex) and Central Bank of Ireland colleagues John Flynn, Reamonn Lydon,
Gerard O’ Reilly and Mark Cassidy.

1
 Suggested citation: Coates, Byrne, Brioscú, Corcoran, Cronin, Keenan and McIndoe-Calder. Corresponding author:
dermot.coates@welfare.ie
* Members of the Irish Government Economic and Evaluation Service (IGEES).

                                                                                                                  Page 2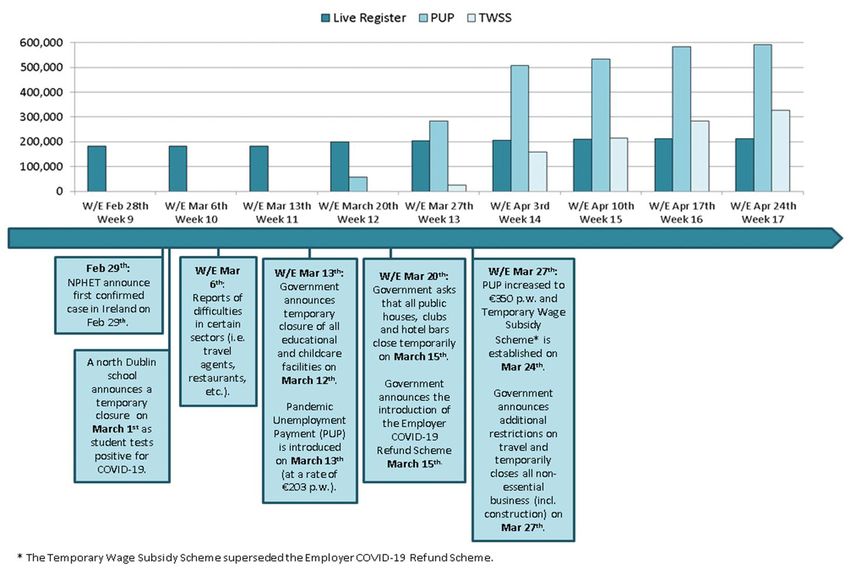
Abstract

This paper uses social security administration data to examine disruptions to Ireland’s labour
market – including the flows into unemployment – in the weeks since the initial COVID-19
pandemic outbreak in Europe.2 With that information, we examine alternative data sources to
profile these individuals and broader macroeconomic/sectoral, regional and demographic
impacts. This yields useful information for future work on aggregate/distributional impacts.

2
    Department of Employment Affairs and Social Protection administrative datasets

                                                                                       Page 3
1. Introduction and Context

The outbreak of the COVID-19 pandemic, and the essential public health measures to contain
the spread of the virus, have resulted in the largest monthly increase in unemployment in the
history of the State during March 2020.3 By the week ending April 24th, there were more than
1.1m persons in receipt of State support interventions to the labour market, including those on
the Live Register and those in receipt of the newly introduced Pandemic Unemployment
Payment (PUP) and the Temporary Wage Subsidy Scheme (TWSS). In addition, there was an
increase in those availing of short-time working arrangements. While there have been job
losses in all sectors, individuals working in tourism, hospitality, food and retail have seen the
largest job losses.

The hit to these sectors will be potentially long lasting for two reasons. First, they are
dependent on international travel which is likely to be subject to restrictions and an
abundance of caution until the virus has abated entirely. Second, domestic consumers are
likely to curtail demand for social activities for a similar time. Other sectors, such as
construction have closed for the duration of the current lockdown measures.                                             The
concentration of job losses in these sectors means that the impact has disproportionately
fallen on lower income individuals, younger workers and migrant workers.

This Working Paper describes the impact of the COVID-19 pandemic on the labour market in
Ireland using a variety of rich data sources.4 First, we trace the characteristics of those who
have been laid-off from their jobs in each of the six weeks to April 24th 2020.5 Second, we
examine the demographic and earnings profile of the sectors experiencing the highest share of
COVID-19 related unemployment. Third, we assess the financial position of households in
the most affected sectors.

3
    This refers to the CSO’s ‘COVID-19 Adjusted Monthly Unemployment measure’
4
 See Berube and Bateman (2020), Bick and Blandin (2020) and Bell et al (2020) for similar analysis of the US and UK labour
markets
5
    We number the weeks sequentially such that the w/e 3rd January 2020 is ‘Week 1’ and w/e 24th April is ‘Week 17’

                                                                                                                      Page 4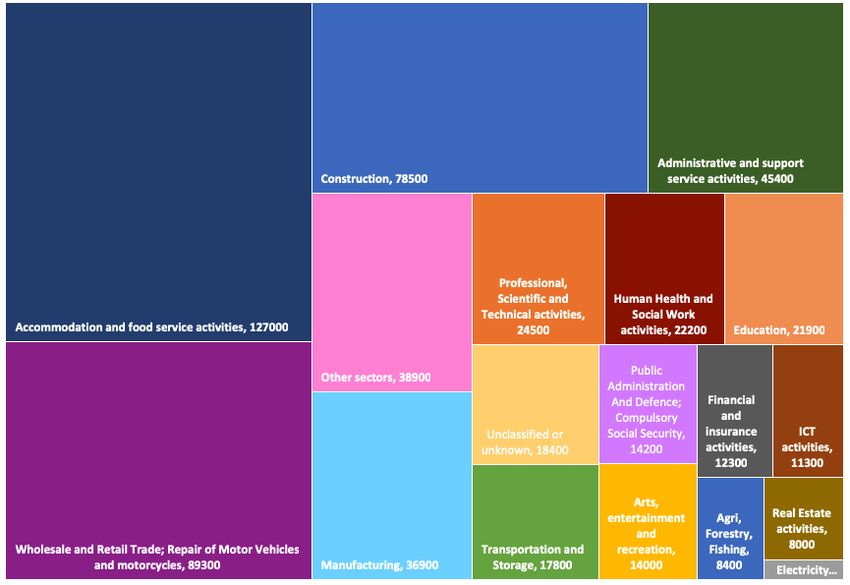
2. Stylised Facts

The Labour Market before COVID-19

Prior to the outbreak, conditions in the Irish labour market were close to full employment6 7.
Over 2.36 million people were in employment, and the unemployment rate fell to 4.7 per cent
in the fourth quarter of 2019. Since the implementation of public health measures requiring
the closure of all non-essential businesses, approximately 591,000 people have been laid-off
and are in receipt of the Pandemic Unemployment Payment (PUP) support, administered by
the Department of Employment Affairs and Social Protection (DEASP).

The PUP is a €350 per week payment available to workers who were laid-off on or after
March 13th due to the pandemic. The take-up of this payment is distributed across all sectors
of the labour market. Nonetheless, it is clear that approximately half of recipients had
previously worked in three principal sectors: Accommodation and Food Services; Wholesale
and Retail; and Construction (Figure 1).

Job Losses Came in Waves

Overall, the job losses have been largest in sectors where economic activity is rendered
impossible because of public health measures and social distancing guidelines (Figure 1). On
March 12th, schools, pre-schools and further and higher education settings were instructed to
close (initially for the period until March 29th). Pubs were advised to close on March 15th,
while the decline in international (and indeed domestic) travel has affected the
accommodation and hospitality sector.8 9

6
    See Byrne and McIndoe-Calder (2019).
7
    Ireland’s February 2020 unemployment rate was 4.8 per cent compared to an EU27 average of 6.5 per cent.

8
    Pubs asked to close on Sunday 15th March
9
    Hotel Bookings ‘dry to a trickle’ Irish Times, 9th March 2020

                                                                                                              Page 5
Figure 1: Job Losses by Sector (with PUP support)
Source: Department of Employment Affairs and Social Protection.
Note: (i) Reference Period (Week 17); (ii) All figures are provisional only and are subject to revision.
The speed at which these jobs may be restored depends on a number of factors. At present,
almost all economic activity which requires a physical presence or social interaction has
ceased, with the exception of grocery and pharmacy retail which are deemed to be essential
services. When the most stringent lockdown measures are lifted, some sectors will be able to
return to work, albeit with significant restrictions to adhere to social distancing guidelines.
Other sectors will continue to be affected after the mandatory stay at home order is lifted.
By examining the weekly social security administrative data, we can make an estimate of
which sectors have closed because of consumer caution relating to the virus, and which are a
result of Government mandated closures. Figure 2 shows the accumulated number of
recipients of the various supports – including the PUP – at the end of each week in March and
April. By the end of Week 12 (w/e March 20th), there were almost 60,000 workers in receipt
Page 6of the PUP including more than 20,000 individuals who had already lost their jobs in the
Accommodation and Food Services sector. At this point, the only Government public health
measure in place was the closure of schools and childcare facilities on March 12th. However,
worldwide travel advisories had been put in place by many countries in the week preceding
this, resulting in many firms laying off workers. Indeed, within the first two weeks of PUP
support, the Accommodation and Food Services sector accounted for 30.7 per cent of
recipients.
As citizens were advised to avoid indoor gatherings and maintain social distancing, footfall in
most retail outlets fell sharply. As a result, by the end of Week 13, and before the
announcement of the mandatory closure of non-essential businesses, the Wholesale and
Retail sector accounted for a further 15 per cent of recipients.
On March 27th, the Government announced the mandatory closure of all non-essential
business, and advised citizens that they should only leave their homes for essential trips. This
announcement resulted in a significant spike in PUP claims in the following week (Week 14).
The most significantly affected sector in this wave of job losses was construction. This sector
had been operational up until that point but this closed all sites (barring essential
infrastructure works) as of Monday March 30th. This announcement also resulted in the
closure of all non-essential retailers.
Page 7Figure 2: Timeline of Developments
Source: Department of Employment Affairs and Social Protection.
Note: All figures are provisional only and are subject to revision.
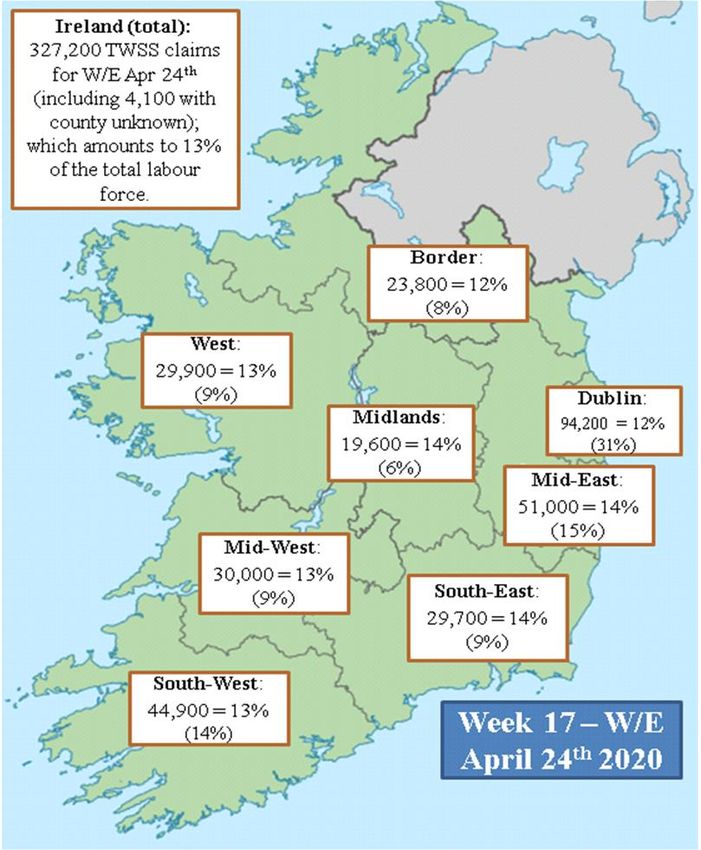
By April 24th, approximately 920,000 workers were availing of State support via either the
PUP or the TWSS.10 The sectoral and regional impact of the pandemic is illustrated in
Figures 3 and 4 below. For instance, approximately 92 per cent of the labour force in the
Accommodation and Food sector were in receipt of support through either of these measures,
with the PUP playing a particularly prominent role. In terms of Ireland’s overall labour force,
the Dublin region is the largest and accounted for 31 per cent of the total in late-2019.
Approximately, 1 in 3 of these individuals were in receipt of these two supports by April
2020. The figure is highest in the Border and South-East regions at approximately 40 and 39
per cent, respectively.
10
This is in addition to those on the Live Register and in receipt of either Jobseekers Benefit or Jobseekers Allowance.
Page 8Figure 3: Sectoral Distribution of Supports (PUP and TWSS) – W/E April 24th 2020
Source: Department of Employment Affaisr and Social Protection and Revenue data.
Note: All figures are provisional only and are subject to revision.
Figure 4: Distribution of new Supports (PUP and TWSS) by NUTS 3 Region
Source: Department of Employment Affairs and Social Protection and CSO LFS data.
Note: All figures are provisional only and are subject to revision. The figures following the equals sign shows scheme
recipients as a percentage of the regional labour force (as at 2019 Q4). The figures in parentheses denote the contribution
of a region to the total labour force of the country (as at 2019Q4).
Page 93. State supports – transmission channels through the
labour market
This section provides an overview of the various labour market interventions and stabilisation
measures introduced and the development of the uptake of these measures over the period
addressed here.
Pandemic Unemployment Payment (PUP)
The COVID-19 Pandemic Unemployment Payment (PUP) was initially launched on the 13th
March 2020. Over the following two weeks, there were 283,000 claimants in receipt of this
support.11 This is before the announcement of the more restrictive measures on the evening of
Friday 27th March and the decision to increase the weekly rate of payment to €350.
As seen in Figure 5, job losses – and the subsequent PUP applications – came in waves. In
the first two weeks, workers in the Accommodation and Food services sector were the largest
single cohort of claimants, accounting for 31 per cent of the total. After the introduction of
further measures on the evening of March 27th, there was a significant increase in the total
volume of claims in payment. As part of this new wave of claims, construction workers came
to account for 13 per cent of the total whilst Retail and Accommodation and Food Service
workers accounted for 15 per cent and 22 per cent, respectively.
Although males accounted for approximately 57 per cent of all Live Register claimants in
late-February, they were a proportionally smaller group within the earlier cohort of PUP
claimants, accounting for less than half of all claims. This changed post-construction sector
shutdown – with male claimants accounting for more than half of all claims by April 10th –
reflecting the throughput of a new wave of claims over this period (Figure 8). Similarly, the
impact of the later restrictions can be seen in the underlying age composition of PUP
claimants. By late-March, those aged 24 years or younger accounted for almost 1 in 4 of all
claimants. This had fallen back to 1 in 5 within a further two weeks (Figure 9).
11
As at March 27th
Page 10Figure 5: Sectoral Breakdown of the Pandemic Unemployment Payment
Source: Department of Employment Affairs and Social Protection.
Note: All figures are provisional only and are subject to revision. The percentage (%) denotes the sector’s share of total PUP
claims in Week 17.
Page 11Figure 6: Pandemic Unemployment Payment – Sectoral Breakdown by County
Source: Department of Employment Affairs and Social Protection.
th
Note: All figures are provisional only and are subject to revision. Reference Week: Week 16, w/e April 17 2020.
Page 12Figure 7: Pandemic Unemployment Payment by County – Proportions (W/E Apr 17th)
Source: Department of Employment Affairs and Social Protection.
Note: All figures are provisional only and are subject to revision. Accommodation and Food Services, Construction and
Wholesale and Retail Trade represent the three largest sectors overall for the Pandemic Unemployment Payment.
th
Reference week: Week 16, w/e April 17 2020.
Figure 8: Pandemic Unemployment Payment by Sex
Source: Department of Employment Affairs and Social Protection.
Note: All figures are provisional only and are subject to revision.
Page 13Figure 9: Pandemic Unemployment Payment – Age Profile
Source: Department of Employment Affairs and Social Protection.
Note: All figures are provisional only and are subject to revision.
Temporary Wage Subsidy Scheme (TWSS)
This scheme was initially introduced as the Employer Refund Scheme before being
superseded by the Temporary Wage Subsidy Scheme (TWSS). It is available to employers
who keep employees on payroll throughout the COVID-19 pandemic, meaning employers
can retain links with their employees for when business picks up after the crisis. The scheme
is expected to last 12 weeks from March 26th 2020 and is, at the time of writing, in a
‘transitional phase’ to April 20th 2020.
The TWSS is operated by Revenue through the payroll system and in its initial transition
phase, the scheme will refund employers up to a maximum of €410 per each qualifying
employee regardless of the employee’s income.12 It was initially envisaged that employers
would be refunded up to 70 per cent of the employee’s Average Revenue Net Weekly Pay
(ARNWP) to a maximum of €410 for employees earning less than (or equal to €586 per week
net) or €350 for those earning between €586 and €960 per week net.
12
On April 15th, the Minister for Finance announced further updates to the Temporary Wage Subsidy Scheme.
Page 14From April 16th, the wage subsidy is available to support employees where their pre-COVID-
19 salary was greater than €76,000, and their post-COVID-19 salary has fallen below
€76,000, subject to the tiered arrangements and tapering. Additionally, an 85 per cent
subsidy shall be payable in the case of employees whose previous average net weekly pay
does not exceed €412.
Within the first week of the scheme, over 25,000 employees had been registered for the
TWSS through their employers, increasing to almost 160,000 by the following week (Week
14). Inflows to the scheme have continued, with approximately 330,000 workers benefiting
from the scheme by the week ending April 24th. As seen in Figures 10 and 11, Wholesale and
Retail, Manufacturing, Accommodation and Food, and Construction account for the largest
share of both employees and employers registered for the TWSS.
Figure 10: Temporary Wage Subsidy Scheme – Share of Employers and Employees by
Sector
rd
Source: Revenue data as at April 23 2020.
Note: All figures are provisional only and are subject to revision.
Page 15Figure 11: Sectoral Breakdown of the Temporary Wage Subsidy Scheme
rd
Source: Revenue data as at April 23 .
Note: All figures are provisional only and are subject to revision. The percentage (%) denotes the sector’s share of total
TWSS recipients.
According to Revenue statistics, as at April 23rd, males accounted for 61.5 per cent of TWSS
employees. The principal age cohorts were those aged between 30-39 years and 40-49 years
representing 25.9 and 24.9 per cent of employees, respectively. Across all sectors, 84 per cent
of employees are receiving a ‘top up’ from their employer; with the highest proportion of
Page 16employees receiving top ups being seen in the Utilities (93.4 per cent) and Finance and
Insurance (93 per cent) sectors.13 Aside from activities of households as employers, the
Accommodation and Food services sector sees the largest share of employees without a top
up under TWSS, at 30.2 per cent (Figure 12).
Figure 12: Employer Top ups for TWSS Employees
rd
Source: Revenue data as at April 23 2020.
Note: All figures are provisional only and are subject to revision.
Data from Revenue shows the scheme has predominantly been utilised by smaller firms; 66
per cent of enrolled firms employ fewer than 10 workers, although these firms account for
less than 22 per cent of all employees on the scheme (Table 1). In 2017, firms employing less
than 10 workers accounted for approximately one quarter of total employment. Use of the
scheme among employees is spread across all levels of firm size; with workers in firms with
50-249 employees accounting for the largest share of the take-up at 26.5 per cent, followed
13
TWSS top up data is based on Revenue analysis of gross pay reported by employers for weekly-paid employees in receipt
of at least one top up in April.
Page 17by employees in firms with less than 10 workers. Meanwhile, the share of employers using
the scheme is heavily weighted towards smaller firms; with over 80 per cent of employers
availing of the TWSS seen in firms with less than 20 workers, albeit that this is smaller than
their representation across all firms. This may have consequences for the recovery of smaller
firms once the containment restrictions are eased, as recruitment is costly and time-
consuming for both employers and employees.14
Table 1: Firms using the TWSS scheme, by firm (employment) size
Share of employees (%) Share of employers (%)
All TWSS All TWSS
Under 10 25.6 21.7 92.1 66.0
10-19 9.1 15.5 4.1 15.7
20-49 11.9 21.2 2.4 11.0
50-249 18.6 26.5 1.2 5.0
250+ 34.8 14.8 0.2 0.8
Source: Business Demography, CSO (2017) and Revenue.
Note: Figures relating to TWSS as at April 30th. There is the potential that some “firms” in the business
demography data are actually self-employed individuals with no employees, who could be availing of the
Pandemic Unemployment Payment. Subtracting all such firms does not change the result that larger firms have
15
been more efficient in utilising TWSS.
Live Register Inflows
By early-March, there were just over 182,000 persons on the Live Register but by April 24th,
this had increased to almost 213,000 (or by 17 per cent).16 The Live Register typically
decreases over the period early-February to mid-May as outflows exceed inflows. In early-
March, the stock of both Jobseekers Benefit (JB) and Jobseekers Allowance (JA) claimants
14
A good overview of the literature on search and matching frictions in labour markets can be found here
http://ftp.iza.org/dp2743.pdf
15
According to LFS microdata the number of self employed individuals, who have incorporated their company, but have no
employees, is approximately 51,000.
16
This consisted of those on JB (c. 39,000) and on JA (c. 122,000) with the balance accounted for by those signing for credits
Page 18did fall but these decreases were very small; this may have been reflective of an early
reduction in the willingness (or capacity) to hire by certain sectors.
Thereafter, however, the Live Register diverged from any expected downward movement as
the trend was inverted with inflows overtaking outflows. The net change witnessed in this
period was driven by increases in claims for Jobseekers Benefit (JB) and Jobseekers
Allowance (JA) with the former accounting for approximately two-thirds of the net increase
(Figures 13 and 14).
Figure 13: Stock of Jobseeker’s Benefit Claims, 2017-2020
Source: Department of Employment Affairs and Social Protection.
Note: All figures are provisional only and are subject to revision.
Setting aside the net change, there were cumulative underlying inflows to JB and JA of
almost 60,000 over an eight week period up to April 24th; over 80 per cent higher than was
seen in the same period in 2019. Much of this increase was related to new JB claims and was
driven by a significant rise in the week immediately following the introduction of the first set
of restrictions (i.e. schools, creches, pubs, etc.). These increases are reflective of the impact of
the unfolding crisis and, at least in part, the fact that those with one adult and one or more
dependent children are advised to apply for a primary Jobseeker's payment (JA/JB) rather
Page 19than the COVID-19 PUP.17 Weeks 16 and 17 saw a slowing of JB inflows (partly explained
by the seasonal pattern regarding certain education workers), but this was offset by an
increased inflow to JA. This meant that the inflow to the Live Register, as well as stock,
increased.
JB outflows in Weeks 13 to 16 were relatively consistent at an average of close to 2,000 per
week over this period. This may reflect underlying dynamism and employment changes
present in the labour market, even against the backdrop of rising unemployment. We also
note an increase in JB outflows in Week 17.18
Figure 14: Flows of Jobseeker’s Benefit – March to April
Source: Department of Employment Affairs and Social Protection.
Note: All figures are provisional only and are subject to revision.
When we consider the previous sector of employment for these ‘new’ JB claimants over this
period, the data indicates that 1 in 3 had previously worked in the Accommodation and Food
services and retail sectors (Figure 15). A further 8 per cent of these claimants had previously
17
This is because a person can claim an additional allowance for an adult dependant and child dependants, which will bring
the weekly payment to in excess of the €350 weekly payment due under the emergency COVID-19 Pandemic Unemployment
Payment.
18
A preliminary examination suggests that approximately 25 per cent of these are in the Education sector.
Page 20worked in the area of human health & social work which will include those working in the
childcare sector.
Figure 15 – Jobseeker’s Benefit Inflows by Sector – March to April
Source: Department of Employment Affairs and Social Protection.
Note: (i) Reference Period: Weeks 10 to 17; (ii) All figures are provisional only and are subject to revision.
Short-time Work Support (STWS)
Short-time work is intended to help employers maintain flexibility during periods of
temporary economic downturn, without resorting to permanent lay-offs. This presents an
opportunity for employers to retain skilled labour, in a reduced capacity, thus reducing time
spent in the hiring cycle and helping to prevent delays to economic recovery. Research
shows that short-time work schemes are mostly utilised in the case of negative demand
shocks, by firms with high degrees of firm-specific human capital and operating in countries
where the labour market institutions make short-term work attractive as an alternative to
redundancy (Lydon, Matha and Millard, 2018).
During the Financial Crisis of 2008-2010, short-time working was used extensively in a
number of EU member states. It was also used in Ireland with 28,000 and 14,000 claimants in
2009 and 2010, respectively. Short-time work arrangements in Ireland operate under the
Page 21Short-time Work Support (STWS) scheme.19 The scheme can be used in cases where an
employee’s working hours are reduced by their employer on a temporary basis. The
individual is then facilitated in an application for Jobseeker’s Benefit (JB).20
By early-March, there were just 515 persons claiming the STWS scheme. This increased by
almost 10 per cent in the week prior to the announcement of the initial Government
restrictions on educational and childcare facilities. In the following two weeks, after the
introduction of further closures, the number rose significantly and stood at more than 3,700
claimants by April 24th (Figure 16). The trends herein are broadly aligned with expected
findings with regard to the impacted sectors (i.e. significant increases for Accommodation
and Food Services plus Retail). The increased incidence of short-time working also includes
those working in Manufacturing and Administrative and Support Services (including
employment agency and travel agency staff) (Figure 17).
Figure 16: Numbers availing of Short-time Work Support, 2018-2020
Source: Department of Employment Affairs and Social Protection.
Note: All figures are provisional only and are subject to revision.
19
Ireland’s Short-time Work Support was previously known as the Systematic Short-Time (SST) programme. STWS replaced
SST in late-2019.
20 The payment can be received in place of an employee’s regular salary for the days that they are no longer working. For
example, an individual reduced from a five to a three day week can receive JB for the remaining two days.
Page 22Figure 17: Sectoral Composition of new STWS claims, March-April 2020
Source: Department of Employment Affairs and Social Protection.
th
Note: Data refers to STWS claims awarded and active since March 1st 2020 until April 24 2020. All figures are provisional
only and are subject to revision.
Page 234. Complementary information and other considerations
We now proceed to utilise a variety of complementary datasets – including the Labour Force
Survey (LFS) and the Household Finance and Consumption Survey (HFCS) – in order to
better understand the circumstances of those displaced from work by the initial impacts of the
COVID-19 pandemic on Ireland’s labour market. To this end, we present a profile of the
character tics, and household finances, of those workers in the affected sectors.21
Characteristics of Individuals in Affected Sectors
Figure 18 shows our estimate of the percentage of workers in each sector (as per the Q4 2019
Labour Force Survey) who were in receipt of the PUP by April 10th. 22 23
There are four
sectors in which the proportion claiming the PUP exceeds twenty-five per cent, namely
Accommodation and Food Services, Construction, Administrative and Support Services and
Wholesale and Retail Trade and Repair of Vehicles. In the analysis that follows, we designate
these sectors as severely affected. We label as moderately affected those sectors such as
Transportation and Storage and Manufacturing where between 10 per cent and 25 per cent of
those employed in these medium affected sectors are in receipt of the payment.24 In the
mildly affected sectors, such as Health and Social Work and Information and
Communication, fewer than 10 per cent of those employed prior to the crisis were claiming
the PUP up to April 10th.25
21
Given the prominent role played by the PUP in supporting said workers to date, we refer specifically to claimants of this
support as a gauge of the affected sectors.
22
Sectoral breakdown to April 10th 2020 can be found here.
23 We constrain our analysis to the NACE sector categories A-R accounting for over 90 per cent of all PUP payments to April
10th.
24
Manufacturing; Transportation and storage; Finance and Insurance and Real Estate; Professional, Scientific and Technical;
Public Administration and Defence; and Education.
25
Primary industries; Utilities; Information and Communication (ICT); and Human Health and Social Work. The latter includes
childcare workers.
Page 24Figure 18: Share of sectoral employment registered for pandemic unemployment
payment support
70
% of sectoral employment
60
50
40
30
Average
20
10
0 Arts
Health
Admin
Manufacturing
Utilities
Accom
Retail & Wholesale
Public Admin
Finance and Real
Professional
ICT
Education
Primary
Construction
Transprot
Estate
Source: Department of Employment Affairs and Social Protection.
Note: (i) Reference Period (Week 15); (ii) All figures are provisional only and are subject to revision.
Table 2 shows the characteristics of workers by the severity of the sectoral employment
losses. Approximately one quarter of those in employment prior to the pandemic are now in
receipt of the PUP. The severely affected sectors accounted for 32.7 per cent of private sector
employment before the crisis. Our estimates suggest that approximately 40 per cent of those
previously employed in the severely affected sectors are in now in receipt of the PUP.
The first column of Table 2 illustrates some stylised facts about individuals in the severely
affected sectors prior to the outbreak. Of particular note, workers in these sectors are on
average younger, more likely to be a citizen of another country, and more likely to be in their
role for less than 12 months than the population average. Prior to the outbreak, these sectors
had become increasingly reliant on inward migration for new hires. 26 Workers in the
Accommodation and Food Services sector in particular are more likely to have had job tenure
of less than 12 months in that sector than the national average. They are also more likely to
26
See Staunton and Smyth (2019).
Page 25have part time working arrangements with 42 per cent of employment compared to an
economy-wide average of 20 per cent.
Table 2: Characteristics of workers in receipt of PUP by intensity of sectoral
unemployment shock
Severe Moderate Mild All
Share in receipt of PUP 41.2 13.7 7.2 21.1
Share of total employment (sectors A-R) 32.7 42.9 24.4 100
Share under 35 years 41.8 26.9 28.4 32.1
Share with less than tertiary education 59.2 32.2 34.6 41.6
Share non-Irish 20.4 13.7 16.3 16.5
Share female 41.0 45.0 51.9 45.3
Share in role less than 12 months 22.4 13.8 15.4 17.0
Share self-employed 15.0 10.3 19.7 14.1
Share part-time employment 29.2 12.5 20.2 20.4
Source: LFS, CSO and Department of Employment Affairs and Social Protection and authors’ calculations.
Note: All figures are provisional only and are subject to revision.
The early waves of those seeking PUP payments were more likely to be women, aligning
with the high share of women employed in Accommodation and Food Services and in
Wholesale and Retail. Indeed, 54 per cent of those employed in Accommodation and Food
Services in Q4 2019 were women, whilst 56 per cent were under 35 years of age. This is
higher than the average for those working in the four sectors collectively designated above as
‘severely impacted’. Later waves, however, saw an increase in the share of men claiming the
payment as well as those aged 35 to 54 years as operations in the construction industry ceased
on March 27th. If the loosening of restrictions occurs in reverse order to the introduction of
these measures, as is expected, this will result in the labour market recovery taking longest to
reach some of the worst affected sectors, including Accommodation and Food Services, and
the types of workers typically employed in these sectors are disproportionately the young and
women.
As mentioned above, a significant proportion of the workers in the sectors which suffered the
Page 26largest job losses are under 35 (per the Q4 2019 Labour Force Survey). To illustrate this and
to cross check the sectoral analysis above, we take an illustrative sample of the worst affected
occupations and plot the age distribution of these workers against the overall employed
population (age 15-65). Figure 19 shows the large spike in workers in their early 20s, many
of whom are employed as waiters, bartenders, and in retail.
Figure 19: Workers in affected occupations are younger
Source: CSO (LFS) and Department of Employment Affairs and Social Protection.
Note: (i) Reference Period for PUP (Week 16); (ii) All figures are provisional only and are subject to revision.
The younger cohorts identified as worst affected had already suffered somewhat from
entering the labour market during the Global Financial Crisis.27 This group had a higher
unemployment rate than the population average even during 2019, five to six years after the
end of the crisis. Lydon and Lozej (2018) find that new hires suffered the largest pay declines
at the onset of the Financial Crisis in 2008. Given that those most affected by the initial
waves of employment loss from the PUP data were younger workers, it may be likely that
unemployment could remain relatively high for this group over coming years. Recent signs of
convergence in the labour force participation gender gap may be reversed to a degree as the
heaviest job loss at the onset of the pandemic were amongst young and female workers.
27
See Byrne, S and McIndoe-Calder, T. (2019).
Page 27When considering youth unemployment and the impact of COVID-19 on the labour market
outcomes of young persons, however, there are some important caveats. Firstly, it should be
noted that there is an inherent difficulty in measuring this phenomenon; which occurs due to
the smaller denominator (i.e. the number of people considered part of the labour force). In
accordance with the International Labour Organisation’s labour force classification, an
individual is only considered to be part of the labour force either when they are employed or
unemployed. To be classified as unemployed an individual must be without work, available
to commence work and be actively seeking employment. Therefore, this means that a
significant proportion of those aged 15-24 are not actually considered part of the labour force,
as they will be studying and do not meet the aforementioned criteria.28
Secondly, it may be too early to draw conclusions from the PUP data for how younger
workers might potentially be impacted, particularly as the eligibility conditions for access to
PUP are broader than general unemployment schemes (i.e. part-time student workers are
deemed eligible). This is an issue that will need to be carefully monitored.
28
It is also worth considering that some individuals in this cohort will be graduates and this may see them transition into other
sectors where there is labour demand.
Page 28Figure 20: Unemployment Rate by Birth Year
Male Female
25
20
15
10
5
0
1990 1985 1980
Source: CSO and authors’ calculations.
Household Finances and Financial Buffers of Households in Affected Sectors
By grouping the sectors most affected by unemployment shocks in relation to the CSO
Earnings Analysis using Administrative Data Sources (EAADS) for 2018, we can
approximate the distribution of weekly earnings for workers according to the severity of the
shock.29 Table 3 below shows that the almost 60 per cent of workers in the most severely
affected sectors have earnings placing them in the two lowest quintiles. Only 8.7 per cent of
workers in these sectors are estimated to earn a weekly sum equivalent to place them in the
highest quintile. The weighted average mean weekly earnings for this cohort is €542. An
analysis of the employment characteristics data in the previous section showed this cohort to
be nearer to the beginning of their respective careers and more likely to be in employment
less than 12 months, which can affect earnings.
The distribution of earnings for workers in sectors experiencing a 10-25 per cent orcent unemployment shock exhibit the reverse trend with the share of workers increasing
between each quintile, with over a quarter of these workers in the top earnings quintile.
Workers in these sectors display a higher weighted average mean weekly earnings of €841
and €879, respectively, which can be reflective of a greater share of staff on full-time
working arrangements and higher skilled levels of activity dependent on the sector.
Table 3: Income distribution of PUP recipients by intensity of sectoral job losses
Severe Moderate Mild
Share in Fifth Quintile 8.7 25.9 26.7
Share in Fourth Quintile 12.7 23.4 24.7
Share in Third Quintile 20.2 20.3 18.7
Share in Second Quintile 26.7 16.5 16.2
Share in First Quintile 31.6 13.8 13.6
Weighted Average Mean Weekly Earnings (€) 542 841 879
Source: CSO Earnings Analysis using Administrative Data Sources (2018) and Authors’ calculations
Figure 21: Estimated Replacement Rates for workers in sectors classified as ‘severe’
Source: Department of Employment Affairs and Social Protection.
Note: All figures are provisional only and are subject to revision.
Page 30Replacement rates are used to measure a person’s financial incentive to work. They compare
a person’s in-work income with out-of-work income. There is no specific cut-off level of
replacement rate that constitutes a disincentive to work but the internationally accepted
threshold suggests that it is generally prudent to pay particular attention to replacement rates
of 70 per cent or above (Reilly, 2015). The financial incentive to work is clearly a factor in
taking up employment when opportunities arise30. On the basis of PUP payments only, we
have undertaken a preliminary analysis of replacement rates. Figure 21 above outlines the
estimated replacement rate for workers in sectors categorised as severely impacted. These
individuals have average weekly gross earnings of €542.31 For a single person, this is
equivalent to approximate net weekly earnings of €461. Given the rate of PUP is €350, this
amounts to a replacement rate of 75.9 per cent for these individuals (Figure 21) and warrants
careful monitoring going forward. Based upon the data presented above, the replacement rate
for the other two categories – moderate and mild – is closer to 50 per cent.
The position of household finances before the onset of a negative shock can be used to
examine the ability of households to withstand such a shock. In aggregate, net household
wealth at the end of 2019 was 10 per cent higher than at the start of 2007.32 The relatively
favourable net wealth position of households at the end of 2019 was supported by a recovery,
to pre-2007 levels, in both incomes and employment. The economic impact of COVID-19 on
families will occur, in large part, as an income shock. Households with net liquid assets
(NLA’s, or financial buffers) may need to draw down on these in order to cushion against
falls in employment or wages as a result of the pandemic.33 Households hold different levels
of financial buffers depending on their incomes and sectors of employment (See Table 4).
30 For further discussion on replacement rates, see Martin, J. P., 1996. Measures Of Replacement Rates for the Purpose of
International Comparisons: A Note. OECD Economic Studies, 26(1), pp.100-15.
31
Replacement rates are hypothetical rather than empirical, approximate calculations based on standard tax credit
assumptions and do not take account of the distribution of household composition in the affected sectors or unearned income.
32
Using Quarterly Financial Accounts data on households from the Central Bank of Ireland.
33
Net liquid assets are defined as the sum of liquid assets (deposits, mutual funds, bonds, non self-employment business
wealth, shares and managed accounts) less non-collateralised debt (overdrafts/credit lines, credit cards and other non-
mortgage loans) – this is a commonly used financial buffer metric.
Page 31New data from the Household Finance and Consumption Survey (HFCS) shows that the
median household in Ireland holds financial buffers valued at around 5.9 per cent, or less than
a month, of gross income.34 Households whose members were employed, prior to the
COVID-19 outbreak, in sectors which have seen a 25 per cent, or higher, employment fall
hold €1,000 worth of financial buffers (at the median), lower than those in sectors with
smaller employment falls. These households hold 2.4 per cent of their income as financial
buffers, less than two weeks of gross income. Households in the most exposed sectors are
more likely to hold debt than the population average of 51.5 per cent, but their debt
repayment burdens are lower than other employed households at 13.8 per cent of gross
income. This, in part reflects, the higher renter share of more exposed households (44.4 per
cent) compared to between 24 per cent and 39.5 per cent of households in less affected
sectors.
Table 4: Financial position of households before COVID-19, by intensity of
unemployment shock
Severe Moderate Mild
HH income (median) 54,000 80,700 52,700
Share with NLA 68.61 67.12 73.22
NLA (median) 1,100 3,000 3,000
NLA (share of income) 2.35 4.32 5.97
Share with debt 60.97 73.90 57.78
Total debt service burden (average) 13.75 14.86 16.63
Renter (share) 44.40 23.95 39.45
Source: LFS, CSO, HFCS and Department of Employment Affairs and Social Protection and authors’ calculations.
34
The latest Household Finance and Consumption Survey report for Ireland is here. The Irish data surveyed just under 4,800
households between April 2018 and January 2019.
Page 325. Concluding comments
COVID-19 Pandemic Unemployment Payment and Temporary Wage Subsidy Scheme
supports are available to those who were in employment before the containment measures
introduced to combat the COVID-19 pandemic in Ireland. These measures were rolled-out
rapidly as part of broad ranging approach to providing supports to employers and employees
in the affected sectors of Ireland’s economy.
On the basis of jobs lost (or displaced), we find that the most severely impacted sectors are
tourism, hospitality and food services; retail; and construction. We also find that these job
losses came in a series of sequential waves from mid-March through April 2020.
We find that those who have lost their job due to the COVID-19 pandemic, or who have been
temporarily laid-off, are more likely to be young, low-skilled, female and part-time than the
population average. Lessons from the 2008 Financial Crisis in Ireland shows that this may
adversely affect the employment prospects of these cohorts once the containment measures
are rolled back. This is something that will need to be carefully monitored.
Employees in receipt of the TWSS supports are more likely to come from medium to larger
firms35 than the demography of enterprises may have suggested. International research
suggests that re-establishing employer-employee relationships is relatively more costly for
smaller firms.
As Ireland begins to plan for the post-pandemic recovery, it will be necessary to consider
what steps are required to ensure that the labour market can reposition itself as quickly and
effectively as possible. This planning phase will need to develop solutions to questions
35
Exlcuding firms with 250+ employees
Page 33arising around how best to support firms in this recovery, how best to support the re-
establishment of employer-employee relationships and, where the latter is not feasible in the
short to medium-term, how best to minimise disincentives to work and assist the unemployed
in finding new employment.
Some firms have not been able, or are less able, to maintain links with their workers through
the crisis. Some form of transitional supports for these (small) firms may be beneficial for the
recovery phase.
Page 34References
Bell, B., Bloom, N., Blundell, J. and Pistaferri, L. (2020) Prepare for large wage cuts
if you are younger and work in a small firm. Available at:
https://voxeu.org/article/prepare-large-wage-cuts-if-you-are-younger-and-work-small-
firm
Berube, A. and Bateman, N. (2020) Who are the workers already impacted by the
COVID-19 recession? Available at: https://www.brookings.edu/research/who-are-the-
workers-already-impacted-by-the-covid-19-recession/
Bick, A. and Blandin, A. (2020) “Real Time Labor Market Estimates During the 2020
Coronavirus Outbreak”, Unpublished Manuscript, Arizona State University.
Available at: https://alexbick.weebly.com/uploads/1/0/1/3/101306056/bb_covid.pdf
Bryne, S. and McIndoe-Calder, T. (2019) Employment Growth: Where Do We Go
From Here? Available at: https://www.centralbank.ie/docs/default-
source/publications/quarterly-bulletins/quarterly-bulletin-signed-articles/employment-
growth---where-do-we-go-from-here-(byrne-and-mcindoe-calder)
Lydon, R. and Lozej, M. (2018) “Flexibility of new hires’ earnings in Ireland”,
Labour Economics, 53, pp.112-127.
Lydon, R., Matha, T.Y., and Millard, S. (2018) "Short-time work in the Great
Recession: Firm-level evidence from 20 EU countries," Research Technical Papers
13/RT/18, Central Bank of Ireland.
Martin, J. P. (1996) “Measures Of Replacement Rates for the Purpose of
International Comparisons: A Note”. OECD Economic Studies, 26(1), pp.100-15.
Reilly, D. (2015) Analysis of Replacement Rates from 2010 to 2015. Available at:
https://igees.gov.ie/wp-content/uploads/2014/11/Analysis-of-Replacement-Rates.pdf
Staunton, D. and Smyth, D. (2019) Inward migration and the Irish labour market.
Available at: https://www.centralbank.ie/docs/default-source/publications/quarterly-
bulletins/boxes/qb2-2019/box-c-inward-migration-and-the-irish-labour-
market.pdf?sfvrsn=4
Page 35Annex
Membership of the Labour Market Advisory Council (LMAC)
John Martin (Chair) – Former Director of Employment, Labour and Social Affairs,
OECD
Terry Corcoran – Former Chief Economist at the Department of Employment Affairs
and Social Protection
Ger Gibbons – Senior Economist, ICTU
Frank Gleeson – President and CEO, Aramark Northern Europe
Susan Hynes – VP and Site Lead, Takeda Dunboyne Biologics
Dr. Kara McGann – Head of Social Policy, IBEC
Sinead McSweeney – Managing Director, Twitter Ireland
Bríd O’Brien – Head of Policy and Media, INOU
Dr. Phillip O’Connell – Director of the Geary Institute, UCD
Angela Smith – CEO, Dress for Success
Ade Stack – Managing Director, Stacks Pharmacy
Ex-Officio Members of the Labour Market Advisory Council
Jenny Connors – Department of Public Expenditure and Reform
John Shaw – Department of An Taoiseach
William Beausang – Department of Education and Skills
David Hegarty – Department of Business, Enterprise and Innovation
John Conlon and Dr. Dermot Coates – Department of Employment Affairs and Social
Protection
Andrew Brownlee – CEO, SOLAS
Page 36Quality Assurance Process
To ensure accuracy and methodological rigour, the authors engaged in the
following quality assurance process
Internal/Departmental
Line management
Other divisions/sections
External
Other Government Departments
Peer review (IGEES and Central Bank of Ireland
colleagues).
External expert(s)
Other
Labour Market Advisory Council
Page 37You can also read