Labour Market Analysis: Islington & London - April 2013 - Islington Council
←
→
Page content transcription
If your browser does not render page correctly, please read the page content below
Labour Market Analysis:
  Islington & London

                   April 2013
LABOUR MARKET ANALYSIS: ISLINGTON & LONDON
Key messages
The Local Economy
The local economy is bearing up well, despite the recession
In 2010 there were 1.3 jobs per working age resident in Islington
However, 15.1% of Islington residents are out of work, including 11.5% of all Islington young
people aged 18-24
Current Labour Market
Key sectors for Islington in terms of jobs and Entry Level vacancies:
Administration & Support
Health & Social Work
Wholesale & Retail (but focus on Retail)
Accommodation & Food
Transport, Storage & Post (but focus on postal)
Media, Comms & IT
Professional, Scientific & Technical
Finance & Insurance
Construction
Arts
Future Trends
Growth and employment is expected to rise slowly to 2020
Employment growth in London is projected to be above the UK average during 2010-2020,
representing one of the fastest rates of employment growth
Replacement demand (replacing workers who leave) will outweigh any areas of decline – so there
will be new jobs in all sectors
Projected polarisation in terms of demand for skills, with growth at both top and bottom ends of
the skills spectrum
Private services, Business and other services will see most growth
Continued growth in higher skilled, white collar occupations, including managers, professionals
and associate professionals
Lower skilled jobs will remain a significant part of the labour market – increase in jobs around
caring, personal and other service occupations and in low skilled elementary jobs in service based
areas
Shift away from public sector activities
Continued decline in skilled and semi-skilled manual roles, including in skilled trade occupations
and process, plant and machine operatives
Administrative and secretarial occupations will also see a loss
Apprenticeships
Until recently low take up of apprenticeships in London – with Islington having one of the lowest
rates across the country
However, apprenticeships are now taking off in London
High numbers of Apprenticeship vacancies in: Business & Administration, Customer Service, IT,
Software, Web & Telecoms Professional, Children & Young People’s Workforce (Childcare) and
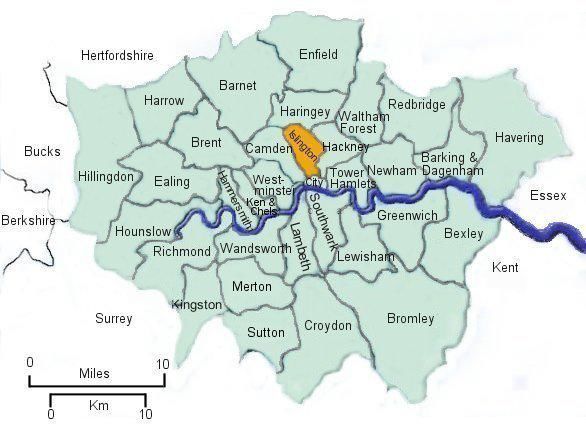
Hospitality & CateringThe Local Economy London is the dominant driver in the UK economy and a major global city. Trade with the rest of the world, particularly in financial and business services, has played a key part in its growth. But it also includes centres of government, culture, education, retail and media, and many others. As with other previously industrialised countries, London has experienced a decline in manufacturing and a shift towards a service based economy. Islington is located within the heart of London, adjacent to the City, the global centre of financial services, and close to the West End and Holborn. It falls within the Central sub-region of London, together with Camden, City of London, Westminster, Kensington & Chelsea, Lambeth and Southwark. Services account for 95% of jobs in Central London, of which 45% are in financial and business services, more than twice the national figure. Employment growth in media sectors (including IT and creative industries) and public services has also been significant compared with the UK economy. Around one-third of London’s jobs are located in the Central London region, which is the largest and most productive centre of employment in Britain. Islington accounts for around 10% of Central London businesses, and 10% of Central London jobs, though only 30% are held by Islington residents. Islington is adjacent to the East and North London sub-regions. The East London economy is particularly varied, including parts of the Central Activity Zone office market area, the Canary Wharf Financial District, a range of manufacturing and distribution activities, as well as creative, green, leisure, information and science based sectors. The North London region is largely residential, accounting for just 9% of London’s employment. The south part of Islington sits within the London Central Activities Zone, London’s geographic, economic and administrative core. Business in this part of the borough is predominantly office based, including financial and business services, but also the Head Offices of a number of national charities. Islington’s arterial routes, particularly the A1 (Upper Street/ Holloway Road) and Pentonville Road/ City Road are also focal points for economic activity, particularly at Angel and Nags Head Town Centres where retail provision dominates. Islington is well served by public transport and there are clusters of business around key transport hubs, notably at Farringdon, Kings Cross, Angel, Highbury & Islington, Archway and Finsbury Park. Despite the recession, the economic climate in Islington remains relatively stable and prospects appear good, although public sector funding cuts are likely to affect many businesses and households. In 2010 there were 197,000 jobs in Islington – 1.34 per working age resident (compared to 0.88 across London and 0.77 nationally). This does not mean that all these jobs were vacant at any one time, or that all Islington residents would want to or have the skills to fill them – but it does indicate a good supply of local jobs. There is also a good level of vacancies. A recent analysis of Job Centre Plus figures found that in the 12 month period from June 2011 to May 2012 just over 15,000 vacancies in Islington were advertised, including a good proportion of entry level jobs suitable for those with no or low skills and experience. This represents the highest number since 2007-08. However, not all Islington residents are benefiting from these opportunities. Government figures for August 2012 showed that 23,400 Islington residents (15.1% of the working age population) were claiming out of work benefits (3rd highest in London). Of these, 2,890 were young people aged 18-24 which equates to 11.5% of all young people in Islington. Unemployment and long term dependency on benefits are the underlying cause of poverty in Islington. The borough is ranked the 14th most deprived local authority area in England (out of 354), and 5th most deprived in London, with the second highest rate of child poverty.
Labour Market: Current picture
The labour market is the demand for labour by employers and the potential supply of people of
working age to meet this demand. Labour markets are not restricted by local authority boundaries.
Islington-based businesses draw on labour from within and beyond Islington, while some Islington
residents work for employers (and seek employment) outside of the borough boundaries.
Commuting data indicates that around 30% of Islington residents work in the borough and another
40% work in the Central London boroughs of Westminster, Camden or the City of London.

Data sources
This analysis therefore looks not only at the Islington labour market but at the wider London jobs
market, in order to identify the priority sectors in terms of jobs. It draws upon data from:
- Annual Labour Force Survey 2011 (as reported on the Government’s NOMIS website). This is a
    national survey undertaken each year across a large sample of business representing all sectors
    and occupational groups
- Department of Work & Pensions data on London vacancies notified to Job Centre Plus (Nov 11 –
    Nov 12). NB: It is estimated that around ¼ of all vacancies are advertised through JCP so, although
    this does not pick up all vacancies, it provides a good indication
- BETA model data for 2010 – this provides details on Islington businesses. It uses a slightly
    different methodology and business classification system to the two Government sources above
    but allows a more detailed insight into Islington businesses and jobs
All businesses in the UK are classified in accordance with Standard Industry Classification codes (SIC
2007). A list of the 22 sectors is attached as Appendix A.
Within each industry, there will be a range of occupations – some specific to that industry but others,
such as managers, administrators, cleaners, etc. are more generic and will occur across a number, if
not all, sectors. All occupations are classified using the Standard Occupational Classification (SOC
2010). This lists all occupations under one of 9 broad groups. Each group is assigned skills level (from
Level 1 to Level 4) to reflect the level of qualifications, skills or experience generally required to do
the job well. A list of all occupations, by group and skills level, is attached as Appendix B.

Headline figures
Numbers of businesses and jobs in London and Islington (LFS 2011):
  334,400 businesses in London, of which 11,600 in Islington
  4,080,000 jobs in London of which 178,000 in Islington
  1.14 million of London jobs were part-time, of which 3,570 in Islington
  1.69 million of London jobs in Entry Level occupations (Levels 1 and 2) and, of these, 319,000 in
  Elementary occupations (NB: information not currently available for Islington)

Size of Islington businesses (BETA Model 2010):
    Around 9 in 10 businesses in Islington have fewer than 20 employees
    Micro businesses (those with 1-5 employees) account for almost two-thirds of businesses but
    provide only 9% of the jobs

London job vacancies (JCP vacancies Nov 11 – Nov 12):
   587,000 London vacancies of which 342,200 Entry Level vacancies (Levels 1 and 2)
Priority sectors: London and Islington The tables at Appendices C and D provide a summary by sector of: Numbers of business premises across London and Islington Numbers of jobs across London and Islington (including Entry Level jobs and Part-time jobs) Numbers of vacancies in London as advertised through JCP Appendix C provides the actual numbers of businesses, jobs and vacancies in each sector. Appendix D provides a ranking (from 1 to 19) for each sector in terms of numbers of businesses, jobs and vacancies. The top 10 sectors in each column are shaded to make it easy to see which ones perform well across all categories. The aim is to help inform decisions on where to focus efforts around business engagement, careers advice, skills development and employability support. The table below is an extract from Appendix C and shows those sectors which score well across some or all areas: NB: The last sector scores well in Islington because of the predominance of retail (as opposed to wholesale or motor vehicle repair). BETA model data provides additional insight into the Islington picture. The BETA model captures businesses of all sizes (above and below the VAT threshold) that are registered with a business directory (e.g. Yellow pages, Thompson Local etc.). It breaks down businesses into 12 sector categories, as opposed to the 22 SIC classifications used by LFS and JCP data sets. This makes direct comparison difficult because sector definitions vary. However, both sets of data show a broadly similar picture in terms of numbers and key sectors. The top five sectors in Islington using BETA data are: Real Estate, Renting & Business Activities Financial Intermediation Health & Social Work Manufacturing Wholesale, Retail & Repair of Motor Vehicles (with Retail being the primary industry)
The graph below uses BETA Model data to compare the percentage of enterprises and employees in
each sector in Islington. It shows that:
   Real Estate, Renting and Business Activities is by far the top sector, both in terms of numbers of
   businesses and employees
   Wholesale, Retail & Repair of Motor Vehicles is second in terms of numbers of businesses, but
   only 5th in terms of employees
   Financial Intermediation, on the other hand, has a relatively low % of businesses but the second
   highest % of employees. This is likely to represent a number of large firms in the south of the
   borough

                 % Enterprises & Employees in Islington by Sector
      35
      30
      25
      20
      15
      10
       5                                                                                    % of enterprises
       0                                                                                    % of employees

   Compared to England, London and Inner London, Islington has a higher proportion of jobs in:
   - Real estate, renting and business activities and
   - Financial intermediation
   Compared to England, London and Inner London, Islington has a lower proportion of jobs in
   - Construction
   - Other community and social care
   - Hotels and restaurants
The tables on the following two pages provide more details on the top five sectors in Islington
according to BETA data i.e.
   Real Estate, Renting & Business Activities
   Financial Intermediation
   Health & Social Work
   Manufacturing
   Wholesale, Retail & Repair of Motor Vehicles
Also included are details of Islington’s thriving Creative Industry which, although not classified as a
sector, has over 2,000 enterprises and 30,000 employee jobs in Islington across a range of sectors.
Details on key employers in Islington in each sector are available on request.
Real Estate, Renting and Business Activities
Represents 2,868 (28%) businesses in Islington and 52,018 (30%) employee jobs
It is ranked 1st for number of businesses and 1st for number of employee jobs
Types of businesses in Islington (with numbers in brackets) are:
- Architects, engineers, quantity surveyors and related - Photographers (102)
technical consultants (447) - Market research companies (48)
- Estate agents/ letting agents (206) - Detective agencies and security companies (39)
- Advertising (219) - Property development (38)
- Business and management consultants (161) - Car rental firms (25)
- Legal firms/ solicitors (146) - Equipment hire firms (9)
- Labour recruitment agencies (124) - Data processors (6)
- Accountants/ book keepers/ auditors/ tax consultants (120) - Renters of televisions & Video rental
- Software consultants (102) - Public relations consultants
Financial Intermediation
Represents 260 (3%) of businesses in Islington and 21,280 (12%) of Islington’s jobs
It is ranked 10th for number of businesses and 2nd for number of jobs in Islington
This sector is characterised by a small number of companies that employ large numbers of people
Types of businesses in Islington (with numbers in brackets) are:
- Banks & Building societies (78) - Investment trusts (23)
- Credit agencies (29) - Insurance (23)
- Mortgages, financial advice & bureau de change (66) - Securities & Broking (30)
Health and Social Work
Represents 897 (9%) of businesses in Islington and has 19,735 (11%) of Islington’s jobs
It is ranked 4th for number of businesses and 3rd for number of employee jobs in Islington
Between 1999 and 2010 sector grew by over 64% in terms of number of businesses and 104% in terms of
employees. This growth in employment was also reflected across London (66% growth) and Inner London (70%
growth), though not as notably as the increase in Islington
Types of businesses in Islington (with numbers in brackets) are:
- Social work activities without accommodation (charities, voluntary org’ns, community centres, youth groups) (246)
- Other human health activities (including, psychologists, complementary therapists, osteopaths, hypnotherapists,
opticians, physiotherapists, homeopaths) (212)
- Social work activities with accommodation (housing assoc’ns, residential & retirement homes, sheltered housing) (62)
- GP surgeries (39)
- Dentists (29)
- Vets (11)Hospitals (including NHS trusts, private hospitals and nursing homes) (10)
Wholesale and Retail Trade; Repair of Motor Vehicles
Represents 1,531 businesses (15%) in Islington and 14,813 (8%) jobs
It is ranked 6th for number of businesses and 5th for number of jobs in Islington
Types of businesses in Islington (with numbers in brackets) are:
- Other retail (e.g. florists, jewellers, antiques) (214) - Retail sale of furniture, lighting, household goods,
- Clothing & footwear retailers (171) electrical, hardware (63)
- Retail sales or food, beverages and tobacco (e.g. butchers, - Repair of motor vehicles (56)
bakers, off-licences, delicatessens) (164) - Pharmacies (45)
- Non-specialised retail sales (e.g. grocers, supermarkets, - Repair of personal and household goods (e.g.
department stores) (147) footwear, watches etc) (31)
- Wholesalers (196) (includes, wholesale of textiles (25) and - Agents/ merchants (28)
wholesale of clothing and footwear (45) - Sale of motor vehicles (8)
- Retail sale of books & newspapers (111) - Fuel stations (6)Manufacturing
Represents 854 (8%) businesses in Islington and has 16,566 (9%) of Islington’s jobs
It is ranked 5th for number of businesses and 4th for number of employee jobs
Types of businesses in Islington (with numbers in brackets) are:
Manufacture of:
- Furniture, jewellery, musical instruments, sports goods, games, toys etc. (127)
- Electrical and optical equipment, computers and office machinery e.g. computer systems, internet services, digital
imaging, photocopiers, battery supplies, juke boxes) (97)
- Fabricated metal products (e.g. locksmiths, sheet metal work, spring and shock absorbers) (50)
- Chemicals, rubber, plastic, ceramics, concrete, metals etc. (e.g. paint, perfume, bathroom equipment, tiles,
manufacturing) (39)
- Textiles and textile products (e.g. t-shirts, dressmakers, clothing manufacturers & wholesalers) (34)
- Machinery (e.g. catering equipment, lifts and escalators, sewing machines (24)
- Wood and wood products (e.g. carpenters & joiners) (20)
- Medical and precision instruments (e.g. hearing aids, medical suppliers) (15)
- Motor vehicles, bicycles, trailers etc (e.g. motor repairs, engine reconditioning) (6)
- Leather and leather products (e.g. handbags, footwear) (4)
Publishing of books, journals and periodicals (109)
Printing (92)
Publishing of newspapers & magazines (44)
Food and beverage manufacturers (e.g. cake makers, brewers, bakers, soft drinks supplies) (17)
Wholesale and Retail Trade; Repair of Motor Vehicles
Represents 1,531 businesses (15%) in Islington and 14,813 (8%) jobs
It is ranked 6th for number of businesses and 5th for number of jobs in Islington
Types of businesses in Islington (with numbers in brackets) are:
- Other retail (e.g. florists, jewellers, antiques) (214) - Retail sale of furniture, lighting, household goods,
- Clothing & footwear retailers (171) electrical, hardware (63)
- Retail sales or food, beverages and tobacco (e.g. butchers, - Repair of motor vehicles (56)
bakers, off-licences, delicatessens) (164) - Pharmacies (45)
- Non-specialised retail sales (e.g. grocers, supermarkets, - Repair of personal and household goods (e.g.
department stores) (147) footwear, watches etc) (31)
- Wholesalers (196) (includes, wholesale of textiles (25) and - Agents/ merchants (28)
wholesale of clothing and footwear (45) - Sale of motor vehicles (8)
- Retail sale of books & newspapers (111) - Fuel stations (6)
Creative Sector
London is the dominant location for the UK’s creative sector accounting for 386,000 (or 32%) of the 797,000
creative workforce jobs in the UK
2,559 (25%) of Islington businesses are in the creative sector and 34,775 employees (20%)
Creative industries in Islington:
With largest number of firms: With largest number of jobs:
- Music and performance (770) - Publishing (7,056)
- Leisure software (700) - Leisure software (4,209)
- Fashion (305) - Music and performance (2,464)
- Architecture (2,256)
Each of these sectors are amongst the largest cultural sectors in London, with the exception of architecture
which accounts for only 4% of London’s total creative jobs, and is much smaller than industries such as leisure
software (28%) and music and performance (17%). The cluster of architectural firms in the Clerkenwell area is
therefore relatively unique within LondonIslington Vacancies
Information from JCP provides useful insight into actual job vacancies in Islington. It is estimated that
around one quarter of all jobs are advertised through JCP so that, although it does not provide a
comprehensive picture, it provides a good indicator of the numbers and types of jobs available. In the
period June 2011 – May 2012 there were 15,118 vacancies in Islington advertised through JCP (but
around 1,000 at any one time).
30 different occupational groups accounted for around three quarters of these vacancies:
18% (2,750) were in six areas of retail / customer care
16% (2,406) were for labourers or construction related activities. However, the bulk of these
were for trades that require some kind of qualification / trade training (carpenters, painters &
decorators, electricians, construction operatives, plumbers, etc.)
12% (1,864) were in Business support services such as post, messaging & couriers, security
guards and cleaners
5% (764) of vacancies were in hospitality (chefs /cooks, catering assistants, waiters / waitresses,
restaurant managers, bar staff)
Top 20 vacancies:
- Sales related (1,107) - Labourers in other construction trades (313)
- Postal workers, mail sorters, messengers, couriers (1,086) - Cleaners, domestics (264)
- Customer care (940) - Painters & decorators (239)
- Marketing associate professionals (835) - Care assistants & home carers (227)
- Sales representatives (821) - Construction operatives (227)
- Carpenters & joiners (473) - Chefs, cooks (224)
- Security guards & related occupations (455) - Electricians, electrical fitters (206)
- Labourers in building & woodworking trades (391) - Kitchen & catering assistants (200)
- Marketing & sales managers (369) - Mobile machine drivers & operatives (1930
- Sales & retail assistants (348) - Waiters, waitresses (185)
Local Knowledge – the Islington picture
Local knowledge from those working on the ground with businesses indicates that Islington is in a
strong position to benefit from a number of employment opportunities on its doorstep including:
Construction: Current infrastructure development projects include Kings Cross Construction,
Crossrail. Future potential developments (subject to funding) include improvements to the
Archway and King’s Cross gyratories and Old Street Roundabout. Construction activity in Islington
is high and this provides opportunities for local employment and upskilling within the sector,
including positions ranging from skilled trades, surveying and site management to administration,
cleaning and project management. Large development projects locally include King's Cross
Central, Building Schools for the Future, Packington Estate, 251 City Road, etc. with potential to
create large amount of employment opportunities over many years. Islington Council has had a
dedicated scheme for the past 10 years which ensures that local developments support the
creation of local employment and training opportunities and a team that ensures that these
opportunities are realised for local people
Retail: Large number of SMEs, key retail areas: Angel, Nag’s Head, Finsbury Park, Archway plus
much larger nearby centres at Liverpool Street, Oxford Street, Tottenham etc. The Council has
links with some of the large employers in the borough, including chains such as Waitrose. It also
supports Town Centre Management Forums in Angel, Nags Head, Finsbury Park and Archway
which gives access to local retailers
Postage: Large Royal Mail sorting office in Roseberry Avenue with significant number of jobs and
opportunities for career development and progression once employedKnowledge-driven sectors: It is estimated that knowledge intensive sectors in Islington account for around 54% of total employment, compared to London Central (40.5%) and national (25%). Between 2006-08 employment in knowledge-driven sectors in Islington increased by 11.9%, compared to 1.72% nationally Technology: The government has set aside £10m investment for ‘silicon roundabout’ – Tech city - at Old Street. There are a large number of technical firms in this area, including a vibrant new digital business sector. Most of the businesses are micro businesses but there are also a number of training providers. A couple of ‘big names’ - Google and UCL - have recently moved into the area. The sector has far reaching employment potential, ranging from creative and software design to coding and repair of IT equipment. It is spread across both Islington and Hackney and there are a number of initiatives to support students into digital technology and apprenticeships, as well as initiatives to promote business growth and attract inward investment to the area Arts / Creative industries: Islington has the highest number of arts organisations which are of strategic national importance of any local authority area, plus a wide range of other arts, entertainment, recreation industries within the borough or central London. Clerkenwell is home to a very large number of small firms associated with the creative industries. These industries are also well represented in the King’s Cross and Angel areas Finance sector: There are a large number of finance firms on the edge of the City in the Tech city / City Fringe area. Jobs will include ‘entry level’ such as Administration & other office assistants, Security, plus opportunities for those with higher level qualifications FE / HE: Universities, colleges and research institutions in Islington and central London – will include Entry Level support jobs as well as more specialist careers Impact of Development The Tech City/ Silicon Roundabout phenomenon appears to be having a significant influence on the local property market, with a number of recent significant property transactions and potential for expansion of commercial floorspace and associated increase in employment. The Farringdon and Kings Cross areas are also identified as property hotspots by various West End property firms, with Crossrail and improved Thameslink services at Farringdon, and investment in the Kings Cross area, improving the prospect of commercial and residential development. Farringdon in particular, has the potential for a signficant expansion of employment opportunities, as it will become London's key interchange for east-west and north-south rail services. However, a factor which may have the opposite effect, is the impending introduction of permitted development rights allowing a change of use from offices to residential without the need for planning permission. This government initiative, which it is thought will come into effect in May 2013, has the potential to have a profound effect on office supply and local businesses in Islington. In most parts of the borough residential values are greater than offices and so there could be a significant reduction in the number of business premises, displacing firms and increasing office rents, which may also drive firms elsewhere. The council has applied for an exemption in various areas within the borough, although it is thought that this is most likely to be successful for the Central Activities Zone (CAZ). The overall impact of these factors may therefore be an increase in (highly skilled) employment opportunities in the south of the borough and a loss of business premises and employment elsewhere. If an exemption is not granted for the CAZ, it is estimated that there could be a net loss of between 9,500 and 16,000 jobs over the period 2013-16 within Islington’s part of the CAZ, due to the loss of office space. Further information on the impacts of development and the proposed permitted development rights will be available from the Council as required.
Labour Market: future trends to 2020
The following summary is based on research by UK Commission for Employment & Skills (UKCES) as
set out in their report ‘Working Futures 2010-2020’. The report provides projections to 2020 for all
sectors of industry at a national level, and at a regional level

Headlines
   Growth and employment is expected to rise slowly to 2020
   During 2000-2010 the annual average rate of growth in London was higher than for any other
   region and is projected to continue to be the highest during 2010-2020
   Employment growth in London was the same as for the UK as a whole during 2000-2010 but is
   projected to be above the UK average during 2010-2020, representing one of the fastest rates of
   employment growth
   Over the decade as a whole, there is expected to be a net requirement of almost 14 million new
   job openings nationally, with 12m being as a result of replacement demand as opposed to 1.5m
   from new jobs
   Replacement will outweigh areas of decline. So although some sectors are expected to shrink,
   there will still be job openings. NB: This has important implications for career, education and
   training options since those occupations where employment is expected to decline may still offer
   good career prospects
   Demand for skills as measured by formal qualifications is projected to rise, as will the supply of
   those who have higher qualifications. Number of jobs in occupations requiring a degree expected
   to continue to grow, but more slowly than previously forecast
Areas of growth:
   Private services are expected to be the main source of jobs growth
   Business and other services will also be crucial
   Continued growth in higher skilled, white collar occupations, including managers, professionals
   and associate professionals – with almost half of this expected to be in London, South East and
   East of England
   Lower skilled jobs will remain a significant part of the labour market – increase in jobs around
   caring, personal and other service occupations and in low skilled elementary jobs in service based
   areas
Areas of decline:
   Shift away from public sector activities
   Continued decline in skilled and semi-skilled manual roles, including in skilled trade occupations
   and process, plant and machine operatives
   Administrative and secretarial occupations will also see a loss
Broad Sector Trends: National picture
Appendix E provides an overview of sector trends for all key sectors in London & Islington. A
summary of the main trends across the six broad overarching sectors is as follows:
   Primary & utilities sector (includes agriculture, mining, quarrying, electricity, gas, water)
   Sector will continue to experience significant job losses – sharp declines for mining & quarrying
   slightly offset by electricity, gas, water, agriculture
   Manufacturing
   Average 2 ½% growth expected
   Faster growth in some technology and R&D related industries e.g. chemicals and engineering
   Continued long-term decline in employment in manufacturing, particularly textiles and clothing
   though other areas will also see significant declines
   Construction
   Forecasting a similar rate of growth to Manufacturing, despite current uncertainties in housing
   market, because sector is expected to benefit from demand for major infrastructure projects
   Employment is expected to increase slightly
   Trade, accommodation & transport (transport, comms, hotels & restaurants, distribution)
   Diverse prospects - Telecommunications shows the strongest growth
   Employment across the sector expected to rise, with most growth accounted for by jobs in
   distribution, retailing, and hotels and restaurants
   Business and other services (diverse range including computing services, business and finance)
   Hit hard by credit crunch and recession but expected to stage a recovery
   Employment forecast to increase, with ‘other business services’ (which includes computing
   services) expected to see the fastest growth
   Non-market services (public administration and defence, health and education services)
   1% growth expected – declines in most areas as cuts bite but expected to pick up longer term
   Slight decline in employment, with most of the projected job losses coming from public
   administration and defence

Broad Sector Trends: London
   During 2000-2010, growth was fastest in business & other services, non-market services and
   construction, but declined rapidly in the primary sector & utilities and manufacturing sectors
   Primary & Utilities and Manufacturing also displayed rapid employment decline but employment
   grew strongly in business & other services and non-market services
   For the decade 2010-2020 output is projected to grow in all sectors across London
   It will grow fastest in business & other services and trade, accommodation and transport
   Least growth in output (compared to other regions) will be in primary sector & utilities and
   manufacturing sectors
   London is projected to gain employment in all sectors except manufacturing and nonmarket
   services
   Employment in the primary & utilities sector is projected to recover from the rapid decline of
   2000-2010 with the fastest rate of employment increase of any region or nation, while
   employment in the construction sector will grow more slowly than the UK average
   London is projected to experience one of the fastest annual average rates of employment growth
   in the trade, accommodation and transport sector
   Employment in business services is projected to grow slightly slower than for the UK as a whole
Occupational Trends: National
Appendix E provides an overview of occupational trends for each of the key sectors across London
and Islington. A summary is set out below.
There is projected to be a polarisation of demand for skills, with growth at both top and bottom ends
of the skills spectrum. This appears to be an increasingly common feature across developed
economies. On the other hand, the continued restructuring of the retail and distribution sectors
appears to be leading to a much less optimistic picture for many lower level sales occupations.
After a long term decline, elementary occupations are projected to see a slight increase. The service
sector, in particular, is beginning to generate a number of extra jobs. The development of new
opportunities in call centres, fast food outlets, etc. look set to reverse the long term trend decline in
employment for such jobs, although some of these may fall within the more skilled customer service
occupations category.
Growth in:
   Managers, directors & senior officials (18%)
   Professional occupations (15%)
   Associate professional & technical occupations (14%)
   Caring, leisure & other service occupations (12%)
Reductions in:
   Administrative & secretarial occupations (-11%) although this category will still be a big employer
   in 2020
   Skilled trades occupations (-7%)
   Process, plant & machine operatives (-11%)

Occupational Trends: London
Managers, directors & senior officials
Over half of the growth in employment for managers, directors & senior officials between 2010 and
2020 is projected to occur in London, the South East, the East of England and the South West.

Professional occupations
The share of total employment accounted for by professional occupations is highest by far in London
(23 per cent in 2010, compared with the UK average of 17.8 per cent). The projected rate of increase
in employment between 2010 and 2020 for London is 17.2%

Associate professional & technical occupations
Associate professional & technical occupations represented 17.9% of total employment in London.
London will see the second biggest increase in employment at 16%

Administrative, clerical & secretarial occupations
Employment in administrative, clerical & secretarial occupations is projected to decline between
2010 and 2020 in all regions and nations. London is projected to lose 84 thousand jobs (16.9% of its
2010 employment)

Skilled trades occupations
The UK average share of employment in skilled trades occupations was 10.6% in 2010. This major
group displays the opposite pattern to higher-status white collar jobs, being under-represented in
London (7.4%) and the South East and over-represented elsewhere. Employment is projected to
decline in all regions and nations of the UK except Wales. London will see the lowest rate of job loss (-
3.7%)
Caring, leisure and other service occupations: The percentage employed in caring, leisure and other
service occupations in London in 2010 was 6.6%, below the 2010 UK average (9%). Employment is
projected to increase between 2010 and 2020 in all regions. London will see an increase of 14.1%

Sales and customer service occupations
This SOC major group represented 8.8% of total employment in the UK in 2010 but below average in
London at 7.3%. Employment is projected to decline most in South-East England and London with
London seeing a decrease of 10,000 jobs, or -3%

Process, plant and machine operatives
This is the smallest SOC major group, representing only 6.7% of total UK employment in 2010. There
is a strong south-east / north-west contrast in the spatial distribution of process, plant and machine
operatives. They comprised only 4.1% of employment in London. Employment is projected to decline
in all regions and nations. The smallest declines are projected for southern England

Elementary Occupations
In 2010, jobs classed as being elementary occupations accounted for 12.6% of all employment in the
UK. In most regions and nations, the percentage of jobs accounted for by this SOC major group is just
below the UK average. The lowest percentage is in London (10.7%). Employment in elementary
occupations is projected to increase in almost all regions. Projected employment increase for London
is 7,000 jobs or 1.8%.
Apprenticeships
Apprenticeships: the national picture
   There were 520,600 apprenticeship starts nationally in the 2011-12 academic year, 63,400 (14%)
   more than in 2010/11 and 240,900 (86%) more than in 2009/10
   There has been a sharp rise in the number of apprenticeship starts by people aged 25 and over -
   three-quarters of the total increase in the number of starts nationally over the last three
   academic years is accounted for by people aged over 25
   Higher Level apprenticeships still account for only 1% of the total, compared to 36% at Advanced
   Level and 63% at Intermediate Level
   Employers with fewer than 25 workers are responsible for delivering almost half of
   Apprenticeships, suggesting that engagement with larger employers has not been as
   successful as anticipated and that smaller employers remain crucial to the expansion of the
   Apprenticeships programme (but note the findings of the parliamentary commission that NAS
   has focused its efforts on larger employers and SMEs are struggling to engage – impact for
   Islington)
Apprenticeship starts: tops sectors
Nationally, there was an increase in apprenticeship starts across all sectors in 2011-12. Top sectors
were:
   Business, Administration & Law (164,830)
   Health, Public Services & Care (109,410)
   Retail & Commercial Enterprise (108,300)
   Engineering & Manufacturing Technologies (59,480)

Apprenticeship starts: top frameworks
Within sectors, there are a large number of Apprenticeship frameworks. Of the 192 different
frameworks available, the top starts nationally in 2011-12 were:
    -   Health and Social Care (70,820)                  -   Construction (13,560)
    -   Customer Service (59,090)                        -   Engineering (13,280)
    -   Business Administration(44,550)                  -   IT and Telecoms Professionals (11,600)
    -   Hospitality and Catering (35,540)                -   Accountancy (8,410)
    -   Retail (31,240)                                  -   Vehicle Maintenance and Repair (8,150)
    -   Children's Care Learning and Development         -   Driving Goods Vehicles (7,620)
        (25,840)                                         -   IT User (6,920)
    -   Industrial Applications (18,800)                 -   Warehousing & Storage (7,010)
    -   Hairdressing (16,610)                            -   Teaching Assistants (6,230)
    -   Active Leisure and Learning (15,640)             -   Electro-technical (4,980)
   Some popular frameworks saw decreases in the number of starts in 2011/12 compared to
   2010/11 e.g. Hairdressing (4% fall) and Vehicle maintenance (12% fall)
   Other popular frameworks saw large increases in the number of starts in 2011/12 compared to
   2010/11, including the health and social care framework which saw over 13,000 more starts
   Of the most popular frameworks in 2011/12, those which saw the biggest increases in the
   number of starts in percentage terms were health and social care, management and industrial
   applications, the last of which saw an increase of almost 400% between 2010/11 and 2011/12
Apprenticeship vacancies
In February 2013 there were 11,880 live Apprenticeship vacancies nationally.
Top vacancies by sector: Top sector vacancies by Level:
- Business, Administration & Law (4,400) - Intermediate (1,250)
- Retail & Commercial Enterprise (1,920) - Advanced (2340)
- Engineering & Manufacturing Technologies (1,919) - Higher (280)
- Health, Public Services & Care (1,750)
Latest Quarter data (Nov 2012 – Feb 2013)
267,400 Apprenticeship applications were submitted online during November 2012 and
January 2013 (Academic Year Q2 2012/13). This represents growth of 41% compared to the
same period the previous year
Apprenticeship vacancies have also witnessed significant growth. Nearly 25,400 vacancies
were advertised online in the three months – an increase of 26.6% on the previous year
The table below shows the top five Apprenticeship types applied for and vacancies advertised
in the quarter, and the most competitive vacancies in terms of number of applications
Top Five most competitive
Top Five Apprenticeship applications Top Five Apprenticeship vacancies
vacancies advertised online
Business and Administration (82290 Business and Administration (6,460
Health Pharmacy Services
applications made) vacancies posted online)
Children & Young People’s Workforce
Customer Service (2490) Animal Care
(Childcare) (21760)
IT, Software, Web & Telecoms
Customer Services (20520) Design
Professional (2040)
IT, Software, Web & Telecoms Children and Young People’s
Electro-technical (Electrician)
Professional Workforce (Child care) (1470)
Hospitality and Catering (9530) Hospitality and Catering (1330) Vehicle Maintenance & Repair
Apprenticeships: the London picture
Historic take up lower than elsewhere
Until recently, London had the lowest take up rate of Apprenticeships. Association of
Accounting Technicians (AAT) research (Nelson Report 2011) found that areas in Inner
London had some of the lowest take up rates of apprenticeships across the country
Young people in the North of England were 70% more likely to enrol on an Apprenticeship
than their southern peers. Young Londoners were the least likely to be on an Apprenticeship
programme
Islington had one of the lowest take up rates across the country – the table below shows the
bottom 10 local authority districts in terms of rates of participation in apprenticeships
Local Authority District Total 16-24s Apprentice starts 2009-10 % starting apprenticeships
1 Kensington and Chelsea 19200 150 0.78%
2 Kingston Upon Thames 23900 300 1.26%
3 Camden 29200 370 1.27%
4 Wandsworth 32800 440 1.34%
5 Barnet 37000 520 1.41%
6 Westminster 28000 410 1.46%
7 Richmond Upon Thames 18300 270 1.48%
8 Islington 25800 410 1.59%
9 Hammersmith and Fulham 19900 340 1.71%
10 Redbridge 35000 610 1.74%The current position: significant improvement in take up
London saw the biggest percentage increase (132%) over the 3 years from 2009-10 – 2011-12.
By the end of 2010/11, London recorded the sixth largest take-up of the nine English regions
London had 47,230 apprenticeship starts in 2011-12 (16,760 Inner London, 30,470 Outer London)
of which 890 were in Islington
Strong growth in Apprenticeship starts at both Level 2 and Level 3 and above, with the
strongest growth taking place at Level 3
Latest Quarter data (Nov 2012 – Feb 2013) shows that:
- London had the biggest competition for online vacancies with the highest number of
applications per vacancy advertised
- Employers in London advertised the most vacancies during the period (3,970)
- London had the second highest increase (57.5%) compared to the same quarter last year in
the numbers of vacancies advertised
- London registered the most Apprenticeship applications during the period (60,490)
Top sectors in London
In London, top sectors in terms of Apprenticeship starts in 2011-12 were:
Business, Administration & Law 28%
Retail 20%
Health & Social Care 22%
Construction & Engineering 10%
Other 20%
NB: % of Construction & Engineering starts in London is lower than in other regions whilst starts
in other sectors, such as ICT or Education is higher than other regions
Apprenticeships: Recent Research & Reviews
House of Commons, Business, Innovation and Skills Committee 2012-13
The Committee welcomed the growth in apprenticeships but felt that the apprenticeship scheme
continues to lack clarity and purpose in the longer term. Employers, apprentices and other
stakeholders remain confused about the overarching objective of the scheme. Recommendation
that the Government defines an overarching strategy and clear purpose for the apprenticeship
programme
The National Apprenticeships Service (NAS) has placed too much emphasis on numbers and not
enough on quality, though NAS will now start to focus on quality
Still low awareness within schools and some evidence to show there remains a stigma attached to
a student actively choosing vocational training (such as an apprenticeship)
Partly addressed through legislation – Education Act 2011 specifies that apprenticeships must be
mentioned as one of the options for 16-18 year olds
Despite this, awareness and resources in schools and colleges remains lacking. The Committee
recommended that the Department for Education does more to assist schools in the promotion
of vocational training in the curriculum (for example by providing literature, training to teachers
and information for careers advisors). It should also ensure that any changes to the secondary
curriculum will put proper emphasis and value on pupils taking a vocational route in their careers.
The time and resources that institutions dedicate to ‘UCAS applications’ compared to preparing
students for vocational training illustrates the scale of the problem.
NAS does not appear to work proactively with schools – they see the primary responsibility
resting with schools so they are responsive to schools rather than proactively engaging with
them. The Committee disagreed with this - The National Apprenticeship Service should be a
familiar name, known to all students and teachers as an authoritative source of informationabout apprenticeships. We recommend that NAS is given statutory responsibility for raising
awareness of apprenticeships for students within schools.
Equalities issues – low take up and barriers for females, BME, disabled, learning disabilities
NAS focus on larger employers and less so on SMEs. A large number of SMEs have struggled
to engage with the apprenticeships programme. Islington has a lot of SMEs which may partly
explain the low level of take
London Skills & Employment Observatory: ‘Apprenticeships in London, Where do we
go from here?’ Nov 2011
LSEO research found a mismatch between skills needs in emerging sectors and Apprentice starts by
sector
The 2010 skills strategy emphasised the role for Apprenticeships in addressing skills need and
supporting the development of new and emerging sectors. The London Statement of Skills Priorities
2010 identified that the strongest growth sectors in London are likely to be:
Business services (404,000 new jobs by 2020)
Creative and cultural industries (70,000)
Hotels and restaurants (35,000)
Retail (32,000)
Transport and communications (30,000)
Low carbon (18,000 new jobs by 2013)
This compares to the actual pattern of Apprenticeship starts by sector (2009/10):
Business, administration and governance 2,530 starts (12.4% of the total)
Children and young people 2,430 (11.9%)
Customer service and contact centre 2,190 (10.7%)
Active leisure, learning and wellbeing 1,600 (7.9%)
Hair and beauty 1,580 (7.8%)
Hospitality, leisure, travel and tourism 1,440 (7.1%)
LSEO found that in recent years, London has had lower than average Apprenticeship penetration
rates in all employment sectors. This is likely to be linked to the supply of potential employees
and the relative lack of sectors traditionally associated with Apprenticeships. These factors are
likely to lead to low awareness and, therefore, understanding amongst employers in the
dominant London sectors. However, low penetration rates in some of London’s largest
employment sectors may be potential areas for growth.
This includes finance, accountancy and financial services, and retail.
London includes notable ‘hot-spots’ of particular sectoral activity (the Silicon Roundabout, Canary
Wharf, etc.) where economies of scale could be achieved through targeting Higher Apprenticeship
Fund and linking this to the creation of new Apprenticeship frameworks and greater Apprenticeship
promotion.
This briefing was produced by:
Chief Executive’s Department, London Borough of Islington
April 2013
For further information, please call 020 7527 3244You can also read