THE CRUISE INDUSTRY - Contribution of Cruise Tourism to the Economies of Europe 2015 Edition
←
→
Page content transcription
If your browser does not render page correctly, please read the page content below
THE CRUISE
 INDUSTRY

Contribution of Cruise Tourism to the
 Economies of Europe 2015 Edition

CLIA Europe Members Lines

Foreword

Dear friends,

Welcome to the 2014 CLIA Europe Economic Contribution Report. Prepared every year by G.P. Wild
(International) Limited and Business Research Economic Advisors, this report illustrates how the
international cruise industry generates economic growth, investment and jobs across the European Union.

This new edition confirms once again cruising’s enormous contribution to the European economy at a
crucial point in its recovery. The cruise industry continues to create vital jobs and wealth as the continent
slowly but surely emerges from the devastating economic slump.

There are three reasons why Europe is a key market for the global cruise industry.

First, with 6.39 million Europeans cruising in 2014, Europe represents the second biggest source market
worldwide, after the USA. Second, Europe is also the number two cruise destination in the world, after the
Caribbean, having received 5.85 million cruise passengers last year. Third, Europe’s world-class shipyards
continue to exercise near-total control over the global order book, being scheduled to build 29 oceangoing
cruise ships to be delivered until 2018.

All of this translates into economic value and jobs for Europe. Our industry’s total economic output reached
€40.2bn in 2014, up 2% from the previous year, including €16.6bn in direct spending by cruise lines, their
passengers and crew. Last year the cruise industry also accounted for nearly 350,000 European jobs –
close to 10,000 more than the previous year – amounting to €10.75bn in employee compensation.

And yet we are not complacent; quite the contrary. We strongly believe that the cruise industry can
and must be an even bigger player in Europe’s economy. More can be done, particularly bringing non-
Europeans to our shores. Of the 5.85 million passengers embarking on their cruises from a European port,
only one million came from outside Europe, a fact that underlines the need for regulators to unlock this
tremendous potential.

CLIA Europe constantly engages with policymakers and regulators from the EU and its Member States to
make sure that Europe remains a good place to do business.

We remain confident that, with the right frameworks in place, the cruise industry will continue to thrive and
so deliver sustainable economic value to Europe for years to come.

Pierfrancesco Vago
Chairman, CLIA Europe and Executive Chairman, MSC Cruises

                                                                    Contribution of Cruise Tourism to the Economies of Europe 2015 Edition   1
Table of Contents

Foreword                                                                      1
Executive Summary                                                            3
Report Summary                                                               4
Overview – Facts and Figures                                                  7
Cruise Industry Expenditures by Country                                      8
A Global Industry                                                            9
European Cruise Ports                                                        10
Cruise Passengers Source Markets                                             12
Shipbuilding in Europe                                                       14
Direct Cruise Industry Expenditures in Europe                                15
The Economic Benefits of Cruise Tourism                                      18
Glossary of Specialist Terms and Abbreviations                               25
Sources of Information                                                       25

GP Wild (International) Limited and Business Research
and Economic Advisors (BREA) were engaged by
CLIA Europe to conduct a comprehensive analysis of
the global cruise industry’s operations in Europe and its
contribution to the European economy using the most
recent available statistics.

2   Contribution of Cruise Tourism to the Economies of Europe 2015 Edition

Executive Summary

G. P. Wild (International) Limited and Business Research and Economic Advisors were engaged by
CLIA Europe to conduct a comprehensive analysis of the global cruise industry’s operations in Europe
and its contribution to the European economy in 2014. For the purposes of this report, unless otherwise
stated, Europe is defined as the EU with 28 members plus Switzerland, Norway and Iceland. The EU-28
member states are fully defined in the Glossary.1

Some of the major highlights of cruise operations in Europe during 2014 were:
l   During 2014 there were 42 cruise lines domiciled in Europe, operating 123 cruise ships with a
    capacity of around 146,000 lower berths. Another 60 vessels with a capacity of around 89,000
    lower berths were deployed in Europe by 18 non-European lines.
l   An estimated 6.4 million European residents booked cruises, a 0.5% increase over 2013,
    representing about 30% of all cruise passengers worldwide.
l   An estimated 5.85 million passengers embarked on their cruises from a European port, a 3.6%
    decline from 2013. Of these around 4.9 million were European nationals and about 0.9 million
    came from outside Europe.
l   The vast majority of these cruises visited ports in the Mediterranean, the Baltic and other
    European regions, generating 29 million passenger visits at a total of around 250 European
    port cities, a decrease of 7.1% from 2013.
l   In addition, an estimated 14.4 million crew also arrived at European ports.

As a result of the European cruise operations and the investment in new cruise ships by the global cruise
industry, this industry generated significant economic impacts throughout Europe. In 2014, cruise industry
direct expenditures grew by 2.8% from 2013 to €16.6 billion. As will be discussed below this increase was
the net result of gains in shipbuilding, cruise line expenditures and employee compensation which were
partially offset by a drop in passenger and crew expenditures. The total economic impacts of the cruise
industry included the following:
l   €40.2 billion in total output2
l   €16.6 billion in direct spending by cruise lines and their passengers and crew
l   348,930 jobs3
l   €10.75 billion in employee compensation4

These impacts are the sum of the direct, indirect and induced impacts of the cruise industry.
In summary, each €1 million in direct cruise industry expenditures generated:
l   €2.42 million in business output
l   19 jobs paying an average annual wage of nearly €33,700.

    1
        The EU was expanded to 28 states effective as of 1 July 2013 through the addition of Croatia. The scope of the report on
        2014 has been extended to cover the EU–28.
    2
          y definition, total output includes all intermediate inputs, taxes net of subsidies, net surplus (profits, net interest,
         B
         dividends and other items) and employee compensation.
    3
         Full time equivalents.
    4
          s defined by the OECD. Compensation and remuneration are used interchangeably in the report and are considered
         A
         to mean the same thing. Also, compensation is included in output.

                                                                                              Contribution of Cruise Tourism to the Economies of Europe 2015 Edition   3
Report Summary

Direct Economic Impacts                                                       l    Cruise lines employed about 5,400 European nationals in
                                                                                   their headquarters and administrative offices.
The direct economic impacts include the production,
employment and employee compensation that were generated                      l    An estimated 59,500 European nationals were employed as
in those European businesses that supplied goods and services                      officers and ratings on cruise ships.
to the cruise lines and their passengers and crew. The direct                 These expenditures generated employment and employee
impacts also include the compensation paid to the European                    compensation across a wide range of industries and in virtually
employees of the cruise lines.                                                every country that sourced passengers and/or hosted cruise
In 2014, the cruise industry generated direct expenditures of                 ship calls. As indicated in Table ES - 1, the €16.6 billion in direct
€16.6 billion. These expenditures included the following:                     expenditures generated about 169,800 direct jobs paying
                                                                              €5.09 billion in employee compensation.
€4.55 billion in spending for the construction of new cruise
ships and the maintenance and refurbishment of existing ships                 Table ES – 1: Direct Economic Impacts of the European
with European shipyards, a 12.8% increase from 2013. This was                 Cruise Sector by Industry, 2014
the third successive annual increase following three consecutive
                                                                                  Industry j                   Expenditures                     Compensation
years in which these expenditures had fallen. The €520 million                                                   € Million
                                                                                                                                    Jobs
                                                                                                                                                  € Million
increase in shipbuilding and maintenance expenditures was
                                                                                  Agr., Mining & Constr. k         €20               171              €4
the primary driving force behind the cruise industry’s European
growth in 2014. These expenditures accounted for virtually the                    Manufacturing                   €7,988          42,559            €1,707
entire increase in direct cruise industry expenditures.                            Non-durable Goods              €2,023           6,744             €246
                                                                                   Durable Goods                  €5,975           35,815           €1,461
l   At the outset of 2014 there were 23 cruise ships on the order
    books of the European shipyards.                                              Wholesale &
                                                                                                                   €812            11,150            €222
                                                                                  Retail Trade
l   Currently, including deliveries during the first half of 2015,                Transportation
    European shipyards are under contract to build 29 cruise                                                      €3,696           21,902           €805
                                                                                  & Utilities
    ships with a combined value of €16.0 billion through to 2018.                 Hospitality l                    €407            6,421             €143
€6.97 billion in spending by cruise lines with European                           Financial and
                                                                                                                  €1,576           13,419            €463
businesses for goods and services in support of their cruise                      Business Services
operations was virtually unchanged from 2013, showing                             Personal
                                                                                                                   €647            9,336             €266
an increase of 0.8%. Among the major expenditures were                            Services & Govt.
the following.                                                                    Subtotal                        €15,156         104,958           €3,610
l   Cruise lines purchased nearly €670 million in provisions                      Cruise Line Employees           €1,480           64,873           €1,480
    consumed on board cruise ships from European food and                         Grand Total                    €16,637          169,831          €5,090
    beverage manufacturers.
                                                                              j The aggregate (bold) and sub-industries are based on standard industry
l   An estimated €775 million in commissions were paid to                        definitions used by the OECD in its input-output accounts. The level of detail in
    European travel agents.                                                      each table may vary but the definitions remain the same.
                                                                              k Agr, Mining & Constr. is the aggregation of the Agriculture, Mining and
l   The cruise lines spent €1.39 billion on financial and business               Construction industries. Generally, the estimated impacts for each of these
    services including: insurance, advertising, engineering and                  industries is too small and imprecise to show.
    other professional services.                                              l Hospitality includes hotels, restaurants and bars and amusement and
                                                                                 recreation establishments.
€3.64 billion in cruise passenger and crew spending.
Passenger expenditures included spending for shore
excursions, pre- and post-cruise hotel stays, air travel and other            The following three economic sectors accounted for more than
merchandise at ports-of-embarkation and ports-of-call. Crew                   75% of the direct economic impacts of the European cruise
spending was concentrated in expenditures for retail goods and                industry:
food and beverages.                                                           l   	The Manufacturing sector, led by the shipbuilding industry,
Given the 3.6% decline in embarkations and the 7.1% decline in                      accounted for 48% of the cruise industry’s direct expenditures,
passenger visits at European ports-of-call, total passenger and                     25% of the direct jobs and 34% of the direct employee
crew expenditures declined by 4.2% from 2013.                                       compensation. All of these percentages increased from 2013
                                                                                    as a direct result of the increase in shipbuilding expenditures.
l   Including airfares, embarking passengers spent an average
    of €292.
                                                                              l    European employees of the cruise lines accounted for 38%
                                                                                   of the direct jobs generated by the cruise industry and 29%
l   Excluding airfares, cruise passengers spent an average                         of the compensation. These percentages are virtually
    of €81 at embarkation port cities.                                             unchanged from 2013.
l   On average, cruise passengers then spent another €62 at                   l    The Transportation and Utilities sector, excluding the direct
    each port visit on their cruise itinerary.                                     employees of the cruise lines and their wages but including
l   Crew spending at each port call averaged €23 per crew                          tour operators and travel agents among others, accounted
    member.                                                                        for 22% of the direct expenditures, 13% of the direct jobs and
                                                                                   16% of the compensation impacts. As a result of the decline
€1.48 billion in wages and salaries plus benefits, an increase of                  in cruise calls and passenger visits from 2013, each of these
2.2% from 2013, were paid to the European administrative staff                     percentages fell from 2013.
and crew of the cruise lines.

4    Contribution of Cruise Tourism to the Economies of Europe 2015 Edition
Report Summary

Total Economic Impacts                                                                  l    Serving as major source and destination markets for cruise
                                                                                             passengers.
The total economic impacts are the sum of the direct, indirect
and induced impacts. The indirect impacts result from the                               l    Maintaining headquarters facilities and providing crew.
spending by the directly impacted businesses for those goods                            l    Providing shipbuilding and/ or repair services.
and services they require to support the cruise industry. The
induced impacts result from the spending by the impacted                                l    Provisioning and fuelling of cruise ships.
employees for household goods and services. Thus, the indirect
impacts primarily affect business-to-business enterprises while                         Table ES – 3: Total Economic Impacts of the Cruise Sector by
the induced impacts primarily affect consumer businesses. The                           Country, 2014
total economic impacts are shown in Table ES – 2.                                                                 Direct      Growth
                                                                                                                                           Total    Compensation
                                                                                            Country            Expenditures    from
The total economic impacts are more evenly spread among                                                          € Million     2013
                                                                                                                                           Jobs       € Million
the various industries than the direct economic impacts as the
indirect and induced impacts affect non-cruise sectors. Yet                                 Italy                €4,601        0.7%       102,284      €3,111
the manufacturing (primarily shipbuilding) and transportation                               Germany              €3,254        6.3%       49,559       €1,801
sectors still account for more than half of the cruise industry’s                           UK                   €3,155        1.0%       71,022      €2,594
total impact throughout Europe.                                                             Spain                €1,208        –1.4%      25,483       €763
l    The Transportation and Utilities sector, including the                                 France                €1,117       3.9%        15,101      €658
     employees of the cruise lines, accounted for 21% of the total                          Top 5                €13,385       2.5%       263,449     €8,927
     output, 31% of the total employment and 29% of the total                               Norway                €591         –2.5%       14,745      €477
     compensation impacts.
                                                                                            Finland               €582         12.4%       8,743       €330
l    The Manufacturing sector, which includes the shipbuilding                              Greece                €506        –11.8%       10,136      €190
     industry, accounted for 36% of the total output, 24% of the
                                                                                            Netherlands           €399         11.8%       6,481       €187
     jobs and 30% of the total compensation generated by the
                                                                                            Sweden                €228         11.2%       3,022        €119
     cruise industry.
                                                                                            Next 5               €2,306        2.%         43,127     €1,303
Table ES – 2: Total Economic Impacts of the European Cruise                                 Rest of the EU+3      €946         8.5 %      42,354       €523
Sector by Industry, 2014 j
                                                                                            Total                €16,637       2.8%       348,930     €10,753
    Industry                   Expenditures                      Compensation
                                                    Jobs
                                 € Million                         € Million
                                                                                        The remaining two countries in the top five tended to be
    Agr., Mining & Constr.        €2,353            17,295            €332              impacted in one or two major segments:
    Manufacturing                €14,529           82,227             €3,176
                                                                                        l   	Spain serves primarily as a source and destination market
     Nondurable Goods             €4,645           20,089             €728
                                                                                              with some headquarters operations.
     Durable Goods                €9,884            62,138           €2,448
                                                                                        l   	France is principally a source and destination market with the
    Wholesale &
    Retail Trade
                                  €2,382            31,266            €569                    addition of shipbuilding.
    Transportation
                                  €8,561          108,790             €3,141
                                                                                        As shown in Table ES – 3 the top five countries experienced a
    & Utilities k                                                                       combined 2.5% growth in direct cruise industry expenditures
    Hospitality                   €1,246            17,033            €377              during 2014. Germany led the way with a 6.3% increase in
    Financial and                                                                       direct expenditures and accounted for nearly 60% of the
                                  €9,279            66,852           €2,363
    Business Services                                                                   net increase in expenditures among the top 5 countries.
    Personal Services                                                                   Spending increased in each of the four expenditure categories
                                  €1,873           25,467             €795
    & Govt                                                                              in Germany. Shipbuilding led the way with an 8.0% increase
    Total                        €40,223          348,930           €10,753
                                                                                        followed by cruise lines and passenger and crew expenditures,
                                                                                        each with a nearly 5.0% increase. Compensation of cruise line
j Since compensation is included in total output, these impacts are not additive.
                                                                                        employees residing in Germany increased by 2.6%.
   Output is a measure of the industry’s impact on the overall economy while
   compensation is a measure of the industry’s impact on employees and the
                                                                                        The UK and Italy experienced smaller gains in direct cruise
   household sector.                                                                    sector expenditures with respective gains of 1.0% and 0.7%.
k Includes the European employees of the cruise lines and their compensation.           The growth in the UK was led by a 2.0% increase in spending
                                                                                        by cruise lines, including the compensation of their employees
Country Impacts                                                                         residing in the UK. This gain was partially offset by a 3.5%
The economic impacts were spread throughout Europe. However,                            decline in the combined spending of passengers and crew and
as indicated in Table ES – 3 the majority of these impacts were                         ship repair expenditures.
concentrated in five countries, which accounted for about 80%                           As noted above, Italy experienced a 2.5% increase in direct
of the cruise industry’s impacts throughout Europe.                                     cruise industry expenditures in 2014. This growth in spending
The three countries of Italy, Germany and the UK accounted                              was the net result of a 19% increase in spending at Italian
for 66% of the direct expenditures of the cruise industry.                              shipyards which was partially offset by a 5.3% decline in
Primarily due to the 6.3% increase in Germany, these three                              expenditures by the cruise lines and their passengers and
countries experienced a combined increase of 2.4% in direct                             crew for goods and services in support of cruises, including
expenditures from 2013. These countries participated in all                             employee compensation.
segments of the industry:

                                                                                     Contribution of Cruise Tourism to the Economies of Europe 2015 Edition        5
Report Summary
Direct cruise sector spending rose by 3.9% in France during Figure ES – 1: Direct Cruise Industry Expenditures in Europe,
2014. As in Germany, spending increased in each of the four 2009–2014
expenditure categories. Passenger and crew expenditures led €18.0
€16.2 €16.6
€15.5
the way with a 7.7% increase followed by a 2.3% increase in €16.0
€14.1 €14.5
€15.0
€14.0
the compensation of cruise line employees residing in France. €12.0
Cruise line purchases for goods and services rose by 2.0% €10.0
while expenditures at French shipyards rose by 1.4%. €8.0
€6.0
Finally, direct expenditures in Spain declined by 1.4% during €4.0
2014. Spending by passengers and crew at Spanish port cities €2.0
decreased by 5.1% primarily due to a 6% fall in embarkations €0.0
2009 2010 2011 2012 2013 2014
and transit visits at Spanish ports. Cruise line expenditures with Passenger & Crew Purchases Value of Shipbuilding Cruise Employees Compensation Cruise Line Purchases
Spanish business in support of their cruises declined at a similar
While total direct expenditures of the cruise industry have
rate, 5.5%. These spending losses were only partially offset by a
steadily increased over the five-year period, the growth in
21% increase in expenditures by cruise lines for ship repair and
spending by category has varied. Over the five-year period,
employee compensation.
spending by cruise lines for goods and services and employee
Five-year Growth Trend compensation has increased each year, averaging 5.2% per year.
Expenditures for shipbuilding and repair declined in 2009, 2010
Since 2009 European-sourced passengers have grown by 29% and 2011 primarily in response to recession conditions, they have
from 4.94 million in 2009 to 6.39 million in 2014. Following a since rebounded in the following three years. Since 2011, annual
sharp recovery in passenger growth in 2010 and 2011 after the shipbuilding and repair expenditures have increased by 21% from
2009 recession, growth has slowed and has averaged just 1.7% €3.8 billion in 2011 to €4.6 billion in 2014.
per year over the past three years.
Given the contraction of embarkations and transit passenger
Embarkations at European ports have grown at a more visits at European ports, passenger and crew expenditures fell
moderate pace of 21% over the 5-year period, increasing from by 4.2% in 2014 after positive gains in each of the previous
4.83 million in 2009 to 5.85 million in 2014. Overall, weakness years since 2005.
in the economies of southern Europe and political turbulence in The total output of the industries affected by the direct, indirect
parts of the region have resulted in a redeployment of capacity and induced impacts of the European cruise industry has risen
away from Europe. As a result, embarkations at European ports by 18% from €34.1 billion in 2009 to €40.2 billion in 2014. The
declined by 3.6% in 2014. stronger growth in total output relative to the increase in direct
Finally, port-of-call passenger visits have risen by 22% over expenditures is partially the result of improved productivity
the 2009–2014 period, growing from 23.76 million to 28.96 throughout most European industries.
million. Once again, the reduced capacity, especially in the Figure ES – 2: Total Output Generated by Cruise Industry
Mediterranean, resulted in a 7.1% decline in passenger visits Expenditures in Europe, 2009 – 2014
in 2014. €41 €40.22
€40 €39.36
Table ES – 4: European Passenger Statistics, 2009 – 2014 €39
€37.86
Millions €38
€36.73
€37
% Change €36
Billions
Category 2010 2011 2012 2013 2014 €35.17
2009–2014 €35
€34.10
European-Sourced €34
5.57 6.07 6.14 6.36 6.39 29.2%
Passengers €33
Percent Change 12.6% 9.0% 1.2% 3.6% 0.5% €32
€31
Embarkations from 2009 2010 2011 2012 2013 2014
5.28 5.59 5.77 6.07 5.85 21.1%
European Ports
The total employment associated with the total output
Percent Change 9.3% 5.9% 3.2% 5.2% –3.6% discussed above has increased by 18% from 296.3 thousand
Port-of-Call
25.18 27.50 28.69 31.19 28.96 21.9%
jobs in 2009 to 348.9 thousand jobs in 2014. The total
Passenger Visits employment impact in 2009 was the recession-induced low for
Percent Change 6.0% 9.2% 4.3% 8.7% –7.1% the cruise industry. The total employment impact has increased
each year since and has averaged 3.3% per year over the five-
Note: Historical data for European-sourced passengers has been revised to be year period.
consistent with data published by IRN Research.
Figure ES – 3: Total Employment Generated by Cruise
Industry Expenditures in Europe, 2009 – 2014
Since 2009, direct expenditures have increased by 18% from 400
€14.1 billion in 2008 to €16.6, 3.4% over the five-year period. 350 339.4
348.9
315.5 326.9
Figure ES – 1 clearly shows the impact that the contraction in 300
296.3 307.5
48.8 50.4 51.4
46.1 47.7
the value of shipbuilding from 2009 through 2011 has had on 250
44.1
Thousands
the growth trend for direct cruise expenditures, which finally 200 111.0 114.8 119.5 124.2 127.7
109.0
experienced a rebound in growth in 2012 through 2014 after 150
remaining virtually flat over the prior three years. With the
100
increase in shipbuilding over the 2012–2014 period, the overall 143.2 150.4 153.0 158.7 164.8 169.8
50
growth in direct expenditures has averaged nearly 3.5% per
0
year over the past three years. 2009 2010 2011 2012 2013 2014
Direct Impacts Indirect Impacts Induced Impacts
6 Contribution of Cruise Tourism to the Economies of Europe 2015 Edition
1. An Overview of the Importance of the European Cruise Industry – Facts and Figures
The cruise industry in Europe5 is a dynamic source of economic l Cruise passengers and crew spent an estimated €3.64
activity providing economic benefits to virtually all industries billion in purchases during their port visits, ranging from
and countries throughout Europe. accommodations to retail purchases of jewellery, clothing and
other similar items. This represented a 4.2% decrease from
Cruise tourism in Europe impacts all of the major aspects of
l
2013. This follows increases of 4.5% in 2013, 5.7% in 2012
the industry, including: ports of embarkation, ports-of–call,
and 10.7% in 2011. In fact this is the first decline in passenger
shipbuilding, ship maintenance, provisioning, sales and
and crew spending since this report was initiated in 2005.
marketing and the staffing of cruise ships and administrative
facilities. Fiscal and economic conditions in Europe during l Europe is also the centre of and world leader in cruise ship
2014 continued to constrain the growth in demand. In construction and refurbishment. After three successive
addition the contraction in deployed capacity in Europe has years of decline from 2009 through 2011, spending for new
resulted in a reduction in cruise passengers and crew visits at buildings and maintenance at European shipyards has now
a many European ports. increased in each of the last three years having reached €4.6
billion in 2014, an increase of 12.8% over 2013.
An estimated 6.4 million European residents booked cruises in
l
2014, a 0.5% increase over 2014. l Included in the €16.2 billion is €1.48 billion in compensation
paid to employees of the cruise industry that reside in Europe.
In 2014, Europeans represented 29.0% of all cruise
l
Total employee compensation grew by 2.2% in 2014.
passengers worldwide, compared with 21.7% ten years earlier.
l Finally, the cruise lines also spent another €7.0 billion
About 5.9 million passengers embarked on their cruises from
l
with European businesses to support their cruise and
a European port, a 3.6% decline from 2013. Around 4.9 million
administrative operations, an increase of 0.8% from 2013.
(83%) were European nationals.
l This spending by the cruise lines and their passengers and
The vast majority visited ports in the Mediterranean, the Baltic
l
crew generated an estimated 348,9317 jobs throughout
Sea and other European regions and generated 29 million
Europe through the direct, indirect and induced economic
passenger visits during 2014, a 7.1% decrease from 2013.
impacts. This is a 2.8% increase from 2013.
Cruise lines visited a total of around 250 European port cities
l
l In turn, the workers in these jobs produced an estimated
including in the Black Sea and Atlantic Isles.
€40.2 billion in total output and received €10.75 billion in
In addition, an estimated 14.4 million crew also arrived on
l total (direct, indirect and induced) compensation. The total
board cruise ships calling at European ports during 2014. output impact increased by 2.2% while the compensation
impact rose by 2.4% from 2013.
The cruise industry’s direct spending made by the cruise lines6
and their passengers and crew throughout Europe increased by
2.8% in 2014 to €16.6 billion after increasing by 4.7% in 2013 Cruise New Building and Investment 2015–18
and 3.4% in 2012.
l Over the period from 2015 to 2018, 31 cruise vessels have been
Figure 1.1: Direct Cruise Industry Expenditures in Europe, 2014 scheduled for delivery for worldwide trading with capacity for
93,300 passengers of which 29 will be constructed in Europe
€16.6 Billion and two in Japan. In addition a further four ships are already
Passenger &
on order for 2019–20, all in European yards. Thus, from the
Crew Purchases
Cruise Line beginning of 2015 through 2021, Europe will account for 34 of
€3.64
Purchases the 36 new cruise ships to be constructed.
22%
€6.97 l Out of the 2015–18 total, 10 ships with 30,375 berths (30.0%)
42%
will primarily serve the European source market, representing
an investment of €5.2 billion. Many of the others will visit
European destinations. This new investment underlines the
cruise industry’s continuing commitment to the future of its
business both in Europe and elsewhere in the world.
Cruise Value of
Employees Shipbuilding Table 1.1: Cruise Ship Orders 2015–18
Compensation €4.55
27% Investment
€1.48 Year Completed Ships Berths
(Millions)
9%
2015 7 18,930 € 3,335
2016 11 28,546 € 5,475
2017 6 22,124 € 3,936
5
he European cruise industry is defined as those cruise-related activities that
T 2018 7 23,708 € 4,211
take place within Europe including cruise itineraries that visit European ports
and destinations and also directly impact businesses and individuals located Total 31 93,308 € 16,957
in Europe. It is broadly defined to include cruise lines and their employees; the
direct suppliers to the cruise lines, such as wholesale distributors, stevedor-
ing firms, and financial and business service providers, such as insurers and
l 2014 saw a net increase of 5 in the cruise ship order book
consultants; shipyards; and cruise passengers. with six deliveries and 11 new orders. Although Europe
6
ruise lines are defined as those cruise companies that offer multi-day cruises
C continues to dominate the cruise shipbuilding market, the
in open waters. This definition thus excludes companies that offer emergence of competition from China remains a possibility,
river cruises. although Japan appears to have been discouraged by its
7
These are full time equivalent jobs (FTEs). current experience from further competing in the market.
Contribution of Cruise Tourism to the Economies of Europe 2015 Edition 7
2. Cruise Industry Expenditures by Country

The cruise industry generated an estimated €16.6 billion
in direct expenditures throughout Europe in 2014. These
expenditures were derived from four major sources:
	cruise passengers;
l

	the construction and maintenance of cruise ships;
l

	cruise line purchases in support of their operations; and
l

	compensation of cruise line administrative staff and crew
l

  in Europe.
Furthermore, this spending impacted to some degree on each
of the 31 European countries included in the analysis.
	The top ten countries accounted for 94% of the cruise
l

  industry’s expenditures throughout Europe.
	Italy, as a leading centre for cruise ship construction in Europe
l

  (together with Germany) and the largest cruise embarkation
  and destination market, benefited from €4.6 billion in direct
  cruise industry expenditures, an increase of 0.7% over 2013.
	Germany was the largest market for cruise ship construction
l

  and maintenance and also the largest source market for
  passengers in Europe in 2014. Spurred by an 8% increase in
  cruise ship construction at German yards and a 5% increase
  in passenger and crew spending at German ports, total direct
  spending by the cruise industry in Germany rose by 6.3% from
  2013 to €3.25 billion in 2014.
	The UK is the second largest source market for cruise
l

  passengers in Europe with 1.61 million residents taking cruises
  during 2014. It ranks third in terms of cruise industry direct
  spending with €3.15 billion, a 1.0% increase over 2013.

Figure 2.1: Cruise Industry Direct Expenditures by Country,
2014, Millions

                               All Europe: € 16.6 Billion
           Italy                                                            €4,601
      Germany                                                 €3,254
            UK                                            €3,155
          Spain                     €1,208
        France                     €1,117
        Norway             €591
        Finland            €582
        Greece             €506
    Netherlands          €399
       Sweden           €228
Rest of Europe                    €996

                   €0      €1,000           €2,000   €3,000        €4,000   €5,000

The six major centres for cruise ship construction and
maintenance, Germany, Italy, France, Spain, Finland and the UK,
were among the top ten countries for cruise industry spending.
These six countries accounted for 90% of construction and
maintenance of cruise ships globally and 84% of total industry
expenditures in Europe during 2014.

8    Contribution of Cruise Tourism to the Economies of Europe 2015 Edition
3. A Global Industry
The cruise industry has enjoyed dynamic growth over a period l In 2004 an estimated 2.8 million Europeans cruised but by
of 30 years, driven initially by demand from North America and 2014 this figure had grown to 6.4 million, representing an
more recently by growing demand from Europe and the rest of increase of 129%.
the world. Table 3. 1 sets out international cruise sector growth l ver the same period Europe as a source market for land-
O
between 2004 and 2014.
based tourism expanded by 38% to reach 584 million tourists.
l Over the ten years from 2004 to 2014 demand for cruising
worldwide has increased from 13.1 million passengers to The European Cruise Fleet
22.0 million (+68%) with 3.4% growth achieved in 2014. During 2014 there were 42 cruise lines8 domiciled in Europe
Over a similar period, global, mainly land-based tourism, which operated 123 cruise ships with a capacity of 146,271 lower
has risen by 49% to an estimated 1.14 billion tourists in 2014, berths. In addition there were 18 cruise lines domiciled outside
4.7% up on 2013. Europe participating in the European cruise market. These
l Although North American cruise passenger numbers have lines, predominately North American, deployed 60 vessels in
increased by 33%, the region’s relative share of the total the region with a capacity of 89,045 lower berths. This was a
market has declined from 69.9% in 2004 to 55.2% in 2014. decline of 15% from 2013 and more than offset the 1.1% increase
in capacity posted by the European lines.
Table 3.1: International Demand for Cruises 2004 to 2014
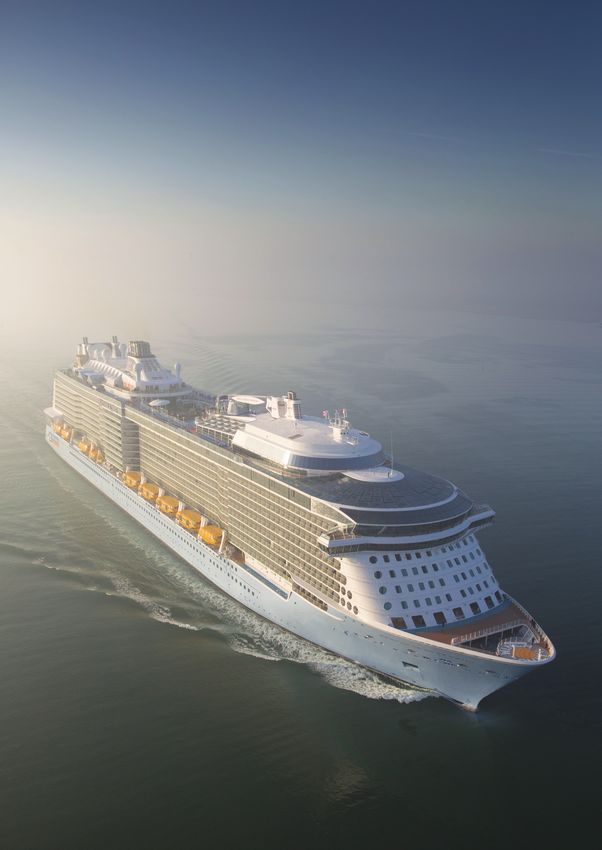
There were at least 152 cruise ships active in the Mediterranean
Region 2004 2009 2010 2011 2012 2013 2014 and 101 in Northern Europe during 20149, some of which
Million passengers repositioned from the Mediterranean for the shorter Northern
N. Am. 9.14 10.40 11.00 11.44 11.64 11.82 12.16 season. These ships ranged in size from the 5,400 passenger
Europe j 2.80 5.04 5.67 6.15 6.23 6.39 6.39 Oasis of the Seas, currently the largest in the fleet, to ships with
Sub-total 11.94 15.44 16.67 17.58 17.87 18.21 18.55
a capacity of less than 100 passengers.
RoW k 1.13 2.15 2.40 2.91 3.03 3.09 3.49 The Mediterranean
Total 13.07 17.59 19.07 20.49 20.90 21.30 22.04
l In 2014 a total of 152 cruise ships were active in
% NA 69.9 59.1 57.7 55.8 55.7 55.5 55.2
Mediterranean waters with a capacity of 205,656 lower
berths with an average of 1,353 berths per ship.
j Including Russia and Central and Eastern European countries outside the EU–7.
k Rest of the world: Largely estimated and adjusted from 2009 to take account l ollectively these ships carried a potential 3. 60 million
C
of dynamic growth in China and the southern hemisphere. passengers on 2,478 cruises, offering a total capacity of 28.71
Source: G. P. Wild (International) Limited from CLIA, IRN and other sources. million passenger-nights, giving an average cruise length of
7.98 nights. A further 421,000 potential passengers cruised
A European Growth Industry the Atlantic Isles.
The global share of the North American market has stabilised
l In 2014, North American operators deployed 49 ships with
at around 55% over recent years, as expansion in Europe has 74,321 lower berths in the Mediterranean, including some
slowed down compared with the earlier period. This can be ships targeted at European markets. In comparison, European
seen from the more detailed figures for European growth over domiciled lines operated 103 vessels, which offered 131,335
the 2012–2014 period, which are shown in Table 3. 2. lower berths.
l he market in the Mediterranean is expected to recover slightly
T
Table 3.2: Key European Cruise Market 2012–14
in 2015 as a result of increases in capacity both from European
2012 2013 2014 and more particularly American-domiciled operators.
Source Group Market Group Market Group Market %
Market Total Share Total Share Total Share Change Northern Europe
1,000s % 1,000s % 1,000s 2012/14 l In 2014 a total of 101 cruise ships were active in Northern
Pax Pax Pax
European waters with a capacity of 126,283 lower berths with
Germany 1,544 25.2 1,687 26.5 1,771 27.7 +15 an average of 1,250 berths per ship.
UK j 1,701 27.7 1,726 27.2 1,644 25.7 –3 l ollectively these carried a potential of 1.51 million
C
Italy 835 13.6 869 13.7 842 13.2 +1 passengers on 1,184 cruises, offering a total capacity of
France 481 7.8 522 8.2 593 9.3 +23 13.49 million passenger-nights, giving an average cruise
Spain 576 9.4 475 7.5 454 7.1 –21 length of 8.93 nights.
Other 1,002 16.3 1,078 17.0 1,083 17.0 +8 l he Northern European market declined by around 3% in 2014
T
Total 6,139 100 6,357 100 6,387 100 +4 but is expected to recover much of this lost ground in 2015.
j Including Ireland
l In 2014, North American mainstream operators deployed 30
Source: IRN
ships, with 48,355 lower berths in Northern Europe. European
mainstream operators deployed 59 vessels with 75,273 lower
Two ships operated by Israeli companies have been included in the
8 berths. The balance was largely made up of niche market
European-domiciled fleet. ships visiting the polar-regions.
The figures for the Mediterranean and North European fleets cannot be
9
l he Baltic Sea is the largest segment in the Northern Europe
T
compared with those given for the domiciled and non-domiciled fleets as
ships move between markets both within Europe and worldwide. Similarly the market, generating capacity of around 4.99 million passenger
Mediterranean and North European fleets are not directly comparable. The nights in 2014, increasing to just over 5.1 million in 2015.
Mediterranean total includes a few ships cruising to the Atlantic Isles only.
Contribution of Cruise Tourism to the Economies of Europe 2015 Edition 94. European Cruise Ports
The European cruise industry is to a large extent destination-led Major European Home Ports
and the Mediterranean and Northern European regions include
many attractive destinations. The principal home ports in the Mediterranean and Northern
Europe are shown in Table 4. 2 with passenger throughputs (or
l any of the leading ports are regarded as “must see” or
M revenue passengers), where available for 2012–14.
“marquee” destinations that destination planners will wish to
include in their itineraries. Table 4.2: Revenue Passengers – Major European Home Ports
2012–14
l ther ports, some of which are also marquee ports in their
O
own right, have advantages of strategic position, access to Home Port Country 2012 2013 2014
major hub airports and suitable bed-stock, enabling them to Mediterranean
feature prominently as home ports. Civitavecchia Italy 2,394,423 2,538,259 2,140,039
Table 4. 1 summarises the position in 2014 for the Venice Italy 1,739,501 1,815,823 1,733,839
leading European ports10 in respect of the embarkations, Palma Majorca Spain 984,785 1,245,244 1,336,437
disembarkations and port-of-call visits at each port. Some data Piraeus (Athens) Greece 1,198,047 1,302,581 1,055,556
has been estimated, indicated by italics.
Savona Italy 810,097 939,038 1,018,794
Table 4.1: Leading Cruise Ports in 2014 – Thousands of Genoa Italy 797,239 1,051,015 824,109
Passengers Barcelona Spain 2,408,960 2,599,232 2,364.292
Port Revenue Passengers, 2014 Northern Europe
Embarking Disembarking Port Call Total Southampton UK 1,577,790 1,683,160 1,573,428
Mediterranean Top ten Copenhagen Denmark 840,000 800,500 740,000
Barcelona 615 607 1,142 2,364 Hamburg Germany 430,329 552,359 588,690
Civitavecchia 366 365 1,409 2,140 Kiel Germany 348,180 363,476 354,000
Venice 755 754 225 1,734 Amsterdam Netherlands 289,757 276,912 253,092
Palma Majorca 303 303 730 1,336
Marseille 253 253 805 1,311 Note: Where a port also handles port-of-call passengers, these are also included
in the totals shown in the above table.
Naples 50 50 1,014 1,114
Source: MedCruise, Cruise Europe and individual port data.
Piraeus 128 128 799 1,055
Savona 334 334 350 1,019
Genoa 286 286 253 824
Dubrovnik 7 8 791 807
Northern Europe Top ten
Southampton 768 768 38 1,573
Copenhagen 244 244 252 750
Hamburg 281 278 29 589
St Petersburg 0 0 514 514
Lisbon 21 21 459 501
Bergen 2 2 439 483
Tallinn 8 7 464 479
Stockholm 28 28 412 467
Helsinki 3 2 415 420
Cadiz 1 1 379 381
Estimates in italics.
Source: MedCruise, Cruise Europe and individual port data
10
In this and the subsequent port tables non-European Mediterranean ports
are included.
10 Contribution of Cruise Tourism to the Economies of Europe 2015 Edition4. European Cruise Ports
Key European Ports-of-Call
The principal home ports in the Mediterranean and Northern
Europe are shown in Table 4. 2 with passenger throughputs (or
revenue passengers), where available for 2012–14.
Table 4.3: Major European Ports-of-Call 2012–14
Port-of-Call Country 2012 2013 2014
Mediterranean
Marseille France 890,124 1,188,031 1,311,284
Naples Italy 1,228,651 1,175,018 1,113,762
Dubrovnik Croatia 743,000 943,000 807,000
Santorini Greece 838,899 750,000 679,000
Corfu Greece 655,764 744,651 672,368
Livorno Italy 1,037,849 736,516 626,356
Mykonos Greece 657,511 520,000 610,207
Côte d’Azur j France 702,080 613,218 595,685
Istanbul Turkey 564,555 683,598 589,353
Bari Italy 618,882 604,781 561,602
Kusadasi Turkey 560,000 580,000 553,231
Palermo Italy 354,399 410,999 531,712
Valletta Malta 611,757 477,759 517,594
La Spezia Italy 50,239 213,858 483,563
Tunis Tunisia 582,601 511,065 440,433
Malaga Spain 651,517 397,064 409,298
Northern Europe
St Petersburg Russia 452,000 523,525 513,885
Rostock k Germany 300,000 483,000 509,000
Lisbon Portugal 522,604 558,040 500,872
Tallinn Estonia 440,504 519,319 479,031
Stockholm Sweden 467,000 485,582 467,000
Bergen Norway 446,906 453,015 442,759
Helsinki Finland 368,000 420,000 420,000
Cadiz Spain 334,266 373,114 381,302
Geiranger Norway 312,136 314,867 301,174
Stavanger Norway 277,000 343,500 262,500
Havre, Le France 212,825 247,638 256,904
Oslo Norway 303,386 298,403 235,000
Zeebrugge Belgium 170,000 255,700 220,000
Flam Norway 199,875 248,945 203,874
j Mainly Nice, Villefranche and Cannes.
k Includes Warnemunde.
Notes:
1. Where a port also handles some home porting passengers, these are also
included in the totals shown in the above table.
2. Three of the five leading ports of call in Northern Europe are in the Baltic Sea.
Source: MedCruise, Cruise Europe and individual port data.
Contribution of Cruise Tourism to the Economies of Europe 2015 Edition 115. Cruise Passengers – Where do they come from and where do they go?
Source Markets Passenger Embarkations
There were an estimated 22.04 million global cruise passengers An estimated 5.85 million cruise passengers embarked on their
in 2014. The countries of Europe accounted for 29% of them in cruises from European ports in 2014.
terms of a source market. l Italian ports, led by Venice, Civitavecchia, Savona and Genoa,
Figure 5.1: Global Source Markets by Cruise Passengers were European market leaders with 1.95 million passenger
embarkations in 2014.
22.04 Million Passengers l pain was in second position with 1.26 million passenger
S
Asia/Pacific embarkations during 2014. Barcelona and Palma were Spain’s
2.40 Rest of the World major embarkation ports.
1.09
l he United Kingdom was third behind Spain with just over
T
Germany 942,000 embarkations. The principal embarkation ports for
1.77 UK passengers were Southampton, Harwich and Dover.
UK/Ireland
l he next three most important cruise embarkation countries
T
Europe
6.39
1.64
Italy were Germany, France and Denmark. Ports in Germany
North America 0.84 generated 600,000 passenger embarkations, followed by
12.16 France France with 306,600 and Denmark with 244,000. The major
0.59 embarkation ports in these countries were: Hamburg, Kiel and
Spain Rostock/Warnemunde in Germany, Marseille in France and
0.45
Copenhagen in Denmark.
Other Europe
1.10
Table 5.2: Cruise Passengers by Country of Embarkation, 2014
Note: UK includes Irish Republic; USA includes Puerto Rico; Asia/Pacific Country Passengers Share of Total
includes all of Asia (except the Middle East) and Australia, New Zealand
and the South Pacific. Italy 1,957,300 33.4%
Spain 1,258,100 21.5%
During 2014 an estimated 6.39 million residents of the UK 942,000 16.1%
countries of Europe [NB IRN figs include Russia and other non- Germany 584,800 10.3%
EU/EEA] cruised. The top five source markets – Germany, UK,
France 306,600 5.2%
Italy, France and Spain – accounted for 83% of the market.
Denmark 244,000 4.2%
Table 5.1: European Cruise Passengers by Source Greece 176,600 3.0%
Country, 2014 Netherlands 86,700 1.5%
Country Passengers Share of Total Sweden 48,000 0.8%
Germany 1,771,000 27.7% Malta 46,800 0.8%
UK/ Ireland j 1,644,000 25.7% Cyprus 38,500 0.7%
Italy 842,000 13.2% Portugal 23,900 0.4%
France 593,000 9.3% Croatia 18,000 0.3%
Spain 454,000 7.1% Other EU + 3 25,600 0.4%
Norway 176,300 2.8% EU+3 5,772,200 98.6%
Switzerland 143,000 2.2% Other Europe j 81,000 1.4%
Austria 122,000 1.9% Total 5,853,200 100.0%
Netherlands 109,000 1.7% j Russia, Georgia and Ukraine
Sweden 78 800 1.2% Source: G. P. Wild (International) Limited.
Belgium 73,000 1.1%
Denmark 37,700 0.6% Port-of-Call Visits
Finland 12,200 0.2%
The vast majority of cruise port calls in Europe are at the
Other Europe 331,000 5.3%
Mediterranean and Baltic Sea ports. Including the Black Sea
Total 6,387,000 100.0% and Atlantic Isles the region as a whole includes around 250
j Of which Ireland, est. 35,000. ports visited by cruise ships. The top ten destination countries
Source: IRN for CLIA Europe. accounted for 84% of cruise passenger visits in 2014. The top
three are in the Mediterranean11 and accounted for 52% of all
European passenger visits.
l he European market has grown by 128% over the last ten
T
years but with economic growth moderating over the past
five years, European-sourced passengers have only increased
by about 4% over the past three years. Fifty-six percent of
Europeans cruised in the Mediterranean and Atlantic Isles in
2014, 22% in Northern Europe and the remaining 22% cruised
outside Europe, primarily in the Caribbean. 11
The majority of calls in Spain are at ports on their Mediterranean coast.
12 Contribution of Cruise Tourism to the Economies of Europe 2015 Edition5. Cruise Passengers – Where do they come from and where do they go?
l ed by Civitavecchia, Naples, and Livorno, Italian ports also
L
hosted 6.17 million passenger visits in 2014 making Italy the
largest cruise destination in Europe.
l ith the inclusion of the Canary Islands, Spanish ports
W
received nearly 5.0 million cruise passenger visits in 2014.
Spain’s ranking rose from third in 2009 to second in 2010
and has remained second since then.
l reece has maintained its ranking as the third most popular
G
destination in Europe with 4.1 million passenger visits in 2014.
Piraeus, Santorini, Mykonos, Corfu and Katakolon were the
leading destination ports.
l orway’s rank rose from fifth in 2011 to fourth in 2013 and has
N
remained as the fourth highest destination market throughout
Europe and the leading destination in Northern Europe with
2.6 million passenger visits, led by Bergen, Geirangerfjord,
Oslo and Stavanger.
l J ust over 2.4 million cruise passengers arrived at French
ports in 2014 and placed France as the fifth highest cruise
destination in Europe. The principal destination ports in
France are; Marseille, the Cote d’Azur ports, Corsican ports
and Le Havre.
Table 5.3: Cruise Passengers by Country of Destination, 2014
Country Passengers Share of Total
Italy 6,174,100 21.3%
Spain 4,890,700 16.9%
Greece 4,075,700 14.1%
Norway 2,618,900 9.0%
France 2,439,300 8.4%
Croatia 1,118,900 3.9%
Portugal 1,105,800 3.8%
United Kingdom 922,000 3.2%
Sweden 562,100 1.9%
Estonia 471,700 1.6%
Benelux 461,300 1.6%
Malta 426,000 1.5%
Finland 416,000 1.4%
Denmark 359,800 1.2%
Germany 358,100 1.2%
Gibraltar 299,900 1.0%
Iceland 234,500 0.8%
Ireland 179,500 0.6%
Slovenia 118,900 0.5%
Cyprus 106,600 0.5%
Poland 105,200 0.4%
Other EU j + 3 209,300 0.7%
EU+3 27,654,300 95.5%
Other Europe k 1,312,500 4.5%
Total 28,966,800 100.0%
j Latvia, Lithuania, Romania and Bulgaria.
k Including following in thousands: Russia, 538; Montenegro, 309; Monaco, 167;
Turkey (Europe only), 441 (estimates in italics).
Contribution of Cruise Tourism to the Economies of Europe 2015 Edition 136. Shipbuilding in Europe
Although conventional merchant shipbuilding has been in Table 6. 1: Ocean-going Cruise Vessels – Scheduled
decline in Europe since the late 70’s in the face of lower-cost Newbuildings, 2015–2018
competition from the Far East, the European industry has
Cost Share
been more successful in retaining market share in a number of Country of Build No. GT Pax (LB)
€M of Cost
specialist sectors.
Italy 15 1,347,800 33,420 6,508 40.8%
l he most important of these is cruise ship construction in
T Germany 7 1,126,200 27,688 5,142 32.2%
which the European industry has been the world leader for France 4 734,564 18,200 3,112 19.5%
nearly 50 years.
Finland 3 293,500 7,500 1,195 7.5%
l ll but two of the oceanic cruise ships currently under
A Total 29 3,502,064 86,808 15,957 100.0%
construction through the end of 2018 are being built in
European yards. Note: GT (Gross Tonnage), LB (Lower Berths), Pax (Passengers).
Total excludes non-European build (Japan).
l he yards in Italy, Germany, France, and Finland are the most
T
Source: G. P. Wild (International) Limited.
important suppliers to the market and currently account for all
new ships due for delivery within Europe from 2015 to 2018.
l ermany and Italy are the current leaders with 70% of the
G The current allocation of the 2015–8 order book by European
order book between them. country of build is shown in Table 6.1.
l J apan currently has orders for two ships but its market
participation in the past has been sporadic, previous ships
having been delivered in 1989–90, 1998 and 2004.
l lthough other non-European yards have the capacity and
A
technology to build cruise ships, they may not have project
management capability, aptitude or the desired balance of
labour and skills required to deliver a cost effective result
within a required budget in the contracted delivery time.
However, Far Eastern yards have been studying the market
diligently and two prospective orders have been reported for
yards in China.
l he majority of cruise ships serving the European market
T
are dry-docked in Europe, together with a number of North
American ships summering in the region.
l uropean yards also undertake major conversions such as
E
replacement of main engines and insertion of a mid-body to
lengthen the ship.
l he outstanding reputation of European yards has meant
T
that US cruise lines have continued to order ships in Europe
despite the fluctuations of the US dollar against the euro.
l urope offers an abundance of specialist skills and
E
sophisticated technology in areas such as navigation and
outfitting, which support European cruise ship construction
and assist the yards in maintaining a competitive edge over
their rivals in other parts of the world.
14 Contribution of Cruise Tourism to the Economies of Europe 2015 Edition7. Direct Cruise Industry Expenditures in Europe: A Broadly Based Flow of Spending
Major Segments Cruise Line Purchases
Cruise tourism generated an estimated €16.6 billion in direct Cruise lines spent an additional €7.0 billion with European
expenditures throughout Europe in 2014, a 2.8% increase from businesses in support of their cruise operations. This was 42%
2013. As indicated in the following figure, these expenditures of the total and a 0.8% increase over 2013. These purchases
were broadly distributed across the four major source segments. included a broad range of products and services and touched
virtually every industry in Europe.
Figure 7. 1: Direct Cruise Industry Expenditures in Europe, 2014
Among the major industries that benefited from the impact of
Passenger & direct cruise line spending were the following.
Crew Purchases l ood and beverage manufacturers produced €670 million
F
Cruise Line €3.64 in provisions consumed on-board cruise ships by passengers
Purchases 22%
€6.97
and crew, virtually unchanged (+0.6%) from 2013. This slight
42% growth was the net result of a decline in passengers which
was offset by an increase in prices.
l riven by falling capacity and fuel costs, the petrochemical
D
industry received an estimated €982 million from cruise lines
in 2014, a 4.8% drop from 2013. Petrochemical products
Cruise Value of include bunker fuels, lubricants, paint and cleaning supplies.
Employees Shipbuilding l nother €965 million was spent for the manufacture of
A
Compensation €4.55
27% metals and machinery, including material handling equipment,
€1.48
engines, lighting equipment, communication equipment and
9%
computers. This represented a 12% increase over 2013.
l pending for transportation and utilities totalled €1.6 billion
S
Shipbuilding and included spending for public utilities, travel agent
The global cruise industry spent €4.55 billion, 27% of commissions, port charges and ground transportation. This
total cruise industry expenditures in Europe during 2014. was unchanged from 2013.
Expenditures for new construction and maintenance increased l he cruise industry also spent an estimated €1.38 billion
T
by 12.8% from 2013 after increasing by 4.7% in 2013 and 0.3% on financial and business services including: advertising,
in 2012. Prior to 2012, shipbuilding expenditures had declined engineering and other professional services, computer
for three consecutive years. programming and support services and direct mail and market
l ince the cruise ship order book peaked in 2007, new orders
S research. This was an increase of 3.7% from 2013.
fell in each of the next three years. As a consequence, the
Table 7.2: Direct Cruise Lines Purchases by Industry (Millions),
growth in shipbuilding expenditures declined in 2008 and 2014 (Excluding Shipbuilding)
actual expenditures fell during the 2009–11 period. Despite
the increase in the total order book during 2014 the contracts Industry Purchases Share of Total
placed in Japan and potentially in China represent a threat to Ag. Min., & Const. €19 0.3%
Europe’s continued pre-eminence in cruise shipbuilding. Food & Beverage €670 9.6%
Table 7.1: Cruise Industry Expenditures for Newbuildings and Textiles & Apparel € 190 2.7%
Refurbishment (Millions), 2014 Paper & Printing €180 2.6%
Petroleum & Chemicals €982 14.1%
Country Newbuildings Refurbishment Total
Stone & Glass €28 0.4%
Germany €1,204 €447 €1,651
Metals €218 3.1%
Italy €1,201 €127 €1,328
Machinery €747 10.7%
France €370 €72 €442
Other Manufacturing €396 5.7%
Finland €407 €53 €460
Wholesale Trade €168 2.4%
Other EU+3 €464 €207 € 671
Transportation &Utilities €1,601 23.0%
Total €3,646 €906 €4,552
Financial & Bus. Services €1,384 19.9%
Personal Serv. & Gov’t €387 5.5%
l ighty percent (80%) of these expenditures relate to the
E
work-in-progress for the construction of new cruise ships, Total €6,970 100.0%
with the remaining 20% covering conversion, refitting, Note: In this and subsequent tables in the economic impact sections, the totals
refurbishment and maintenance of cruise ships. may differ from the sum of the components due to rounding.
l mong the four major shipbuilding countries in Europe,
A
expenditures for new construction increased in Germany
and Italy during 2014, by 7.8% and 47% respectively.
Expenditures remained virtually unchanged in France and
rose by 12% in Finland.
Contribution of Cruise Tourism to the Economies of Europe 2015 Edition 157. Direct Cruise Industry Expenditures in Europe: A Broadly Based Flow of Spending
Cruise Passengers and Crew Direct Expenditures by Country
Passengers and crew spent €3.64 billion at ports-of- As indicated in Table 7. 4, businesses throughout Europe were
embarkation and ports-of-call in 2014, accounting for 22% directly impacted by the cruise industry.
of total cruise industry expenditures. This was a 4.2% decline l he three countries of Italy, Germany and the UK accounted
T
from 2013.
for 66% of the direct expenditures of the cruise industry. These
l he 5.85 million cruise tourists that embarked on cruises
T three countries experienced a combined increase of 2.4% in
from European ports spent an estimated €1.71 billion on direct expenditures from 2013. These countries participated in
airfares, port fees, accommodation, excursions, food and all segments of the industry:
beverages amongst others at the embarkation ports, 2.8% l erving as major source and destination markets for cruise
S
less than in 2013.
passengers,
l uropean airfares accounted for approximately 70% of these
E l Maintaining headquarters facilities and providing crew,
expenditures by embarking passengers.
l Providing shipbuilding and/ or repair services, and
l he 29 million passenger visits at European ports-of-call
T
generated an additional €1.8 billion in expenditures for l Provisioning and fuelling of cruise ships.
tours, food and beverage, merchandise and other similar
expenditures. This is a decrease of 5.8% from 2013. Table 7.4: Direct Cruise Industry Expenditures by Country,
2014 – Millions
l n estimated 14.4 million crew members arrived at port
A
cities during cruise calls. Of these an estimated 5.7 million Country Direct Spending Share of Total
disembarked and made purchases totalling an estimated Italy €4,601 27.6%
€133 million, or €23.30 per crew visit. Germany €3,254 19.5%
UK €3,155 19.0%
Compensation of Cruise Line Employees
Spain €1,208 7.3%
European cruise lines spent €1.48 billion on compensation for France €1,117 6.7%
employees who resided in Europe during 2014, a 2.2% rise from
Norway €591 3.6%
2013. These expenditures accounted for 9% of total cruise
industry direct expenditures. The cruise lines employed an Finland €582 3.5%
estimated 64,900 residents of Europe in their administrative Greece €506 3.0%
offices and as crew on board their ships. Netherlands €399 2.4%
Sweden €228 1.4%
Table 7.3: Cruise Line Compensation Shares by Country, 2014
– Country of Residence of Employees Top 10 €15,641 94.0%
Denmark € 221 1.3%
Industry Purchases
Portugal €193 1.2%
United Kingdom 39.2%
Croatia €102 0.6%
Italy 34.0%
Malta €86 0.5%
Germany 7.6%
Gibraltar €66 0.4%
Norway 6.6%
Rest of the EU+3 €328 2.0%
Spain 2.4%
Total €16,637 100.0%
France 2.3%
Portugal 2.0%
The top five countries experienced a 2.1% increase in direct
Ireland 1.0%
cruise industry expenditures from 2013.
Netherlands 0.8%
l ermany led the way with a 6.3% increase in direct
G
Romania 0.6%
expenditures and accounted for nearly 60% of the net
Austria 0.6% increase in expenditures among the top 5 countries. Spending
Bulgaria 0.5% increased in each of the four expenditure categories in
Rest of EU+3 2.4% Germany. Shipbuilding took the lead with an 8.0% increase
followed by cruise lines and passenger and crew expenditures,
each with a nearly 5.0% increase. Compensation of cruise line
employees residing in Germany increased by 2.6%.
l he UK and Italy experienced smaller gains in direct cruise
T
sector expenditures with respective gains of 1.0% and 0.7%.
The growth in the UK was led by a 2.0% increase in spending
by cruise lines, including the compensation of their employees
residing in the UK. This gain was partially offset by a 3.5%
decline in the combined spending of passengers and crew and
ship repair expenditures.
16 Contribution of Cruise Tourism to the Economies of Europe 2015 EditionYou can also read