The Europe 2020 Regional Index - JRC Publications Repository
←
→
Page content transcription
If your browser does not render page correctly, please read the page content below

The Europe 2020 Regional Index

                      Stergios Athanasoglou

                      Lewis Dijkstra

                      2014

                                       Report EUR 26713 EN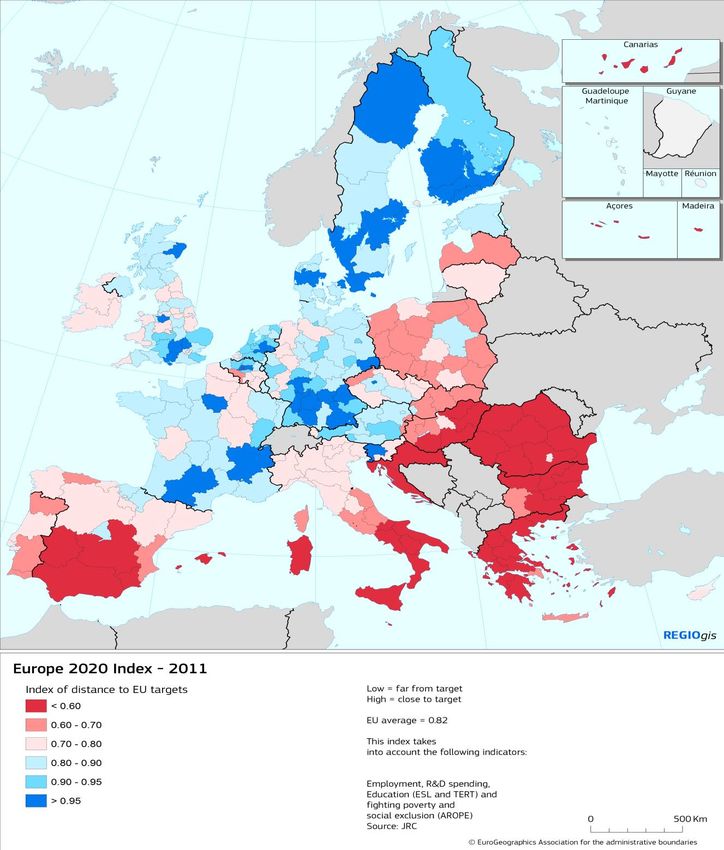
European Commission
Joint Research Centre
Deputy Director General, Unit 01 – Econometrics and Applied Statistics

Contact information
Stergios Athanasoglou, Lewis Dijkstra

Address: Joint Research Centre, Via Enrico Fermi 2749, TP 361, 21027 Ispra (VA), Italy
E-mail: stergios.athanasoglou@jrc.ec.europa.eu
Tel.: +(39) 0332 786590
Fax: +(39) 0332 785733
http://www.jrc.ec.europa.eu/

Address: DG for Regional Policy
E-mail: lewis.dijkstra@ec.europa.eu
Tel.: +(32) 2 2962923
Fax: +(32) 2 2953990
http://ec.europa.eu/regional_policy/index_en.cfm

Composite Indicators website : http://composite-indicators.jrc.ec.europa.eu

This publication is a Science and Policy Report by the Joint Research Centre of the European Commission.

Legal Notice
This publication is a Science and Policy Report by the Joint Research Centre, the European Commission’s in-house
science service. It aims to provide evidence-based scientific support to the European policy-making process. The
scientific output expressed does not imply a policy position of the European Commission. Neither the European
Commission nor any person acting on behalf of the Commission is responsible for the use which might be made of this
publication.

JRC90238

EUR 26713 EN

ISBN 978-92-79-38977-1 (pdf)
ISBN 978-92-79-38978-8 (print)

ISSN 1831-9424 (online)
ISSN 1018-5593 (print)

doi:10.2788/87940
Luxembourg: Publications Office of the European Union, 2014

© European Union, 2014

Reproduction is authorised provided the source is acknowledged.

Printed in Italy
Contents

Executive Summary ......................................................................................................................... 4
Introduction ................................................................................................................................... 11
The Europe 2020 Strategy ............................................................................................................. 14
Related work ................................................................................................................................. 17
   DG REGIO Regional Lisbon Index ............................................................................................... 18
   DG REGIO Regional Competitiveness Index .............................................................................. 18
Theoretical Framework of the Europe 2020 Regional Index ......................................................... 19
Data ............................................................................................................................................... 20
Data and Target Imputation .......................................................................................................... 22
The Europe 2020 Regional Index ................................................................................................... 23
   Correlation Structure................................................................................................................. 24
   Europe 2020 Regional Index Results and Discussion ................................................................ 25
Uncertainty and Sensitivity Analysis ............................................................................................. 29
Conclusions.................................................................................................................................... 39
Appendix........................................................................................................................................ 40
A1: The Europe 2020 Regional Index with Common Targets ........................................................ 40
A2: Europe 2020 component maps ............................................................................................... 43
References ..................................................................................................................................... 45

                                                                                                         Europe 2020 Regional Index | 3
Executive Summary

In this report we develop a composite index to measure regional progress towards
meeting key objectives set forth by Europe 20201, the European Commission’s ten year
growth strategy launched in March 2010. The work presented is part of a broader
Administrative Arrangement between DG REGIO and DG JRC, Ν 2013. CE.26.BA T.
069, whose aim was to develop a set of regional composite indicators covering
dimensions of well-being and development. Its results are planned to be included in DG
REGIO’s Sixth Cohesion Report, scheduled for publication in June 2014.

Europe 2020 consists of a set of goals involving employment, education, poverty,
research and development (R&D), and environmental sustainability. These goals were
quantified via European-wide numerical targets on a group of relevant economic, social,
and environmental indicators. To accommodate the heterogeneity of EU-28 countries, the
European-wide objectives were transformed into a set of more realistic national targets
for individual countries. This was done for a majority of country-indicator pairs (by the
member countries themselves).

To obtain a spatially refined appreciation of Europe 2020’s current status and the future
challenges underlying its successful implementation, the composite indicator we develop
is disaggregated to the regional NUTS 2 level. This posed a number of challenges
regarding data availability, primarily with regard to the environmental sustainability and
poverty objectives. Sometimes these challenges could be addressed, and sometimes not.
In particular, as there is no regional data whatsoever for the environmental sustainability
indicators, we decided to drop them from the composite index. Meanwhile, we were able
to keep poverty and social exclusion indicators in the index by employing sensible
imputation techniques where necessary.

We propose a straightforward methodology for the calculation of the Regional Europe

1
    http://eur-lex.europa.eu/LexUriServ/LexUriServ.do?uri=COM:2010:2020:FIN:EN:PDF

                                                                     Europe 2020 Regional Index | 4
2020 Index, that can be easily applied and understood. The approach we adopt is similar
to the one used in the computation of the Lisbon Index (Dijkstra, 2010). A region’s
progress towards meeting an individual goal is measured via the (appropriately
normalized) shortfall of its actual performance with respect to its national Europe 2020
target. Subsequently, its Europe 2020 Index score is calculated by considering a weighted
arithmetic average of these percentage shortfalls over the set of all indicators. The
weighting scheme we employ assigns equal weight to the objectives of employment,
research and development, education, and poverty and social exclusion.

        Top-10                                     Bottom-10
        Vlaams-Brabant - BE24*                     Ciudad Autónoma de Ceuta - ES63
        Praha - CZ01*                              Ciudad Autónoma de Melilla - ES64
        Oberbayern - DE21                          Canarias - ES70
        Bratislavský kraj - SK01                   Sicilia - ITG1
        Helsinki-Uusimaa - FI1B                    Andalucía - ES61
        Trento - ITH2                              Extremadura - ES43
        Vastverige – SE23                          Región de Murcia - ES62
        Emilia-Romagna - ITH5                      Campania - ITF3
        Stockholm - SE11                           Castilla-La Mancha - ES42
        Dresden – DED2                             Região Autónoma dos Açores –PT20
             Top and Bottom-10 performing regions in Europe 2020 Regional Index
             (listed in descending and ascending order, respectively). An asterisk
             denotes regions that meet or exceed all their targets.

Four capital regions (Prague CZ01, Bratislava SK01, Stockholm SE11, Helsinki FI1B)
are among the top-10 Europe 2020 performers. Other top performers include the Belgian
region of Vlaams-Brabant (BE24), the Italian regions of Trento (ITH2) and Emilia-
Romagna (ITH5), the Swedish region of Vastverige (SE23) and the German regions of
Oberbayern (DE21) and Dresden (DED2). At the other extreme, Spain’s performance is
particularly disappointing as it is responsible for seven of the bottom-10 regions. Four of
these regions are found in the southern and south-central parts of the country (Andalucia
ES61, Murcia ES62, Extremadura ES43, Castilla-la-Mancha ES42) while the other three

                                                                     Europe 2020 Regional Index | 5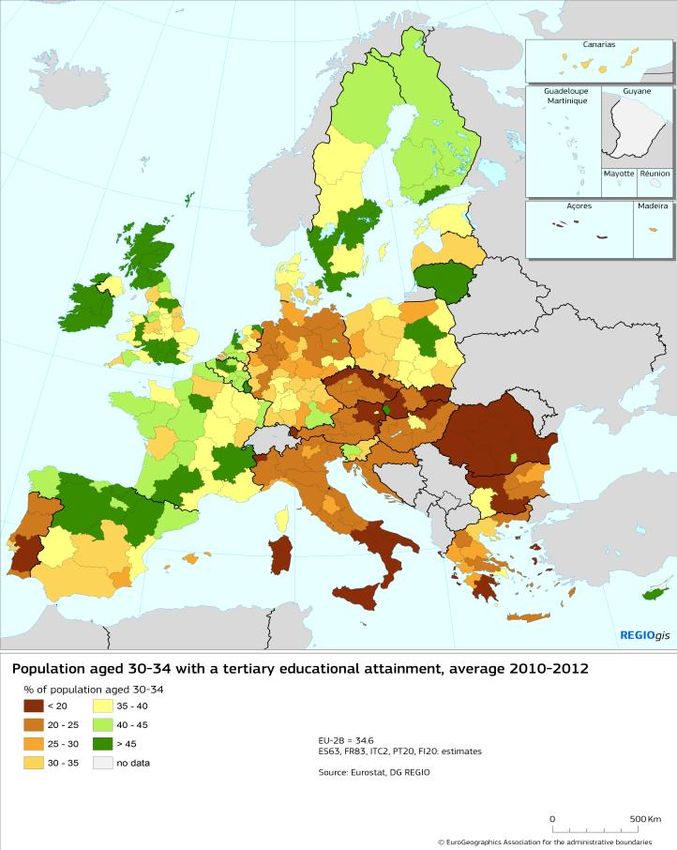
include the Canary Islands (ES70) and two small autonomous territories in Africa (Ceuta
ES63 and Melilla ES64). Finally, Italy’s southern regions of Sicily (ITG1) and
Campania (ITF3), and the Portuguese autonomous region of the Acores islands (PT20)
round out the bottom 10.
The Spanish regions of Ceuta (ES63), Melilla (ES64), Canarias (ES70), Andalucia
(ES61), Extremadura (ES43), Castilla-la-Mancha (ES42), and Murcia (ES62) are among
the bottom-10 performers in most of the Europe 2020 objectives regarding employment,
research and development, education, and poverty and social exclusion. In addition, the
Italian regions of Sicily (ITG1) and Campania (ITF3) are among the worst-10 performing
regions in terms of their Europe 2020 targets on employment and poverty and social
exclusion.
An important caveat to the above concerns the population sizes of NUTS 2 regions. In
particular, some NUTS 2 regions have very large populations (e.g., Sicily ~5 million),
while others very small populations (e.g., Ceuta ~82,000). Therefore, the scores of the
former should be considered more reliable than those of the latter.
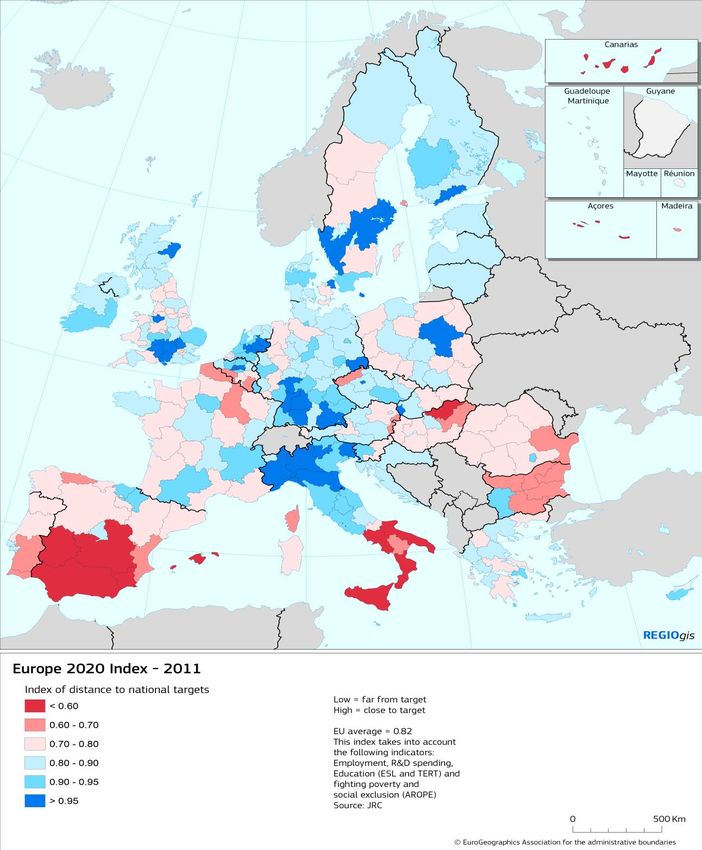
The following map presents the Europe 2020 Regional Index scores. While we should be
mindful not to overstate the reach of this analysis, a few general patterns are worth
noting. First, we see that southern and central European countries such as Spain,
Bulgaria, Greece, Portugal, Romania, and Hungary fall behind Scandinavian and other
northern European countries, notwithstanding the latters’ more ambitious targets. Second,
our analysis makes plain the significant inter-regional heterogeneity of Europe 2020
performance for many countries. The country presenting the greatest such variability is
Italy, with a particularly acute North-South divide, and to a lesser, though still very
substantial, degree Spain. Meanwhile, it is clear that regions in Spain, Greece, Bulgaria,
Poland, and Hungary are consistently problematic in meeting their Europe 2020
objectives.
Europe 2020 Regional Index | 6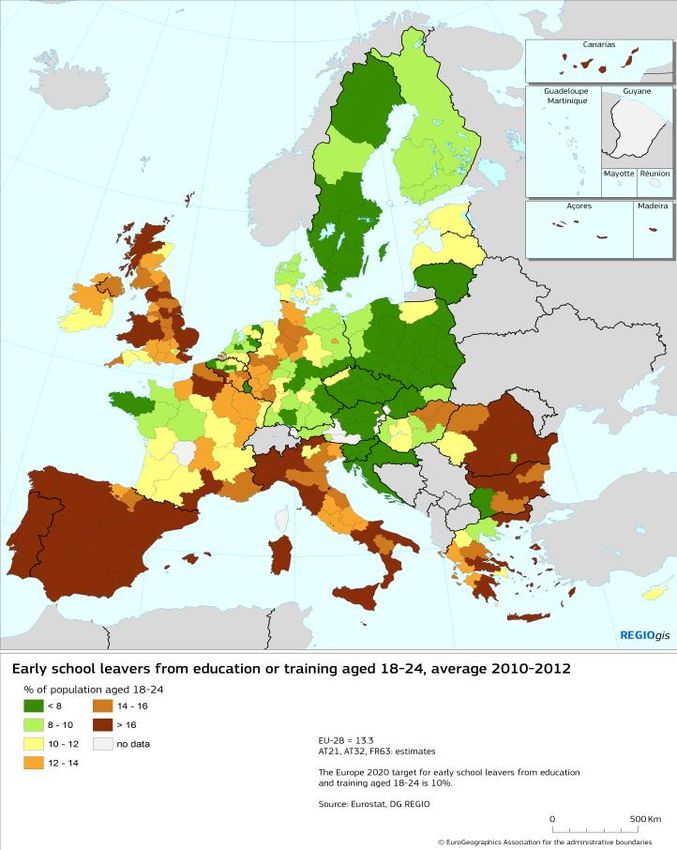
Europe 2020 Regional Index (scores range from 0.32 to 1)

                                            Europe 2020 Regional Index | 7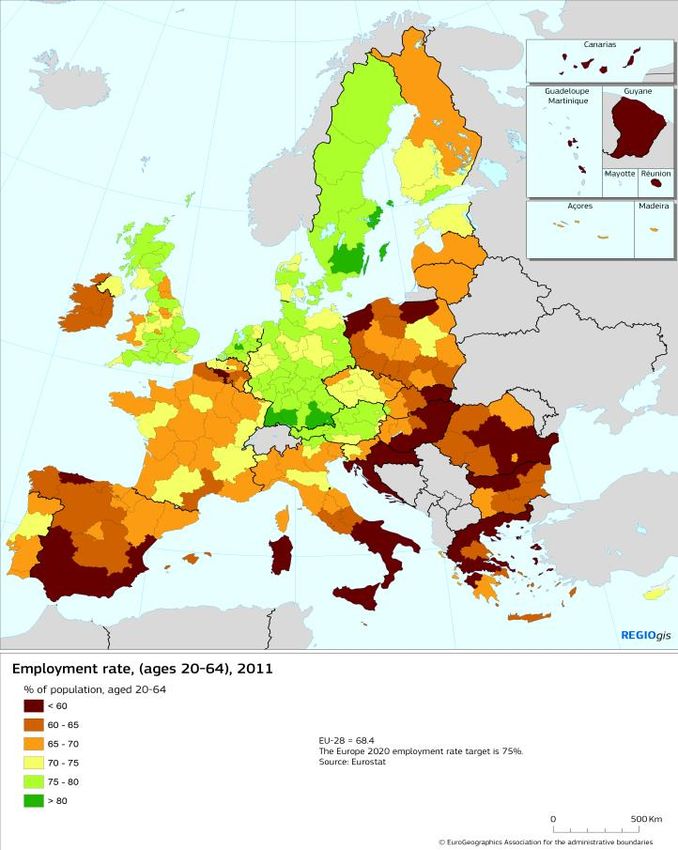
Europe 2020 Regional Index Scores – reference year 2011

Urbanization patterns are an important factor of Europe 2020 performance. The above
figure shows that capital regions almost always both (a) outperform the EU-28 aggregate
score and (b) are among the top performers within countries (indeed, they often have the
highest score). A remarkable exception to this trend is the region of Brussels (BE10).
Brussels’ very low score is primarily due to weak performance with regard to
employment and poverty objectives. With a European-wide rank of 256 (out of 268), its
performance stands in stark contrast to the rest of Belgium. Furthermore, it should be
noted that the primary driver of this negative result is not Belgium’s ambitious national
targets: Brussels’ rank goes up to a mere 216 if we recalculate the index with the
European-wide Europe 2020 targets.

In a number of countries there is a sizable gap between the performance of the capital and
next-best region (Slovakia, Romania, Poland, Portugal, Hungary, and Finland). We
further observe the large regional heterogeneity in index scores for countries such as
Italy, Spain, Belgium, the Czech Republic, Poland, and Slovakia, among others. This
point reinforces the importance of disaggregating the index to the regional level.

                                                                Europe 2020 Regional Index | 8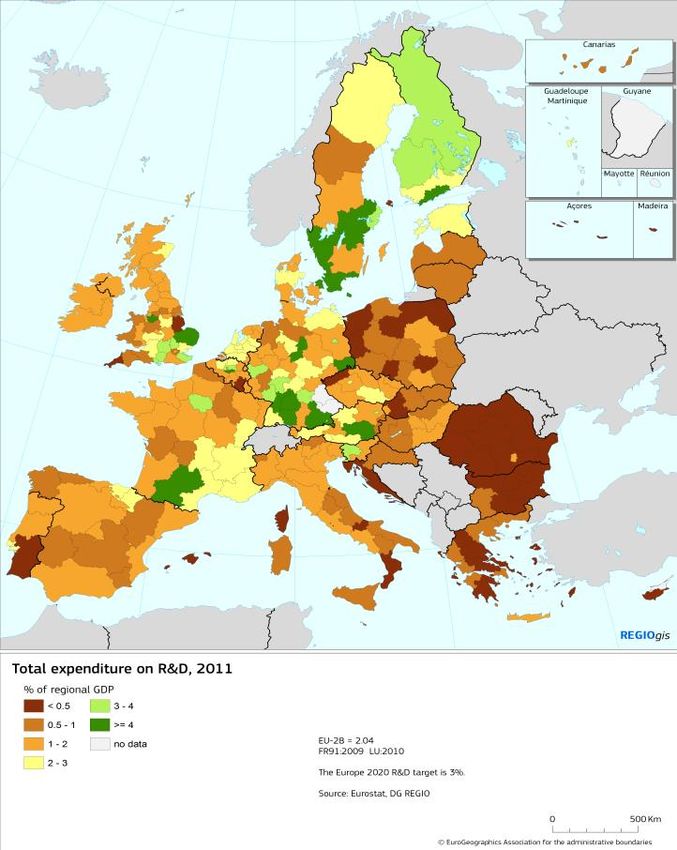
The Europe 2020 Regional Index was computed on the basis of the individual country
targets. As a general rule, the targets of richer countries are more ambitious than those of
poorer ones, in a way that is broadly consistent with the EU-28 wide targets. It is
legitimate to ask how index scores would change should the EU-28 targets have been
adopted uniformly across all European countries. The map below graphically depicts the
recalculated index.

    Europe 2020 Regional Index with EU-28 targets (scores range from 0.24 to 1)

                                                                Europe 2020 Regional Index | 9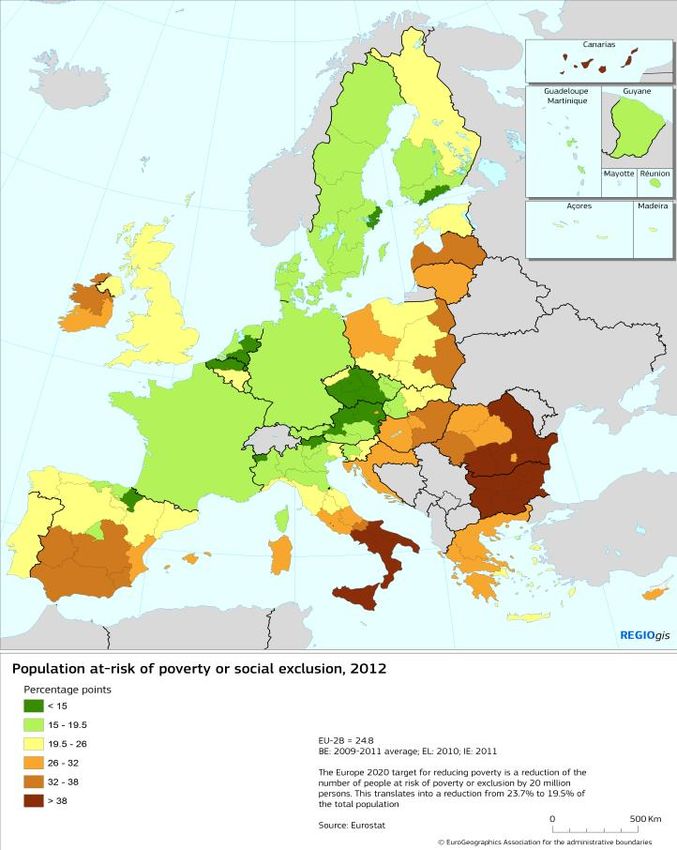
The picture that emerges is not all that surprising: poorer countries with less ambitious
targets do worse (often significantly so) under the EU-28 targets. The effect on relatively
richer countries is muted, as they do either mildly worse or mildly better under common
targets. A somewhat unexpected result of this exercise is the fact that Italy does
significantly worse under common EU-28 targets. This suggests that Italy’s chosen
national targets may in fact be too lenient.

Europe 2020 index scores with EU-28 targets minus Europe 2020 index scores with
national targets – reference year 2011

Index scores and rankings are naturally sensitive to subjective modelling choices such as
the choice of weights and aggregation scheme. For this reason, we investigated the
robustness of index ranks via a rigorous uncertainty and sensitivity analysis. While the
ranks of a handful of regions were quite sensitive to changes in weights and aggregation
(primarily due to low performance along a single Europe 2020 dimension), index ranks as
a whole were quite robust.

It is our hope that European policy makers will find the Regional Europe 2020 Index
useful in gauging current regional performance with respect to Europe 2020 objectives,
and designing the next steps of Europe 2020’s successful implementation.

                                                              Europe 2020 Regional Index | 10
Introduction
In this work we develop a composite indicator to measure regional progress in meeting
the set of objectives set forth by Europe 2020, the European Commission’s ten year
growth strategy2 launched in March 2010.
Europe 2020 consists of a variety of different goals involving employment, education,
poverty, research and development (R&D), and environmental sustainability. These goals
are quantified via European-wide numerical targets on a group of relevant economic,
social, and environmental indicators. This multidimensionality calls for a conceptually
sound and analytically transparent composite measure that synthesizes progress along the
many different dimensions of Europe 2020.
To accommodate the heterogeneity of EU-28 countries, the above European-wide
objectives were subsequently transformed into a set of more realistic national targets for
individual countries. This was done for a majority of country-indicator pairs (by the
member countries themselves), but not for all. Notably, the UK lacks employment, R&D,
education, and poverty targets, while a handful of other countries lack targets in R&D
and poverty reduction. In general, Member States selected lower national targets when
the distance to the EU target was great. Only the Nordic Member States, Austria and the
Netherlands set most targets higher. Nevertheless, the distance to national targets
remained higher for the member states far removed from the EU targets, than for the ones
close to them.
The environmental sustainability targets regarding emissions cannot be completely
disaggregated to the country level, as emissions that are part of the ETS trading scheme
are auctioned and traded EU-wide. Thus, any attempt at measuring progress towards
meeting Europe 2020 targets must grapple with the awkward fact that desirable
2
http://eur-lex.europa.eu/LexUriServ/LexUriServ.do?uri=COM:2010:2020:FIN:EN:PDF
Europe 2020 Regional Index | 11benchmarks, on the basis of which progress is assessed, may not always be available.
This means that either such targets will need to be occasionally imputed, or some
countries and/or indicators will need to be omitted from the analysis. In this work, we
have predominantly opted for the former option by imputing national targets where they
are not available, provided the corresponding EU-28 regional data are not too sparse.
While we have attempted to do so with care, such imputation introduces an unavoidable
degree of subjective judgment to the results that policy makers should be aware of.
To obtain a spatially refined appreciation of Europe 2020’s current status and the future
challenges underlying its successful implementation, our analysis is disaggregated to the
regional NUTS 2 level. This poses a number of challenges regarding data availability,
which for certain indicators can be quite sparse. In some cases, such considerations were
pivotal in deciding whether an indicator should be included in the composite index. In
particular, as there is no regional data whatsoever for the environmental sustainability
indicators, we decided to drop them from the composite index. In doing so we took the
view that heroic attempts at imputing regional data to these indicators (two of which also
lack national targets) would be theoretically and practically indefensible, and generate
more heat than light. On the other hand, poverty and social exclusion data at the NUTS 2
level are also quite sparse, with coverage around 40%. However, in this case, the
existence of (a) a decent amount of NUTS 2 data; (b) well-defined national targets, and;
(c) a sizable amount of NUTS 1 data, tilted the scales towards keeping this indicator in
the composite measure, and proxying where necessary NUTS 2 data by available NUTS
1 or national figures.
With the above caveats in mind, we propose a straightforward methodology for the
calculation of the Regional Europe 2020 Index, that can be easily applied and understood.
The approach we adopt is similar to the one used in the computation of the Lisbon Index
(Dijkstra, 2010). A region’s progress towards meeting an individual goal is measured via
the (appropriately normalized) shortfall of its actual performance with respect to its
national target. Subsequently, its Europe 2020 Index score is calculated by considering a
weighted arithmetic average of these percentage shortfalls over the set of all indicators.
Europe 2020 Regional Index | 12The weighting scheme we employ assigns equal weight to the four remaining thematic
areas of the Europe 2020 strategy. As this choice leads to a moderately imbalanced
correlation structure between the index’s components and the composite measure, we
derived alternative weights that provide both high and balanced correlations. However,
we chose not to adopt them, on theoretical as well as practical grounds that will be
explained in Section 7.
Composite scores and rankings are inevitably sensitive to indicator weights, as well as to
the choice of the aggregation framework itself. These are, by and large, subjective
choices. Thus, it is useful to assess the robustness of the produced ranking by
systematically considering its divergence with rankings produced under plausibly
different combinations of weights and aggregation schemes. This is achieved via an
uncertainty and sensitivity analysis along the lines discussed in Saisana et al. (2005). We
observed that weights and aggregation were roughly equally important input factors.
Moreover, while the ranks of a handful of regions were quite sensitive to changes in
weights and aggregation (primarily due to low performance along a single Europe 2020
dimension), index ranks as a whole were quite robust.
This paper is structured as follows. Section 2 provides brief remarks on the Europe 2020
strategy and its specific objectives and targets, while Section 3 reviews relevant prior
work. Section 4 introduces the theoretical framework of the Europe 2020 Index and
Section 5 discusses data availability for its various components. Section 6 takes up the
issue of data and target imputation. Section 7 applies the theoretical framework of
Section 4 to the Europe 2020 context. It provides a brief discussion of the index’s results
and statistical properties. To gauge the index’s robustness, Section 8 presents an
uncertainty and sensitivity analysis of index rankings. Section 9 provides concluding
remarks. In the Appendix the index is recalculated under the assumption of common EU-
28 wide targets and the results are briefly compared to those obtained in Section 7.
Finally, the Appendix concludes with maps depicting regional performance in the Europe
2020 thematic areas.
Europe 2020 Regional Index | 13The Europe 2020 Strategy
Europe 2020 is a ten-year economic strategy introduced by the European Commission in
March 2010. Its stated aim is to promote “smart, sustainable, and inclusive” growth.
Europe 2020 identifies eight headline targets to be attained by the end of 2020, involving
(a) employment; (b) research and development; (c) climate/energy; (d) education; and (e)
social inclusion and poverty reduction.
Table 1 summarizes these broad objective areas for the entire EU, along with the specific
targets they entail. Each target is abbreviated by the acronym appearing in parentheses.
Table 1: Europe 2020 objectives and targets for the EU as a whole
1. Employment
a) 75% of the 20-64 year-olds to be employed (EMP)
2. R&D
b) 3% of the EU's GDP to be invested in R&D (R&D)
3. Climate change and energy sustainability
a) greenhouse gas emissions 20% (or even 30%, if the conditions are right) lower
than 1990 (GHG)
b) 20% of energy from renewables (REN)
c) 20% increase in energy efficiency compared to 2005 (EFF)
4. Education
a) Reducing the rates of early school leaving below 10% (ESL)
b) at least 40% of 30-34–year-olds completing third level education (TERT)
5. Fighting poverty and social exclusion
a) at least 20 million fewer people in or at risk of poverty and social exclusion
(AROPE)
As mentioned in the introduction, for some of the Europe 2020 objectives, national
targets have also been determined in addition to the EU-28 ones. These national targets
translate European-wide goals to levels that are realistically attainable for individual
Europe 2020 Regional Index | 14countries. Such adjustments are necessary, given the intrinsic heterogeneity of the EU.
Table 2 lists these national Europe 2020 targets. The figures for EMP, R&D, ESL, and
TERT were directly obtained from Eurostat. Eurostat does not list national targets for
GHG since national commitments on these indicators involve just emissions not covered
by the EU Emissions Trading System (EU ETS), which are not distinguished in Eurostat
statistics. The situation is less clear for EFF where some national targets are listed on a
pdf file3 that can be downloaded the Commission’s Europe 2020 website, but no national
targets of any sort are listed in Eurostat or other Commission webpages or sources. We
suppose this is because the EFF target has largely been considered symbolic, as it is not
easily measurable. REN targets are available but we choose not to list them, in light of
the fact that this indicator will be omitted from the composite index due to complete lack
of regional data.
AROPE national targets involve numerical goals regarding the reduction of the total
number of people at risk of poverty or social exclusion. However, given that the effort to
reduce the number of people at risk should be seen in light of the total population of
country and its share of population at risk, we transformed the national AROPE Europe
2020 targets into population percentages using 2009 national data on total population
( , number of people AROPE , and the Europe 2020 target
reduction ( . The first two types of data we obtained from
Eurostat, while the third by visiting each country’s individual webpage at the Europe
2020 Commission website.4 For the sake of analytic precision, the AROPE target of
country expressed as a population percentage, denoted by , is equal
to:
3
Found at the URL: http://ec.europa.eu/europe2020/pdf/targets_en.pdf
4
http://ec.europa.eu/europe2020/europe-2020-in-your-country/index_en.htm
Europe 2020 Regional Index | 15Looking at Table 2, we see that none of the listed national targets are available for the
United Kingdom (UK). A handful of other countries have either not reported targets for
certain objectives (Croatia for AROPE), or have provided targets that are of a different
nature than the Europe 2020 figures (the Czech Republic for R&D and Sweden for
AROPE).
We imputed targets for these missing values and highlight them in Table 2 in red. We
defer the explanation of how this imputation was performed to Section 6.
Europe 2020 Regional Index | 16Table 2: Europe 2020 national and EU-28 targets
Country EMP R&D ESL TERT AROPE
EU-28 75 3 10 40 19.5
AT 77 3.76 9.5 38 14.0
BE 73.2 3 9.5 47 16.4
BG 76 1.5 11 36 43.5
CY 75 0.5 10 46 20.2
CZ 75 2.35 5.2 32 13.6
DE 75 3 9.9 42 19.4
DK 80 3 9.9 40 17.1
EE 76 3 9.5 40 19.7
EL 70 0.67 9.7 32 22.8
ES 74 3 15 44 21.3
FI 78 4 8 42 13.8
FR 75 3 9.5 50 14.9
HR 59 1.4 4 35 27.9
HU 75 1.8 10 30.3 24.7
IE 67 2 15 26 21.3
IT 67 1.53 15 26 21.4
LT 72 1.9 8.9 40 24.3
LU 73 2.3 9.9 40 16.6
LV 73 1.5 13.4 34 31.8
MT 62.9 0.67 29 33 18.4
NL 80 2.5 7.9 40 14.5
PL 71 1.7 4.5 45 23.5
PT 75 2.7 10 40 23.2
RO 70 2 11.3 26.7 41.7
SE 80 4 9.9 40 14.2
SI 75 3 5.0 40 14.7
SK 72 1 6.0 40 16.6
UK 77.1 2.87 12.3 42.9 18.6
Source: http://ec.europa.eu/europe2020/europe-2020-in-your-country/index_en.htm
Imputed targets in red.
Related work
In this section we briefly discuss two composite indicators, the Regional Lisbon and
Competitiveness Indices, which are relevant to the Europe 2020 index.
Europe 2020 Regional Index | 17DG REGIO Regional Lisbon Index
Perhaps the most relevant prior work can be found in the development of the Regional
Lisbon Index by DG REGIO (Dijkstra, 2010). The Regional Lisbon Index was designed
to measure regional performance in meeting the goals set forth by the 2000 Lisbon
Treaty. Though the Lisbon and Europe 2020 growth strategies are largely distinct, there
are some similarities between their thematic areas (e.g., employment, education, and
research and development). NUTS 2 regions were classified into three broad categories:
(i) Convergence; (ii) Transition; and (iii) Regional Competitiveness and Employment
(RCE).
Regional performance in a particular indicator was measured via the ratio of its distance
to the target over the maximum such distance across all regions. The Lisbon Index was
calculated as the simple average of performance across indicators and particular attention
was paid to intuitiveness and consistency. The index’s developers sought to ensure that
identical levels of performance received identical scores across time. Moreover, double-
counting was avoided by considering just indicators that were mutually exclusive. An
additional concern involved ensuring that identical percentage increases across indicators
resulted in the same increase for the value of the index.
DG REGIO Regional Competitiveness Index
This development of the Regional Competitiveness Index (RCI) (Dijkstra et al. 2011;
Annoni and Dijkstra, 2013) was substantially more complex than that of the Lisbon
Index. In contrast to the specificity of the Lisbon targets, competitiveness is a broad
concept that is open to subjective interpretation. Therefore, the developers of the RCI had
to first devise a coherent theoretical framework with which to measure competitiveness.
To this end, eleven pillars of competitiveness were defined and then grouped into three
broad categories (i.e., “Basic,” “Efficiency,” and “Innovation”). Each pillar involved a
number of indicators, ranging from three to fourteen, and pillar scores were obtained by
taking the simple average of the associated indicator scores, suitably normalized.
Europe 2020 Regional Index | 18European NUTS 2 regions were divided in five groups, reflecting their stage of economic
development. This stratification was performed on the basis of regional per capita GDP
as compared to the EU average. The RCI was obtained by a weighted linear aggregation
of pillar scores. The weights assigned to each pillar varied from group to group, to
accommodate heterogeneity in country priorities. The Innovation pillar weights went up
as the level of development rose, while the converse was true for the Basic pillar
(Efficiency pillar weights were fixed across groups).
Theoretical Framework of the Europe 2020 Regional Index
In this section, we describe the methodology we used to calculate the index. Specifically,
we provide a brief description of its mathematical structure and discuss issues related to
outlier treatment.
Before going into the specifics of the Europe 2020 context, we provide an abstract
description of our framework. Consider a region and a set of indicators. For each
indicator , define the constant to equal 1 if higher values correspond to better
performance, and -1 if they correspond to worse performance. The variables and
denote region ’s target and performance with respect to indicator . The set of targets for
a region is denoted by the -dimensional vector , while its actual
performance by the vector
Focusing on indicator , the variable denotes the distance between a region ’s
performance relative to its target (with no extra “points” awarded if the target is met):
Focusing on a particular indicator , region ’s performance relative to its target is
captured by the variable , defined as:
Europe 2020 Regional Index | 19The above quantity ranges between a minimum of 0, if region has the greatest distance-
to-target with respect to indicator , and a maximum of 1, if it meets or exceeds the target.
Clearly, higher values imply better performance.
Note: In the version of the Index we present in this report, the normalization of distances
to target (i.e., the denominator in the expression of ) was done by considering the
maximum such distance over both (i) years 2010 and 2011, and (ii) the version of the
Index with national and EU-28 targets. This ensures comparability over time and
national/EU-28 targets.
Suppose now that each indicator is assigned a weight of , such that ∑ .
Taking a weighted arithmetic average over the set of all indicators yields region ’s total
performance :
∑
This quantity is bounded below by 0 and above by 1, and higher values imply better
performance. The above framework for measuring progress towards meeting a set of
targets was used in the computation of the Regional Lisbon Index (Dijkstra, 2010). It is
reminiscent of (though distinct from) scholarly contributions in the measurement of
different multidimensional phenomena involving thresholds and cut-off points, such as
poverty (Alkire and Foster, 2011). Section 7 applies this framework to the Europe 2020
context.
Data
Europe 2020 Regional Index | 20When constructing the Europe 2020 index, we adopted the following general scheme:
Year
Europe 2020 Index X
EMP X
R&D X
ESL Average of (X-1)-X-(X+1)
TERT Average of (X-1)-X-(X+1)
AROPE X+1
Construction of Europe 2020 index for a year X
For instance, to calculate the Europe 2020 Index for year 2011, we considered
employment and R&D data from 2011, 2010-2012 averages for education (ESL and
TERT) data, and 2012 poverty and social exclusion data. The consideration of a three
year moving average for ESL and TERT was pursued in light of many regions’ small
sample sizes for these indicators. The one-year look-ahead convention for AROPE was
adopted to accommodate the temporal structure of the EU-SILC survey from which these
data are drawn.
Given the above scheme, let us focus on the 2011 version of the Europe 2020 index and
consider each indicator’s data availability.
Employment (EMP). This indicator has 100% coverage over the entire EU-28
NUTS 2 regions.
R&D spending (R&D). Data for the Niederbayern (DE22), Oberpfalz (DE23), and
Luxembourg (LU00) were unavailable.
Education (ESL and TERT). ESL data for Burgenland (AT11), Aland (FI20),
Corse (FR83), Bratislavskykraj (SK01) were unavailable. TERT data for Aland
(FI20), Corse (FR83), Valle d’Aosta (ITC2), and Regiao Autonomao dos Acores
(PT20), were unavailable.
Fighting poverty and social exclusion (AROPE). Compared to EMP, R&D, ESL
and TERT, coverage for AROPE is very low (around 40%), since many countries
do not report regional poverty statistics. Indeed, Germany, France, Portugal, and
Europe 2020 Regional Index | 21the United Kingdom report only national data, while Belgium, Greece, the
Netherlands, and Hungary report just national and NUTS 1 data.
Data and Target Imputation
Data. We decided to use available NUTS 1 or, where that was not possible, national data,
to extrapolate NUTS 2 missing data. Meanwhile, if a region lacked data in more than 2
indicators, then it was discarded altogether from the analysis. This means that the index
was not calculated for the French Departements d’Outre Mer regions
(FR91,FR92,FR93,FR94).
As mentioned above, the overwhelming majority of missing data was due to the AROPE
indicator. Here, NUTS 1 data were used to extrapolate AROPE data for NUTS 2 regions
in Belgium, Greece, the Netherlands, and Hungary, while national figures were used in
the case of France, Germany, Portugal, and the United Kingdom. 2010 figures are used
for Belgium, Greece, and Ireland, as the respective 2011 data were not yet available.
Moreover, Luxembourg’s R&D indicator was proxied from existing 2010 data. We did
not impute values for other missing data involving R&D, ESL, and TERT (10 data points
in total), because we did not feel confident in the validity of our estimates.
Targets. When national targets for a particular country-indicator pair were not available,
a reasonable estimate, based on the national targets of countries with roughly similar
“starting points”, was derived. Let us illustrate our approach with an example based on
the UK’s TERT target. In 2009 the UK had a TERT of 41.5, which was similar to that of
DK (40.7), NL (40.5), LT (40.6), PT (71.2), FR (43.2), and CY (43.9). TERT targets for
the latter countries were available, so we went ahead and computed the distances of their
2009 rates to their corresponding targets5, which was equal to 1.4. This represents an
average distance to target for countries with similar TERT starting points to the UK. To
5
Where this distance was negative (as in the case of DK and NL), meaning that a country had already
attained its target in 2009, we truncated it to 0.
Europe 2020 Regional Index | 22impute the UK target, we added to its 2009 value this average distance to target, resulting
in a target of 41.5+1.4=42.9.
Following the above procedure, we imputed all missing targets. The resulting figures are
shown in Table 3.
Table 3: Imputed National Targets (in red)
Country EMP R&D ESL TERT AROPE
CZ - 2.35 - - -
HR - - - - 27.9
SE - - - - 14.2
UK 77.1 2.87 12.3 42.9 18.6
The imputed data and targets were then used in the computation of the Europe 2020
Index.
The Europe 2020 Regional Index
In constructing the Europe 2020 Regional Index, we utilized the theoretical framework
laid out in Section 4. The set of indicators consisted of EMP, R&D, ESL, TERT, and
AROPE. To reflect balance across objectives, the component scores of indicators EMP,
R&D and AROPE were assigned weight 0.25, while a weight of 0.25 was assigned to the
average of ESL and TERT. This was done to reflect equal a priori importance for the
objectives of promoting employment, research and innovation, education, and poverty
reduction.
Recalling the notation of Section 4, and letting , a region ’s
Europe 2020 score, denoted by , was given by the following expression:
Europe 2020 Regional Index | 23( )
If a region was missing data for a given objective (i.e., EMP, R&D, EDU [both ESL and
TERT], and AROPE) of the Europe 2020 index, then the weight of this component was
uniformly assigned to all others. If, on the other hand, missing data involved only one of
ESL and TERT comprising the EDU objective, then the weight of the missing indicator
was assigned to the other one within the EDU objective.
Correlation Structure
Before presenting the Europe 2020 regional index results and rankings, we comment on
the correlation structure of the composite indicator. We found all four of its components
( to be positively correlated with each other as well as to the
composite scores , at very high significance (maximum p-value < .001).
Table 4: Correlation matrix of composite components and index (N=268)
1 0.24 0.37 0.70 0.77
1 0.45 0.12 0.72
1 0.22 0.68
1 0.66
The component presents the widest set of correlations, with values ranging from
0.12 for to 0.70 for . This could be due to the high amount of imputed data
(roughly 60% of total). Meanwhile, component-composite correlations range from a
maximum of 0.77 ( to a minimum of . Thus, we see that the Europe
2020 index reflects similar importance for the four thematic areas of employment,
research and development, education, and poverty.
Europe 2020 Regional Index | 24Europe 2020 Regional Index Results and Discussion
Table 5 lists the regions with the top and bottom-10 Europe 2020 index scores. Moreover,
it lists the bottom 10 performers in the index’s five components. The top-10 regions for
each component are not well-defined, as many regions attain perfect scores of 1 in the
various dimensions of the Index. Thus, we simply the note the number of such regions
attaining perfect scores, implying that they meet or exceed their respective national
targets (this figure is not provided for AROPE because of the very high amount of data
imputed from national and NUTS 1 figures).
Table 5: Top and Bottom-10 regions in Europe 2020 Regional Index and its components
(listed in descending and ascending order, respectively).
Top-10 Bottom-10
BE24*, CZ01*, DE21, SK01, FI1B, ES63, ES64, ES70, ITG1, ES61,
ITH2, SE23, ITH5, SE11, DED2 ES43, ES62, ITF3, ES42, PT20
ES63, ITF3, ES61, HU31, ITG1,
59 regions meet or exceed target
ITF6, ES64, HU32, ES70, ES43
FI20, SE32, SE21, AT11, SE31,
38 regions meet or exceed target
ES63, ES64, ES53, FR83, UKK3
PT20, ES63, PT30, ES53, ES61,
87 regions meet or exceed target
ES62, ES43, ES64, PT15, ES42
SK02, ES64, DEE0, DE93, PT18,
52 regions meet or exceed target
CZ04, DEA5, SK04, DE94, DEA4
ITG1, ITF3, ITF4, ITF5, ITF6,
N/A
BE10, ES63, ES64, ES70, AT13
Note: Top-10 regions not listed for AROPE due to very high amount of imputed
data. An asterisk denotes regions exceeding or meeting all targets.
Four capital regions (Prague CZ01, Bratislava SK01, Stockholm SE11, Helsinki FI1B)
are among the top-10 Europe 2020 performers. Other top performers include the Italian
regions of Trento (ITH2) and Emilia-Romagna (ITH5), the Belgian region of Vlaams-
Brabant (BE24), the Swedish region of Vastverige (SE23) and the German regions of
Europe 2020 Regional Index | 25Oberbayern (DE21) and Dresden (DED2). At the other extreme, Spain’s performance is
particularly disappointing as it is responsible for seven of the bottom-10 regions. Four of
these regions are found in the southern and south-central parts of the country (Andalucia
ES61, Murcia ES62, Extremadura ES43, Castilla-la-Mancha ES42) while the other three
include the Canary Islands (ES70) and two small autonomous territories in Africa (Ceuta
ES63 and Melilla ES64). Finally, Italy’s southern regions of Sicily (ITG1) and
Campania (ITF3), and the Portuguese autonomous region of the Acores islands (PT20)
round out the bottom 10.
Map 1 below presents the results of the Europe 2020 Regional Index. It reinforces the
point that countries present notable heterogeneity in their Europe 2020 performance, and
confirms the necessity of looking into the regional dimension of Europe 2020. The
country presenting the greatest such variability is Italy, with a particularly acute North-
South divide. Meanwhile, it is clear that regions in Spain, Greece, Bulgaria, and Hungary
are consistently problematic in meeting their Europe 2020 objectives.
Europe 2020 Regional Index | 26Map 1: Europe 2020 Regional Index Scores
Europe 2020 Regional Index | 27Figure 1: Europe 2020 Regional Index scores for each country and capital/non-capital regions –
reference year 2011
Figure 1 shows that capital regions almost always (a) surpass the EU-28 aggregate score
and (b) are among the top performers within countries (indeed, they often have the
highest score). A remarkable exception to this trend is the region of Brussels (BE10).
Brussels’ very low score is primarily due to weak performance with regard to
employment and poverty objectives. With a European-wide rank of 255 (out of 268), its
performance stands in stark contrast to the rest of Belgium. Furthermore, it should be
noted that the primary driver of this negative result is not Belgium’s ambitious national
targets: Brussels’ rank goes up to a mere 223 if we uniformly impose the European-wide
Europe 2020 targets (see Appendix).
In a number of countries there is a sizable gap between the performance of the capital and
next-best region (Slovakia, Romania, Poland, Portugal, Hungary, and Finland). Figure 1
further captures the large regional heterogeneity in index scores for countries such as
Italy, Spain, Belgium, the Czech Republic, and Slovakia, among others. This point
reinforces the importance of disaggregating the index to the regional level.
Europe 2020 Regional Index | 28Uncertainty and Sensitivity Analysis
Every region score on the Europe 2020 index depends on subjective modelling choices:
objective-category structure, selected variables, imputation or not of missing data,
normalization, weights, aggregation method, among other elements. The robustness
analysis we perform is aimed at assessing the joint impact of such modelling choices on
the rankings, and thus to complement the Europe 2020 ranks with error estimates
stemming from the unavoidable uncertainty in the choices made.
Our assessment of the Europe 2020 index was based on a combination of Monte Carlo
experiments and multi-modelling approach, following good practices suggested in the
composite indicators literature (Saisana et al., 2005; Saisana et al., 2011). We focused on
two key issues: (i) the choice of objective weights and (ii) aggregation function.
Undoubtedly, we could have incorporated other uncertain elements of the index to our
robustness analysis (e.g.., normalization scheme). However, results from this type of
analysis in other contexts suggest that the choice of weights and aggregation are the two
assumptions with the highest impact on index rankings.
Weight uncertainty
In our analysis, we allow index component weights to be unequal across Europe 2020
thematic areas in a controlled fashion. In particular, weights for EMP, R&D, EDU, and
AROPE are sampled uniformly from the set [ ]
∑ . That is, each indicator’s weight is allowed to deviate at most
20% from its nominal value of 0.25, and all the weights must sum to 1.
Aggregation function uncertainty
Regarding the choice of aggregation formula, the simple arithmetic average has been
criticized on the basis of its perfectly substitutable structure, whereby high performance
in one indicator can fully compensate for low performance in another. We relaxed this
strong perfect substitutability assumption by introducing a parametric family of
Europe 2020 Regional Index | 29aggregating functions that are known as generalized weighted means (Decancq and Lugo,
2013). Parameterized by , the generalized weighted mean of a vector given
weights is given by:
(∑ )
When , the above function reduces to a weighted arithmetic (geometric) mean.
The parameter can be interpreted in terms of the elasticity of substitution between the
different dimensions of the index, , where The smaller the value of , the
lower the substitutability between the different dimensions of performance (note that the
case corresponding to an arithmetic mean implies infinite substitutability).
For values of , generalized weighted means reflect a preference for balanced
performance across the different dimensions of the index. Such balance is desirable in our
context, so for the purposes of our uncertainty analysis we mainly considered this range
of . Specifically, in our simulations we considered five values for , namely {0,
0.25, 0.50, .75, 1}, ranging from the arithmetic to the geometric mean.
Generating weight-aggregation samples
We generated a sample of 1500 weight-aggregation pairs in the following manner. First,
we drew a vector of weights from the set [ ]
∑ . Using these weights , regional Europe 2020 scores were
computed via their generalized weighted means for , where the
aggregations were performed at the thematic area level.6
6
As the minimum component score was 0.08, no renormalization was needed.
Europe 2020 Regional Index | 30Table 6. Sources of uncertainty in Europe 2020 index
Reference Alternative
I. Uncertainty in the aggregation Weighted arithmetic average, Generalized weighted mean
formula i.e.,
II. Uncertainty in the weights Equal weights Uniform distribution over set
[ ]
∑ .
Uncertainty Analysis Results
Figure 2 below presents the results of our uncertainty analysis. Regions are ordered from
best to worst according to their reference rank (black dot), the red dot being the median
rank. All published Europe 2020 ranks lay within the simulated 95% confidence
intervals. However, it is also true that regional ranks vary significantly with changes in
weights and aggregation function. Indeed, 20 regions have 95% confidence interval
widths between 30 and 39 (indicated in red in Table 3). Confidence intervals widths for 4
regions lie between 40 and 49 (AT13, UKI62, DE94, DEB1), for 3 regions between 50
and 59 (AT32, SE31, SE32), and one region (SE21) has an interval width of 81.
These big swings are driven by uneven performance in the different dimensions of the
index. The case of the Swedish region of Smaland med oarna (SE21) is highly
illustrative. SE21 does extremely well in all dimensions of the index except R&D, for
which Sweden’s ambitious R&D target, in combination to SE21 GDP’s relatively low
share of R&D lead to a normalized distance from target of 0.23. This is in stark contrast
to performance in EMP, EDU, and AROPE, which all exceed 0.95. Aggregation
functions with will accentuate this imbalance and lead to much worse performance
than under arithmetic aggregation.
Europe 2020 Regional Index | 31Figure 2: Uncertainty analysis results for EU2020 region ranks (based on 1500 weight-
aggregation pairs)
For full transparency and information, Table 7 reports the Europe 2020 ranks together
with the simulated median values and 95% confidence intervals in order to better
appreciate the robustness of the results to the choice of weights and aggregation function.
Confidence intervals wider than 30 are highlighted in red.
Europe 2020 Regional Index | 32Table 7. Uncertainty analysis results for Europe 2020 region ranks.
EU2020 EU2020 EU2020 EU2020
Rank Median 95%CI Rank Median 95%CI Rank Median 95%CI Rank Median 95%CI
BE24 1 1 [1,1] DE26 68 66 [61,73] DE27 135 144 [126,155] UKG2 202 207 [195,217]
CZ01 1 1 [1,1] FR71 69 67 [63,71] PL22 136 133 [123,144] FR81 203 195 [178,211]
DE21 3 3 [3,3] FI19 70 70 [64,73] AT21 137 133 [125,142] FR25 204 196 [189,205]
SK01 4 4 [4,4] ES22 71 72 [66,77] SK02 138 134 [121,145] UKE4 205 202 [195,210]
FI1B 5 5 [5,5] ES21 72 72 [66,76] DK03 139 138 [130,145] FR41 206 200 [193,207]
ITH2 6 6 [6,6] BE31 73 71 [61,78] EL42 140 136 [121,148] SK04 207 201 [183,218]
SE23 7 7 [7,7] NL11 74 75 [72,84] EL41 141 142 [122,158] FR63 208 205 [199,210]
ITH5 8 8 [8,8] DE72 75 75 [69,81] EL14 142 133 [120,148] SE32 209 232 [193,250]
SE11 9 9 [9,10] UKJ2 76 77 [72,88] UKN0 143 141 [133,149] PT11 210 207 [190,219]
DED2 10 10 [9,10] AT22 77 77 [70,86] BE22 144 147 [132,156] ES11 211 215 [206,221]
ITH4 11 13 [11,14] UKJ4 78 77 [72,86] PL41 145 139 [132,145] PL43 212 207 [198,214]
ITC1 12 12 [11,15] HR04 79 79 [75,84] NL13 146 142 [135,147] ITG2 213 208 [188,222]
DE11 13 13 [12,16] DEG0 80 81 [75,85] CZ07 147 143 [137,148] PL62 214 211 [196,221]
NL31 14 15 [11,20] ITC2 81 81 [75,86] EL23 148 144 [122,159] FR26 215 213 [209,219]
ITC3 15 16 [11,19] DE50 82 80 [74,88] DEE0 149 153 [141,168] UKG3 216 211 [201,218]
DE12 16 17 [15,23] DE92 83 84 [78,89] EL25 150 150 [136,170] RO21 217 211 [200,223]
PL12 17 19 [12,26] UKH3 84 84 [79,91] RO11 151 152 [147,158] ITF2 218 214 [192,226]
NL22 18 19 [14,25] CZ02 85 86 [83,89] DK02 152 158 [148,169] FR53 219 220 [213,224]
DE71 19 16 [14,22] EE00 86 83 [77,89] EL22 153 151 [140,166] PL42 220 216 [203,225]
DE14 20 20 [16,26] HU10 87 88 [76,97] UKK2 154 165 [146,178] UKC1 221 219 [213,223]
ITC4 21 21 [19,27] DE24 88 88 [80,96] RO42 155 157 [148,167] AT34 222 225 [213,231]
SE12 22 22 [16,26] EL43 89 91 [82,98] HU22 156 153 [147,163] BE35 223 219 [210,225]
UKJ3 23 24 [18,28] UKE2 90 92 [82,97] UKI1 157 159 [149,170] RO31 224 222 [213,228]
UKM5 23 23 [17,27] CZ03 91 90 [87,96] SK03 158 154 [145,172] HU33 225 224 [204,233]
UKH2 25 26 [20,30] PL21 92 89 [84,92] DEA3 159 169 [151,182] UKE1 226 227 [221,231]
UKJ1 26 25 [19,29] DED4 93 92 [87,100] PL34 160 159 [150,170] BE33 227 222 [208,229]
DK01 27 27 [22,30] NL42 94 93 [89,96] PL51 161 160 [154,171] UKK3 228 232 [223,236]
UKK1 28 29 [27,33] UKF1 95 95 [90,98] ES51 162 160 [154,166] HU23 229 229 [219,234]
NL21 29 28 [23,31] ES30 96 98 [94,102] DEC0 163 168 [155,175] RO12 230 226.5 [221,231]
UKD6 30 31 [29,35] LV00 97 97 [93,101] UKD4 164 164 [155,170] UKL1 231 228 [224,231]
DE23 31 30 [23,35] FR43 98 97 [89,104] PL31 165 156 [148,170] FR22 232 227 [221,234]
DE25 32 32 [26,37] AT33 99 99 [94,102] FR61 166 160 [154,164] BG33 233 232 [224,237]
SI02 33 32 [29,38] FI1D 100 101 [93,108] HU21 167 165 [156,175] ES12 234 234 [230,237]
SE22 34 37 [32,46] IE01 101 101 [91,111] SE21 168 204 [153,234] BE34 235 236 [230,242]
FR62 35 36 [33,43] ITF1 102 100 [97,104] CZ08 169 162 [154,174] FR21 236 234 [230,236]
DE13 36 37 [32,43] DE73 103 105 [99,112] UKI2 170 180 [159,205] FR30 237 236 [233,237]
BE23 37 40 [32,47] PL11 104 103 [100,106] PL32 171 167 [154,182] PT18 238 239 [236,245]
ITI1 38 39 [34,43] SE33 105 108 [100,120] UKD3 172 173 [165,183] PT15 239 240 [238,245]
NL41 39 38 [34,44] AT31 106 107 [101,115] DEA5 173 174 [161,184] FR83 240 242 [238,250]
DE30 40 36 [32,44] BE25 107 115 [102,137] FR51 174 172 [167,177] BE32 241 238 [230,241]
NL32 41 42 [37,46] UKM2 108 109 [103,122] AT32 175 190 [164,217] HU32 242 242 [235,247]
ITI2 42 43 [34,48] DE80 109 107 [103,116] FR82 176 169 [161,182] RO22 243 242 [238,245]
ITH3 43 43 [36,47] CZ05 110 109 [105,117] AT12 177 187 [168,207] BG42 244 244 [239,248]
FR10 44 44 [37,49] FR52 111 108 [104,113] ES13 178 180 [168,192] AT11 245 252 [242,258]
DEB3 45 44 [34,51] NL12 112 114 [109,122] SI01 179 173 [167,185] CZ04 246 245 [242,248]
DEA2 46 46 [38,50] UKL2 113 116 [109,126] UKC2 180 179 [174,188] PT30 247 250 [244,253]
DE91 47 47 [37,54] EL12 114 118 [103,142] ES24 181 184 [176,195] BG32 248 245 [241,250]
CY00 48 47 [38,54] FR42 115 113 [109,117] DE94 182 196 [176,217] FI20 249 259 [242,266]
ITH1 49 50 [47,55] DE40 116 118 [108,128] EL24 183 179 [166,204] BG34 250 245 [240,250]
BE21 50 50 [46,54] LT00 117 113 [105,123] SE31 184 219 [177,237] ES52 251 248 [246,252]
ITI3 51 51 [44,58] UKK4 118 126 [112,147] PL33 185 178 [170,194] ITF5 252 251 [244,254]
DED5 52 54 [47,59] FI1C 119 115 [108,122] FR23 186 182 [177,189] BG31 253 250 [247,253]
ITI4 53 54 [45,60] DEA4 120 122 [110,137] UKD7 187 180 [173,193] HU31 254 253 [251,256]
DK04 54 52 [47,57] EL21 121 121 [105,142] DE93 188 196 [176,212] BE10 255 254 [251,256]
UKH1 55 56 [49,63] UKF2 122 124 [118,136] NL34 189 185 [177,191] ES53 256 255 [252,258]
NL23 56 55 [50,60] PT17 123 120 [109,132] PL52 190 182 [175,193] ITF6 257 256 [254,258]
RO32 57 59 [51,66] DEA1 124 125 [115,135] EL11 191 184 [169,206] ITF4 258 258 [255,260]
DE22 58 58 [49,69] DK05 125 130 [119,146] UKD1 192 190 [180,200] PT20 259 263 [257,265]
NL33 59 57 [52,61] HR03 126 120 [115,126] EL13 193 187 [171,208] ES42 260 258 [256,261]
UKG1 60 61 [56,68] PL63 127 124 [118,133] ES41 194 194 [182,205] ITF3 261 261 [259,265]
EL30 61 66 [55,75] UKM6 128 135 [121,149] ES23 195 195 [188,202] ES62 262 260 [258,263]
CZ06 62 61 [56,66] AT13 129 133 [111,153] DEB1 196 203 [180,220] ES43 263 261 [260,263]
DE60 63 62 [57,70] DEB2 130 138 [121,151] PL61 197 187 [180,199] ES61 264 263 [261,265]
IE02 64 63 [57,69] DEF0 131 138 [123,149] UKF3 198 209 [187,224] ITG1 265 266 [264,267]
BG41 65 66 [59,71] FR24 132 129 [122,138] UKE3 199 191 [185,202] ES70 266 265 [262,266]
MT00 66 66 [59,73] UKM3 133 133 [124,144] RO41 200 194 [186,202] ES64 267 267 [266,267]
LU00 67 66 [60,71] FR72 134 129 [120,139] PT16 201 202 [187,213] ES63 268 268 [268,268]
Europe 2020 Regional Index | 33The relative importance of weights and aggregation to the variation in Europe 2020
ranks
In this section we will investigate the relative importance of uncertainty in weights and
aggregation in the Europe 2020 index. As the following analysis will make clear,
variation in country ranks is overwhelmingly driven by the choice of aggregation
function.
Following Saisana et al. (2005), our measure of robustness is the absolute shift in rank
with respect to the benchmark choice of equal weights and linear aggregation, which we
denote by the variable . That is, given a region and a weight-aggregation pair ,
we are interested in the following quantity (here, denotes region ’s rank
under the version of our composite index that uses weights and aggregation ):
| |
Given a weight-aggregation pair , a compelling aggregate measure of robustness
can be found in the average shift in rank (over the set of regions) that results in,
denoted by , (here is the number of regions):
∑
Focusing on our simulated sample, the sample mean and standard deviation for are
given by: ̅̅̅̅̅ Zooming in now on the choice of aggregation, we
denote by ̅̅̅̅̅ and the expectation and sample standard deviation of
conditional on different values of . We have:
Europe 2020 Regional Index | 34̅̅̅̅̅
1 3.2 0.96
0.75 3.5 1.00
0.50 4.25 1.11
0.25 5.1 1.16
0 6.0 1.16
Figure 3 below depicts the empirical cumulative distribution function (cdf) of , as
well as the analogous distributions conditional on the 5 values of .
Figure 3: Empirical cumulative distribution function of mean shift in rank.
Note: This figure can be read in the following way. Suppose we are interested in the p th percentiles of the
conditional and unconditional distributions of , where the conditioning is performed on the choice of
aggregation function. Then, draw a straight horizontal line originating at point p on the y-axis. This line
will intersect the 5 conditional (blue) and 1 unconditional (red) cdfs at different points, and the x-
coordinates of these points will be the p th percentiles of the respective distributions. For instance,
conditional on , 75 percent of the simulated Europe 2020 rankings have an average absolute shift
in rank of at most 6, with respect to the original Europe 2020 ranking.
Figure 3 makes graphically clear how the choice of aggregation does not seem to have a
big effect on the observed variance of . Indeed, if we fix a value for , we see that the
resulting cdfs of have a similar shape, with their means being translated.
Europe 2020 Regional Index | 35This point can be made also algebraically. Define the sensitivity index ( to be the
fractional contribution to the sample variance of due to the uncertainty in the weights
(aggregation scheme) of the Europe 2020 index. Equivalently, let denote this
contribution due to the interaction effect of uncertainty in both weights and aggregation.7
Simple calculations yield:
Thus, we see that the choice of weights is responsible for 48% of the sample variance of
, while the choice of aggregation function for 43%. Thus, we see that these
contributions are quite high and balanced.
Uncertainty analysis under fixed arithmetic aggregation
Given the above results, we may be interested in asking how robust are the Europe 2020
ranks under exclusively arithmetic aggregation. Figure 4 shows the simulated country
ranks given a fixed choice of arithmetic aggregation. Indeed, comparing it to Figure 2, we
see that confidence intervals are narrower, with 21 countries having a width of 30 or
above. Out of those, 18 regions are in the 30-39 range (EL21, EL41, EL14, EL23, EL25,
UKI2, AT32, DE94, EL24, SE31, DE93, EL11, EL13, DEB1, FR81, SK04, ITF2) and 3
in the 40-49 (SE21, SE32, AT13).
7 For details on the precise definition of sensitivity indices see Saisana et al. (2005).
Europe 2020 Regional Index | 36Figure 4: Uncertainty analysis results under fixed arithmetic aggregation.
As before, the primary factor behind the wide confidence intervals for these countries is
uneven performance across the Europe 2020 thematic areas. This issue is particularly
applicable to Greek regions.
For completeness, Table 8 below presents the uncertainty analysis results for each region
for the entire sample, as well as the restricted sample corresponding to fixed arithmetic
means. Once again, confidence intervals greater than 30 are highlighted in red. The
higher robustness of the case is apparent. However, it is also worth noting that the
confidence intervals of 43 regions become wider under fixed arithmetic aggregation, by
an average margin of 1.4. This is an alternative way of establishing that weight
uncertainty does play a role in the observed variance of the Europe 2020 ranks, even
when keeping the choice of arithmetic aggregation fixed.
Europe 2020 Regional Index | 37You can also read