Climate Projections for the Okanagan Region February 2020 - In partnership with - Regional District of Central Okanagan
←
→
Page content transcription
If your browser does not render page correctly, please read the page content below
Climate
Projections
for the Okanagan Region
February 2020

In partnership with
Chapter 3 – Summer Temperature Indicators...................... 17

Table of Contents                                                                                                                          Days Above 30°C.......................................................................................................18
                                                                                                                                           Hottest Days............................................................................................................... 20
                                                                                                                                           1-in-20 Hottest Day................................................................................................... 21
                                                                                                                                           Growing Season Length....................................................................................... 21
Chapter 1 – Introduction............................................................. 5
                                                                                                                                           Cooling Degree Days.............................................................................................22
How Much Will the Climate Change?........................................................... 6
Shifting Seasons..........................................................................................................7                Chapter 4 – Winter Temperature Indicators........................ 23
A Note on Data Interpretation.............................................................................7                                Average Spring Nighttime Low Temperatures.....................................24
                                                                                                                                           Coldest Night...............................................................................................................26
Chapter 2 – Regional Impacts................................................... 9
                                                                                                                                           Frost Days......................................................................................................................26
Past Climate Events.................................................................................................10
                                                                                                                                           Ice Days........................................................................................................................... 27
Ecosystems and Biodiversity............................................................................. 11                                Heating Degree Days.............................................................................................29
Health................................................................................................................................13
Water Quantity and Quality.................................................................................13                              Chapter 5 – Precipitation Indicators......................................31
                                                                                                                                           Total Precipitation....................................................................................................32
Transportation Infrastructure...........................................................................14
                                                                                                                                           Wettest Day..................................................................................................................35
Stormwater Infrastructure..................................................................................14
                                                                                                                                           Wettest 5 Days...........................................................................................................35
Recreation......................................................................................................................14
                                                                                                                                           1-in-20 Wettest Day................................................................................................ 36
Agriculture......................................................................................................................15
                                                                                                                                           Precipitation on Wet Days and Very Wet Days..................................... 37
Local Economy............................................................................................................16
Buildings and Energy Systems........................................................................16                                     Chapter 6 – Conclusion............................................................39

Appendix 1: Methodology.........................................................41                                                         Appendix 2: Maps by Regional District.................................43
Climate Model Selection.....................................................................................42                             Section A: Maps for Regional District
Indicator Derivation................................................................................................42                     of North Okanagan (RDNO)...............................................................................44
Interpretation..............................................................................................................42             Section B: Maps for Regional District
                                                                                                                                           of Central Okanagan (RDCO)........................................................................... 50
                                                                                                                                           Section C: Maps for Regional District
                                                                                                                                           of Okanagan-Similkameen (RDOS)............................................................ 56

List of Figures                                                                                                                            List of Tables
Figure 1: Future Temperature by Emissions                                                                                                  Table 1: Change in Summer Days Above 30°C.......................................18
Scenario for BC............................................................................................................ 8              Table 2: Change in Hottest Day (TXx)......................................................... 20
Figure 2: Understanding the Variable Path                                                                                                  Table 3: 1-in-20 Hottest Day (RP20 TX)........................................................ 21
of Climate Change..................................................................................................... 8
                                                                                                                                           Table 4: Change in Growing Season Length...........................................22
Figure 3: Days Above 30°C – Past..................................................................19
                                                                                                                                           Table 5: Change in Cooling Degree Days.................................................22
Figure 4: Days Above 30°C – Future (2050s)...........................................19
                                                                                                                                           Table 6: Change in Average Spring Nighttime Lows........................24
Figure 5: Spring Nighttime Lows – Past....................................................25
                                                                                                                                           Table 7: Change in Coldest Nights.................................................................26
Figure 6: Spring Nighttime Lows – Future (2050s)............................25
                                                                                                                                           Table 8: Percent Change in Frost Days, Annually............................... 27
Figure 7: Ice Days – Past......................................................................................28
                                                                                                                                           Table 9: Change in Ice Days.............................................................................. 27
Figure 8: Ice Days – Future (2050s)..............................................................28
                                                                                                                                           Table 10: Percent Change in Heating Degree Days...........................29
Figure 9: Autumn Precipitation – Past.......................................................34
                                                                                                                                           Table 11: Seasonal Precipitation......................................................................33
Figure 10: Autumn Precipitation – Future (2050s)..............................34
                                                                                                                                           Table 12: Wettest Days Indicators................................................................. 36
Figure 11: Autumn Precipitation
                                                                                                                                           Table 13: Change in Wet Days and Very Wet Days............................. 37
– Percent Change (2050s).................................................................................35
Figure 12: Wet Days – Past................................................................................. 38
Figure 13: Wet Days – Future (2050s)......................................................... 38
                                                                                                                                                                                           Climate Projections for the Okanagan Region | 1
Acknowledgements
This work offers climate projections for the Okanagan region, which is located within
the Traditional Territories of the Syilx Okanagan Nation and the Splatsin Band of
the Shuswap Nation. This report is a collaboration between the Regional District of
North Okanagan (RDNO), the Regional District of Central Okanagan (RDCO), and the
Regional District of Okanagan-Similkameen (RDOS) that would not have been made
possible without the participation of nearly 90 stakeholders from across the region,
the support of Trevor Murdock, Steve Sobie, and Kari Tyler from the Pacific Climate
Impacts Consortium in providing climate data and interpretation, and Gillian Aubie
Vines, who served as the project facilitator and lead writer for this project.

This project was made possible with support from Natural Resources Canada through
the Adaptation Platform, Okanagan Basin Water Board and Fraser Basin Council.

2 |
Executive Summary
Climate change is challenging ecosystems, communities, and the economy. Wildfires, flooding, and
drought have already overwhelmed local infrastructure, caused economic losses, and posed health
risks to communities. Significant effort to reduce the reliance on fossil fuels as quickly as possible
will slow, and has the potential to curb, climate change by the late century, making greenhouse gas
emissions reductions a central part of any long-term adaptation strategy.1

Designing to current and future climate parameters is markedly more cost effective than reacting
to climate shocks and stresses over time. This report is intended to support a local understanding
of how climate across the Okanagan is projected to change, and inform regional planning on how
to prepare for future climate events. This work is critical to maintaining wellbeing, including robust
ecosystems, a thriving community, and a vibrant economy. Early efforts to prepare infrastructure
and communities to climate change will reduce regional reliance on continued emergency
management activations and support the ability of the region to thrive over time.

        Summers are getting hotter by the later part of the century, the valley bottoms, where
        the majority of the population lives, can expect on average, almost triple the number of
        days with temperatures at or over 30°C as in the past.

This report offers climate projections for both the 2050s and the 2080s. The 2050s projections
are useful for medium-term planning purposes, while the 2080s provide guidance for long-term
planning and decision-making. Findings indicate that the Okanagan can expect significant changes
to climate in the coming decades, including:
• W
   armer temperatures year-round. Temperatures will increase year-round. Summer and autumn daytime
  highs are increasing more rapidly than in other seasons. This will result in longer warm seasons, and shorter cold
  seasons over time.

• S
   ummers will be considerably hotter. In the past, the Okanagan region as a whole experienced 6 days per
  year, on average, above 30°C. By the 2050s, the region can expect an average of 22 days above 30°C per year
  and 36 days per year by the 2080s. This change is more pronounced in the valley bottoms, with approximately 50
  additional days above 30°C by the 2080s, on average, compared to the past. Temperatures can be expected to
  surpass 43°C on an annual basis in the populated areas of the Okanagan region by the end of the century. These
  indicators of warming mark a considerable change, and could lead to significant human and ecosystem
  health impacts.

• I ncreased duration of growing season. Across the Okanagan, growing season length is projected to increase
  from about 5.5 months to almost 7 months by the 2050s, and almost 8 months by the 2080s. While this longer
  season may bring opportunities for new crops, water management, weather variability, and extreme events
  may reduce the productivity of the agricultural sector.

• W
   armer winter temperatures. Temperatures on the coldest nights are projected to rise in all seasons across
  the Okanagan. Winter nighttime low temperatures are projected to warm more than other seasons. By the
  2050s, there will be 28% fewer frost days, which will have implications for invasive species, agriculture, and
  streamflow.

• I ncreased precipitation across all seasons except summer. Precipitation will increase during the spring and
  autumn months where, on average, the region can expect 17% more rainfall during these seasons by the 2080s. This
  can lead to more frequent flooding and landslides, as well as stress to ecosystems and infrastructure.

1
    Summary for Policymakers of IPCC Special Report on Global Warming of 1.5ºC approved by governments.

                                                                                                      Climate Projections for the Okanagan Region | 3
• S
         ummer is expected to remain the driest season, and become drier. By the 2080s, the region can expect
        23% less precipitation in the summer. Decreases in precipitation plus hotter temperatures (and thus increased
        evaporation) mean drier, hotter summers, posing increased risk of wildfires and associated health impacts.

      • S
         hifting seasons. With warmer annual temperatures, the winter “season” is expected to shorten while the
        summer “season” will lengthen, causing spring-like conditions earlier and autumn-like conditions later in the year.
        Projections illustrate that January temperatures of the future will feel like March temperatures of the past,
        and future May temperatures will be similar to August temperatures of the past.

           Climate change will cause significant changes in the region. Based on these changes,
           there is a need to plan for more intense and hotter fires, increasing water shortages,
           more smoke days, and a greater likelihood of spring flooding. These changes will have
           serious consequences on ecosystems, communities, and the economy.

      The intent of this report is to enable community leaders and local decision makers to explore how
      to prepare the Okanagan for the interrelated impacts facing the region. This work provides detailed
      projections for temperature and precipitation for each participating Regional District, which help
      predict possible future instances of extreme weather events, such as wildfires, drought, and
      flooding. This report builds on these projections by offering preliminary insights into the impacts
      these projections will have on the region.

      This document is intended to be used as a tool to support climate-informed planning and decision-
      making, and a thriving Okanagan over time. This is a call to action for leaders across the
      Okanagan to work together and prepare for the changes ahead.

                                                     FIGURE E-1: STUDY AREA

4 |
Chapter 1

Introduction

               Climate Projections for the Okanagan Region | 5
Chapter 1

      Introduction
      Climate change is having an impact on industry, ecosystems, and communities across the
      Okanagan. Wildfires, drought, and flooding already challenge local infrastructure and pose health
      risks to communities. The three regional districts in the Okanagan Basin (North Okanagan, Central
      Okanagan, and Okanagan-Similkameen) have worked together to understand how climate
      change will affect the region over time, and this report is intended to raise awareness and assist
      communities in preparing and planning for the future.

      The purpose of this report is to offer science-based information on how the Okanagan’s climate
      is changing and expected to change over the 21st century. In the report, projections for the 2050s
      illustrate the likely trajectory of climate change regardless of global emissions reductions, and
      projections for the 2080s illustrate a future climate scenario, assuming little progress by late
      century on a global shift away from a fossil fuel–based economy.

      This report is intended to inform community-level planning and decision-making, and to provide a
      starting point for conversations on the impacts of climate change. Through regional collaboration,
      and with thoughtful planning and investment, communities will be prepared for future climate and
      climate events, and will avoid excessively stressing emergency management systems, personnel,
      and infrastructure. While offering science-based projections, this report is not intended to offer a
      prediction of specific impacts or serve directly as design guidelines for future planning; however, it
      can support local exploration of climate impacts, and provide the basis to inform the development
      of organizational and regional climate action plans.

      How Much Will the Climate Change?
      The extent of how much the climate changes over time depends directly on how well the global
      community is able to reduce greenhouse gas (GHG) emissions in the near term. While various future
      trajectories of GHG emissions are possible, this report presents projections for a high GHG emissions
      scenario for the remainder of this century, known as Representative Concentration Pathway 8.5
      (RCP8.5: red line in Figure 1 below). This represents minimal emissions reductions, without significant
      global cooperation and investment in reducing GHG emissions, and is the most commonly used
      scenario for planning in BC, in Canada, and globally. The RCP4.5 “medium stabilization” scenario
      (yellow line) represents mitigation efforts that result in about half of the emissions compared to the
      RCP8.5 scenario. To achieve RCP2.6 (blue line), the only pathway that would keep global warming
      below 2.0°C above pre-industrial temperatures, substantial and sustained reductions in GHG
      emissions are required—for example, extensive adoption of biofuels and vegetarianism, electrification
      of energy and transportation systems, along with carbon capture and storage.

      The three RCP scenarios described above have somewhat similar GHG concentrations in the 2050s,
      with a moderate change in temperature and precipitation. The scenarios diverge considerably by the
      2080s, resulting in considerable differences in climate by the end of the century. This illustrates the
      importance of aggressive mitigation as a primary adaptation strategy.

      Additional information on climate scenario and model selection, and indicator derivation and
      interpretation can be found in Appendix 1 – Methodology.

6 |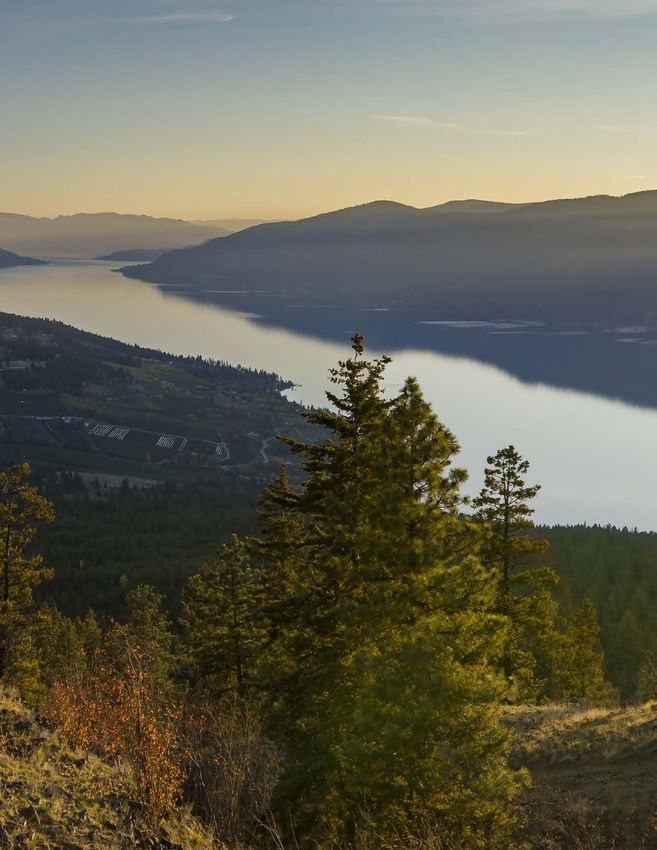
It is important to note that climate change will not always result in consistent changes in weather
across the region or over time. Annual and seasonal variations in temperature and precipitation will
continue to occur (as shown by the red lines in Figure 2 below) resulting in unusual weather and
more extreme events. Also, local differences will continue to influence microclimates in specific
locations within the Okanagan. In light of this, planners and managers will need to prepare for a
range of changes and for variability across seasons and from year to year.

Shifting Seasons
With temperatures warming, the winter “season” is expected to shorten over time, and the summer
“season” to lengthen, causing spring-like conditions to occur earlier in the year, and autumn-like
conditions to occur later. The box-and-whisker plots of monthly daytime high and nighttime low
temperatures, provided in the Additional Indicators Appendix, offer a comparison of the range of year-to-
year variability in the future to that experienced in the past, and illustrate these seasonal shifts over time.
These plots indicate that: January temperatures of the future will feel like March temperatures of the
past and future May temperatures will be similar to August temperatures of the past.

    A Note on Data Interpretation
    Data in the report is broken into the Okanagan region (representing RDNO, RDCO, and
    RDOS combined), and into each of the three Regional Districts. Within each Regional
    District, data is further broken into “the whole Region” (representing the entire boundary of
    the Regional District), and “valley bottoms” (representing the populated areas).

    Results in the report are given by season, in some cases. Winter is defined as December,
    January, and February [DJF], spring represents March, April, and May [MAM], summer
    represents June, July, and August [JJA], and autumn represents September, October, and
    November [SON].

    In the tables, “Past” refers to the historical baseline period of 1971–2000, which is a World
    Meteorological Organization standard time period most commonly used for climate
    projections in BC. Values are based on historical records and are averaged over this 30-
    year period to smooth out annual variability, and, as such, do not include a range.

    Future projections are for the 2050s (which is an average of modelled values over the
    2041–2070 time period) and 2080s (2071–2100 time period). The range for each is provided
    to help readers understand the variability of projections, and is based on 12 individual
    climate simulations.

    Future projections for the 2050s and 2080s are often given as change from the past. Changes
    are not new total values. To determine the new total value, the past baseline value must
    be added to (or multiplied by, in the case of percent changes) the projected change. This is
    because the (relative) change is similar across all geographies, but the baseline values are
    often very different, depending, for example, on latitude, elevation, and local topography. Total
    values would only apply to one geographic point, while the change allows comparison of the
    projections across various locations.

                                                                                           Climate Projections for the Okanagan Region | 7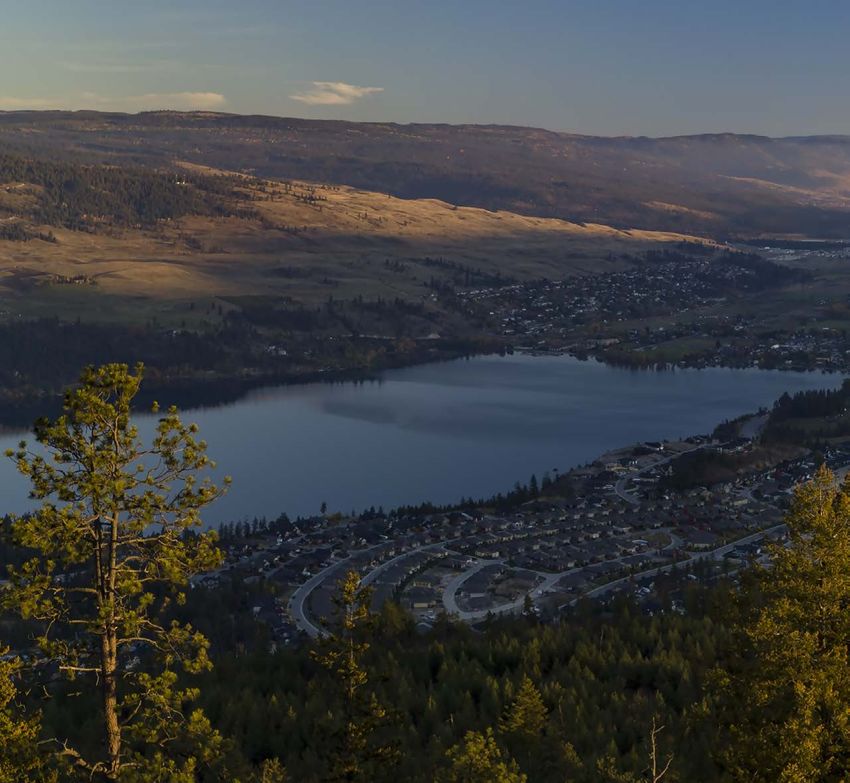
Scenario   Emissions
        RCP8.5     Minor reductions
        RCP4.5     Paris commit
        RCP2.6     Paris goal

      FIGURE 1: FUTURE TEMPERATURE BY EMISSIONS SCENARIO FOR BC

      FIGURE 2: UNDERSTANDING THE VARIABLE PATH OF CLIMATE CHANGE

8 |
Chapter 2
Regional
Impacts
Climate Projections for the Okanagan Region | 9Chapter 2
Regional Impacts
The Okanagan can expect a future climate that is unlike that of the past. While many communities
have been learning to adapt to these changes over time, rising temperatures and a dramatic
increase in variability of weather will continue to challenge the region, and the ecosystems that
underpin the health and wellbeing of Okanagan residents. Recognizing the interdependency of
environmental, economic, and social systems, and the interconnected impacts of climate change,
supporting the vibrant Okanagan region over time will require regional stakeholders to take a
systems approach to resilience and climate preparedness.
Past Climate Events
The regional impacts of climate change can already be seen on the ground. Each Regional District
has experienced unique challenges, including, but not limited to the following:
• T
he Central Okanagan experienced the catastrophic wildfires of 2003 in Okanagan Mountain Park, where 33,000
people were evacuated and 238 homes were lost.
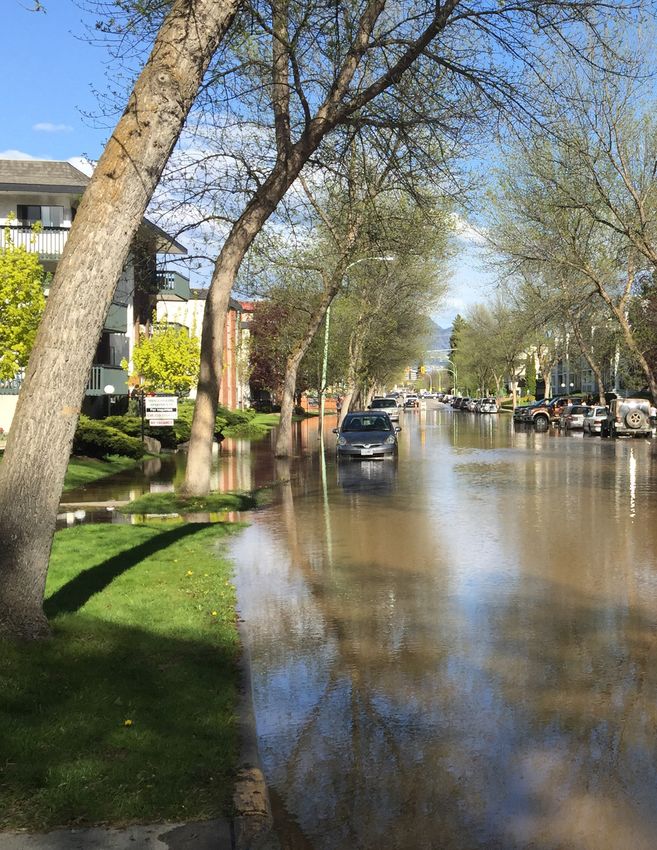
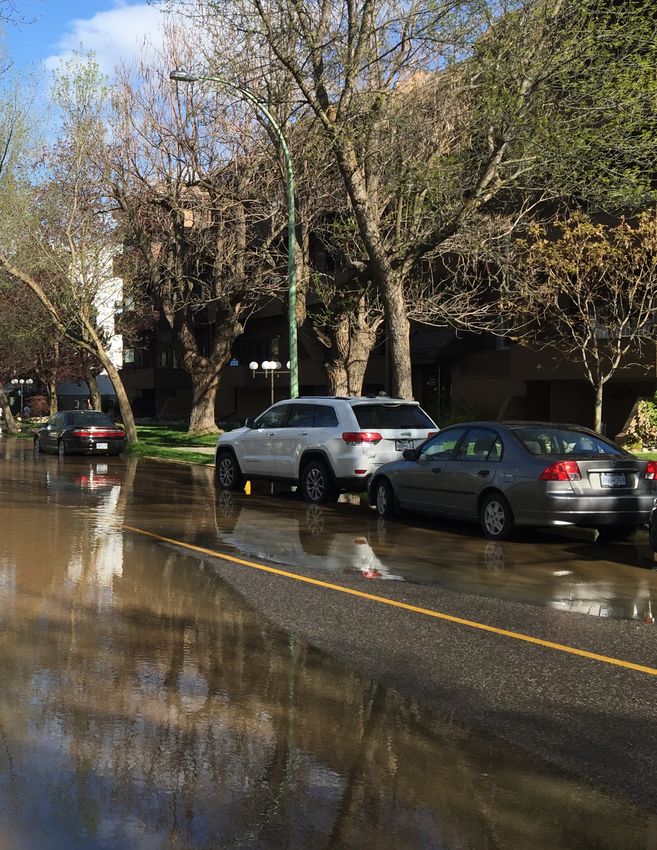
• In the North Okanagan (May of 2017), flooding on Kalamalka Lake and the Shuswap River had an impact on
residents and local infrastructure.
• Year-on-year flooding of Okanagan Lake and flash flood events along creeks and streams.
• T
he RDCO, RDNO, and RDOS experienced over 190 wildfires, burning 44,000 hectares of land combined, in
2018;2
• T
he spring freshet and wildfire season of 2018 activated the RDOS Emergency Operations Centre for 170 days and
engaged over 450 staff from across the Okanagan.
These events, and others like them, have caused the region to trigger emergency management
protocols more frequently. While some warming of the climate has brought opportunities, events
like those noted above often have devastating impacts on local ecosystems, residents, and
businesses, and cause ongoing emotional and financial stress.
Statistics Canada (2018). British Columbia Forest Fires, 2018.
2
Retrieved from https://www150.statcan.gc.ca/n1/pub/16-508-x/16-508-x2019002-eng.htm
10 |This section provides a brief overview of the types of impacts expected across
various sectors. It reflects regional discussions on climate change that took place in
each participating Regional District in September 2019, and is intended to continue a
dialogue among decision makers and community leaders to explore how to prepare
for the interrelated impacts facing the Okanagan.
Based on the outcomes of regional conversations held in autumn 2019, the impacts of climate
change were organized into the following nine categories:
• Ecosystems and Biodiversity • Recreation
• Health • Agriculture
• Water Quantity and Quality • Local Economy
• Transportation Infrastructure • Buildings, Land Use, and Energy Systems
• Stormwater Infrastructure
Ecosystems and Biodiversity
Context
The Okanagan is one of the most biologically diverse and ecologically significant regions in British
Columbia. The Okanagan region is home to ponderosa-pine and Douglas-fir ecosystems, low-lying
grasslands, semi-arid desert lands, and alpine highlands. This diversity brings with it a wide range of
flora and fauna, including many species at risk that need protection (e.g., the Great Basin Spadefoot,
the American Badger, and the ecological communities of antelope-brush and sagebrush steppe).
The Okanagan Basin consists of a series of snowmelt-fed freshwater lakes, which are part of the
Columbia River Basin. These natural assets provide connectivity and ecosystem services that are
essential to social, cultural, and economic systems in the valley.
Impacts
There is a strong concern that climate change will cause far-reaching damage to the ecosystems
that support plant, animal, and human life. As climate change occurs, ecosystems and species can
be expected to experience stress, resulting in changes to biological diversity. Reduced summer
precipitation, combined with warmer summer temperatures, will likely result in the depletion of
water resources, loss of wetlands, stress on local fisheries, and depletion of aquatic species.
Warmer temperatures and increased variability are likely to upset the timing of biological cycles and
strain sensitive habitat, leading to ecosystem shifts and the introduction of new species. Warmer
temperatures will also enhance the potential for invasive species, pests, and pathogens to increase
across the region, compromising the ability of native species to survive and triggering a loss of
biodiversity. Extreme events such as flooding, wildfires, and landslides are likely to compromise
natural landscapes, limit the function of natural assets, and reduce ecosystem connectivity. These
impacts describe a future that is markedly different from the past and underline the imperative for
action to reduce GHG emissions and prepare communities to adapt to the future climate.
Climate Projections for the Okanagan Region | 1112 |
Health
Context
The Okanagan has a growing population, including an active retiree demographic, and a growing population under the
age of 19. The population in the region is predominantly located in the valley bottoms, where flooding and heat stress
most commonly occur. These events will continue to challenge infrastructure and emergency response systems.

Impacts
The region has already been experiencing increased exposure to heat, which causes disproportionate health risks to
vulnerable populations, including children, seniors, those who are isolated, and those experiencing homelessness. Air
quality in the summers will become a major concern, and as smoke from wildfires increases, particulate matter and
warmer temperatures will lead to breathing problems, trigger asthma, reduce lung function, and increase the risk of lung
disease. Compromised air quality and extreme heat will impact the ability to spend time outside, and lead to increased
mental health issues. These impacts will cause additional stress on existing health facilities and resources, and without
additional resources, are likely to negatively affect the quality of healthcare in the region.
Individuals can be expected to experience increased anxiety and compromised mental health due to the shock of extreme
events, the loss of local food and cultural values, and other stresses related to the changing climate. Emergency responders
will also likely experience additional mental and physical stress as they work long hours for extended periods of time.
During winter months, fewer colder nights and an increase in daytime temperatures may reduce air quality impacts from
wood-burning stoves, and put less pressure on vulnerable populations seeking to avoid the cold during the winter months.
Recognizing the critical health impacts posed by climate change, now is the time to prepare communities and
emergency responders for the changes ahead. Citizens and institutions need to be educated on the impacts of climate
change, in order to develop climate literacy in the Okanagan region. Whenever possible, positive impacts should be
included in educational materials.

Water Quantity and Quality
Context
The Okanagan has the highest water consumption per capita in Canada, and water consumption continues to grow
as the population increases.3 There is a high demand for water use from intense agriculture and landscaping, and the
current level of water demand results in stress on the regional water supply.4
Within each Regional District, there are many large and small utilities providing water to users. Many water sources in the
Okanagan region are over-allocated, and with a changing climate, water conservation is the most sustainable approach to
handling water shortages, rather than through costly upgrades to storage and infrastructure.5

Impacts
Warmer winters will on average result in less snow accumulation on the valley uplands, reducing water availability and
increasing the need for water storage. Groundwater and aquifer recharge will also be compromised as drought conditions
increase, and soils become impermeable and less able to accept intense rainfall. This, along with spring flooding, may also
cause wastewater and stormwater infrastructure to fail, leading to reduced water quality and contamination of drinking
water. Flooding and water shortages are likely to decrease water quality and will likely trigger higher water restrictions and
water use conflicts, particularly in years where water demand increases to manage wildfire activity.
While water supply is decreasing, additional annual demand increases and competition for water use from users can be
expected. Allocation decisions will be required to meet domestic, agricultural, industrial, and ecosystem water needs and
additional resources to monitor and manage water supply will likely result in increasing water-related costs. Going forward,
agricultural stakeholders, major commercial water users, local governments, regional water regulators, and provincial
governments will need to engage in close dialogue to avoid undue stress from global and regional water shortages.

3
  https://www.obwb.ca/wsd/water-usage/residential-water-use
4
  https://www.obwb.ca/wsd/wp-content/uploads/2011/08/OBWB_Local_Government_Guide_OWSD_Project.pdf
5
  https://www.obwb.ca/newsite/wp-content/uploads/Okanagan_Sustainable_Water_Strategy_Action_Plan_2_0.pdf

                                                                                            Climate Projections for the Okanagan Region | 13
Transportation Infrastructure
Context
The Okanagan is a provincial transportation hub, home to the Kelowna International Airport,
and a series of major connecting highways. Traffic increases can be expected during the
summer tourism season, putting additional stress on the transportation network. Locally,
stressors to regional transportation are expected to grow as population increases over time.
While cycling infrastructure is increasing around urban areas, and along regional Rail Trails,
the Okanagan has the highest car ownership per capita in BC, in part due to the low-density
development, and minimal public transportation services in rural areas.6 Many communities
have limited access routes, causing added stress during transportation network disruptions
and emergencies.
Impacts
With warmer winter temperatures, highways will likely be safer for winter travel later into the
autumn and earlier in spring, increasing economic activity in the region. With precipitation
falling in more extreme events, increases in maximum flows are likely to overburden existing
drainage infrastructure, may threaten roads and bridges, and can be expected to cause
debris and water to pool on and near existing transportation infrastructure. These impacts
will cause interruptions to local commercial transportation and may result in a temporary
loss of transportation corridors. With limited egress routes for emergency evacuations,
access to hospitals during extreme events will become more challenging. Increased
precipitation and extreme heat will mean fewer people participating in active transportation.
In addition to ensuring transportation infrastructure can perform during future heat and
storm events, the region must also identify solutions to encourage the use of low-carbon
transportation (through technology and land use planning).
Stormwater Infrastructure
Context
To accommodate stormwater retention the majority of the Okanagan region relies on
natural assets (such as ditches, creeks, wetlands, and other natural features). This is
enhanced with hard infrastructure in more developed areas. Flooding and extreme
weather events of the past have illustrated that the regional stormwater system can be
overwhelmed during extreme events.
Impacts
Increases in storm intensity in the autumn and spring seasons are expected to put major
pressure on stormwater management and drainage systems across the Okanagan region.
Extreme precipitation and an increase in the intensity of rain events will likely overwhelm
drainage systems and cause streams to overflow, leading to fully saturated soils and
causing flooding along drainage systems, creeks, lakeshores, and low-lying areas. Flooding
may also cause wastewater infrastructure to fail, leading to reduced water quality and
contamination of regional waterways. These impacts can also affect slope stability, leading
to increased risk of landslides and road washouts. These impacts would cause damage
to private property and public infrastructure, as well as have negative impacts on drinking
water quality and aquatic ecosystems.
6
https://www.kelownacapnews.com/news/shocking-statistics-show-just-how-car-centric-kelowna-has-become
14 |Recreation
Context
The region has an active population, and is known locally and across the province as a
“four seasons” playground. Recreation occurs outdoors and on the natural landscape, is an
asset to community wellbeing and a key economic driver throughout the region.
Impacts
Increased wildfire and flooding events will reduce air and water quality, and will negatively
affect the ability for people to recreate outside. Reduced water quality could have a
negative impact on water recreation, and compromised air quality from wildfire smoke is
likely to result in less camping and cycling, and reduce the region’s ability to host major
sporting events, like the Oliver triathlon or the Penticton Ironman competition. Warmer
winter temperatures could have a negative impact on mountain-based recreation and
sporting events. Conversely, ski resorts may be able to take advantage of a longer summer
season with enhanced all-season recreation activities as residents and tourists seek the
cooler temperatures at higher elevations. Any changes in recreational activities will have
important impacts on economic activities and cultural practices in the region.
Agriculture
Context
Agriculture is a major contributor to the Okanagan’s economy and social heritage. It includes
a mix of crops, tree fruits, livestock, and processed products, as well as high value products
including organics, cider, wine, and beer. In addition to providing jobs across all three
Regional Districts, the agricultural sector creates opportunities to access locally grown foods
and products and enhances local food security.
In the northern areas of the Okanagan, forage, dairy, and cattle ranching are common,
while tree-fruit and grape production dominate the central and south areas. The majority of
BC’s tree fruit is produced here, and the recent expansion of late-season grape and cherry
farming is further enlarging the sector. Other products of note include sheep, goats, horses,
poultry, berries, nuts, and greenhouse production.7
Impacts
Warmer temperatures have already brought new economic activities to the Okanagan,
including an expanding agricultural sector. As the growing season extends and temperatures
continue to warm, the impacts of climate change will pose challenges to the agricultural
industry, including flooding and drought, increased instances of disease, heavy rain storms
during traditional harvest times, wind damage, and heat stress.8 In addition to exploring how
to protect the agricultural sector from these threats, a better understanding of the available
water supply, drought management, and the retention of healthy soils will be required to
capitalize on a longer growing season. The agricultural sector will also experience stress
as warmer winters and fewer frost days are likely to result in more invasive species being
introduced to. Ongoing dialogue between water purveyors, land use managers, and large
water users will be important to ensure the viability of the local agricultural sector and
protection of farmland over the coming decades.
7
https://www2.gov.bc.ca/gov/content/industry/agriculture-seafood/agricultural-regions/okanagan
8
https://sencanada.ca/content/sen/committee/421/AGFO/Briefs/2018-03-19_GlenLukas_e.pdfLocal Economy
Context
The region is currently the largest trading area between Metro Vancouver and Alberta, with a diverse economy, comprised
of agriculture, tourism, construction, retail trade, healthcare, manufacturing, and forestry. Key growth industries include
information and technology, film, aviation, and health care.
Impacts
Warmer temperatures have already brought new economic activities to the Okanagan, including a growing agricultural sector
and increased tourism.9 With warmer winters, over time, many travellers may opt to stay local and spend their recreation dollars
at home, further enhancing the local economy. The Okanagan region can expect a decrease in winter ski and snow sports due to
warmer winters, and a transition to a summer mountain tourism regime.
Warmer summers with dry conditions will also bring more severe wildfires, compromising air quality and reducing tourism in the
Okanagan in heavy smoke years. Flooding caused by extreme rain in the shoulder seasons will compromise the quality of soils,
overburden transportation and stormwater management infrastructure, and reduce water quality in the region’s lakes, further
limiting the tourism sector.
The forestry sector will likely continue to experience stress as warmer winters and fewer frost days will result in more invasive
species being introduced to the region. This will impact timber supply and result in additional job losses in the forestry sector.
The changes described above will have impacts on business development and attraction and retention, in addition to causing
fluctuations and uncertainty in the real estate market. Supporting local industries and identifying opportunities to adapt to these
changes will help to secure a healthy, resilient economy.
Buildings and Energy Systems
Context
Energy in the Okanagan region is provided by BC Hydro (electricity), FortisBC (electricity and natural gas), and municipally owned
electric utilities. In rural areas where gas is not available, energy for heating is provided by electric or wood heating systems.
In many areas, the rising cost of air conditioning is becoming an issue. BC Hydro is currently upgrading their transmission line
servicing West Kelowna, as the existing single line currently runs through rough terrain that is susceptible to the increasing threat
of wildfires and landslides, and in an effort to prepare for ongoing increasing energy demand related to summer cooling.
The Okanagan building stock is largely older commercial and institutional buildings, and single-family homes in suburban
neighbourhoods and rural areas. Many of these buildings were designed when energy costs were low, and winters were
reliably cooler. The majority of the building stock performs below ideal energy efficiency standards.10
As new families move to the region from other parts of BC and Canada, development pressures are increasing in urban centres,
rural areas, and on agricultural land. A growing construction sector brings with it opportunities to invest in high quality, resilient
buildings. Buildings designed to perform well in future climate will mean improved occupant health and long-term cost savings.
Impacts
Warmer temperatures year-round will reduce heating demand in the winter months, and could lead to summer cooling
demand outpacing winter heating demand in the coming decades.11 This will result in shifting energy costs, and increased
peak energy requirements during the summer months. In valley bottoms that currently experience the warmest temperatures,
the inefficient building stock will likely lead to increased energy use for cooling, high costs during heat waves for those with
cooling, and increased risks to vulnerable people who do not have access to cooling during heat waves.12
Future heavy rains are likely to cause an increase in storm and flood damage to homes, and when combined with additional
energy costs, will likely cause economic stress to property owners. While current buildings are not well prepared to address
current or future climate-related challenges, new buildings are also not being designed to perform efficiently in the future
climate, further limiting the ability of residents to buffer themselves from increasing heat waves, compromised air quality,
and expected water shortages.13 This issue, along with the preservation of agricultural lands and natural areas, is sure to be
exacerbated as development pressures increase to accommodate more in-migration.
9
https://www.investkelowna.com/about-the-okanagan/business/industries/
10
https://www2.gov.bc.ca/gov/content/industry/construction-industry/building-codes-standards/energy-efficiency/energy-step-code
11
https://adaptationcanada2016.ca/wp-content/uploads/2016/04/W4A-Wilson.pdf
12, 13
https://www.bchousing.org/publications/BC-Energy-Step-Code-Guide-Supplemental.pdf
16 |Chapter 3
Summer
Temperature
Indicators
Climate Projections for the Okanagan Region | 17Chapter 3
Summer Temperature Indicators
Summer temperatures are expected to warm considerably over time, indicating that new climate
conditions in summer will be unlike temperatures historically experienced in the Okanagan. This
section further describes changes in summer temperature, and provides descriptions of the
indicators and values relating to future average and extreme summer temperatures.
Days Above 30°C
About this Indicator
Days above 30°C indicates how many days reach temperatures over 30°C in any one year. This
indicator of extreme heat is important t o public health as temperatures at or near 30°C can cause
heat stress in vulnerable populations.14
Projections
• In the past, the Okanagan region (the total area inside all three Regional District boundaries) experienced just
under a week per year, on average, of days above 30°C. By the 2050s, the region can expect an average of over
three weeks above 30°C per year and over five weeks per year by the 2080s. This marks a considerable change
from the past.
• T
he valley bottoms are projected to experience the greatest changes, with approximately 50 additional days
above 30°C projected by the 2080s, compared to the past.
• In the valley bottoms, which experienced many more days above 30°C in the past than the region as a whole, will
more than double by the 2050s, and almost triple by the 2080s.
TABLE 1: CHANGE IN SUMMER DAYS ABOVE 30°C
2050s Change (Days) 2080s Change (Days)
Past Days
Average (Range) Average (Range)
Whole Regional District 6 16 (9 to 25) 31 (15 to 52)
RDNO
Valley Bottom Only 27 32 (17 to 47) 52 (31 to 75)
Whole Regional District 7 18 (10 to 29) 35 (19 to 57)
RDCO
Valley Bottom Only 24 32 (19 to 48) 54 (32 to 78)
Whole Regional District 5 14 (7 to 23) 29 (16 to 47)
RDOS
Valley Bottom Only 28 33 (19 to 47) 54 (33 to 76)
TABLE NOTES
Past refers to the time period from 1971 to 2000.
2050 Change refers to the projected increase in days by the 2050s from the past baseline.
2080 Change refers to the projected increase in days by the 2080s from the past baseline.
14
Note that the Hot Design Temperature indicator (BCBC 97.5) can be found in the appendix.
18 |FIGURE 3: DAYS ABOVE 30°C – PAST
FIGURE 4: DAYS ABOVE 30°C – FUTURE (2050s)
Climate Projections for the Okanagan Region | 19Hottest Days
About this Indicator
Hottest days refers to the hottest daytime high temperature of the season (or year). This measure illustrates how
extreme temperature changes are projected to unfold over time.
Projections
• In the past, the hottest summer day in the Okanagan region was about 30°C. By the 2050s, hottest day temperatures are expected to
increase by 4.5°C, and by over 7°C by the 2080s.
• T
he average past hottest day temperature in the valley bottoms was approximately 36°C. These temperatures are also expected to warm
by 4.5 degrees by the 2050s, and 7 degrees by the 2080s, resulting in temperatures over 43°C in the populated areas of the Okanagan
region by the end of the century.
• S
pring temperatures across the Okanagan region are also projected to warm, though the magnitude of the change is smaller than
Summer. By the 2050s, the hottest spring day is projected to increase by 3.0°C to 25.7°C, and by 4.7°C to 27.4°C by the 2080s.
• In the future, the annual hottest daytime highs will be as warm as extreme 1-in-20 hottest day temperatures of the past. This is a
remarkable change in that what was once a rare extreme heat event will become commonplace.
TABLE 2: CHANGE IN HOTTEST DAY
2050s Change (ºC) 2080s Change (ºC)
Past (ºC)
Average (Range) Average (Range)
Whole Regional District 22.6 3.1 (2 to 4) 4.9 (3 to 7)
Spring
Valley Bottom Only 28.5 3.0 (2 to 4) 4.8 (3 to 7)
RDNO
Whole Regional District 29.9 4.5 (3 to 6) 7.3 (5 to 9)
Summer
Valley Bottom Only 35.9 4.5 (3 to 6) 7.2 (5 to 9)
Whole Regional District 23.9 3.0 (3 to 4) 4.7 (3 to 6)
Spring
Valley Bottom Only 28.3 2.9 (2 to 4) 4.6 (3 to 6)
RDCO
Whole Regional District 30.7 4.5 (2 to 6) 7.1 (5 to 9)
Summer
Valley Bottom Only 35.3 4.4 (2 to 6) 7.1 (5 to 9)
Whole Regional District 22.5 2.8 (2 to 4) 4.6 (3 to 6)
Spring
Valley Bottom Only 29.1 2.8 (2 to 4) 4.5 (3 to 6)
RDOS
Whole Regional District 29.4 4.4 (3 to 6) 7.0 (5 to 9)
Summer
Valley Bottom Only 35.8 4.4 (2 to 6) 7.0 (5 to 9)
TABLE NOTES
Past refers to the time period from 1971 to 2000.
2050 Change refers to the projected increase in temperature (in °C) by the 2050s from the past baseline.
2080 Change refers to the projected increase in temperature (in °C) by the 2080s from the past baseline.
20 |1-in-20 Hottest Day
About this Indicator
1-in-20 hottest day refers to a day so hot that it has only a 1-in-20 chance of occurring in a given year. That is, there is a 5%
chance in any year that a daytime high temperature could reach this threshold. This indicator illustrates what extreme heat
events will feel like over time, and will be useful to understand impacts related to ecosystems, health, agriculture, and forestry.
Projections
• T
he past 1-in-20 hottest day in the Okanagan region was 32.8°C. By the 2050s, the region can expect this to increase to 37.8°C, and to
40.1°C by the 2080s.
• In the valley bottoms, the temperatures are projected to be even hotter. The past 1-in-20 hottest day in the north was 38.9°C. By the 2050s, this
is expected to increase by 5.1°C to 44°C, and by 7.3°C to 46.2°C by the 2080s. This trend is similar across all Regional Districts. These changes
mark a significant departure from historical temperatures in the Okanagan region.
TABLE 3: 1-IN-20 HOTTEST DAY
2050s Change (ºC) 2080s Change (ºC)
Past (ºC)
Average (Range) Average (Range)
Whole Regional District 33.1 5.2 (2 to 6) 7.5 (5 to 9)
RDNO
Valley Bottom Only 38.9 5.1 (2 to 7) 7.3 (4 to 9)
Whole Regional District 33.7 5.0 (3 to 7) 7.3 (4 to 9)
RDCO
Valley Bottom Only 38.2 4.9 (3 to 7) 7.2 (4 to 9)
Whole Regional District 32.4 4.8 (3 to 6) 7.2 (5 to 9)
RDOS
Valley Bottom Only 38.4 4.9 (3 to 7) 7.2 (4 to 9)
TABLE NOTES
Past refers to the time period from 1971 to 2000.
2050 Change refers to the projected increase in temperature (in °C) by the 2050s from the past baseline.
2080 Change refers to the projected increase in temperature (in °C) by the 2080s from the past baseline.
Note: Climate projections for two additional hot temperature indicators (Days Above 25°C and Hot Design
Temperature—TX 97.5/BCBC97.5) can be found in the Additional Indicators Appendix.
Growing Season Length
About this Indicator
Growing season length is an annual measure that counts the number of days between the first span of at least 6 days
with a daily average temperature greater than 5°C and the first span after July 1 of 6 days with temperature less than 5°C.
It indicates the length of the growing season for typical plants or crops. This measure helps to inform an understanding
of agricultural opportunities and challenges made available by warmer temperatures.15
Projections
• In the past, the Okanagan region experienced an average of about 170 days in the growing season.
• Across the Okanagan region, growing season length is projected to increase by over a month by the 2050s and over two months by the 2080s.
• V
alley bottoms are projected to experience a longer growing season than the region as a whole. Central and south valley bottoms can
expect a growing season of over ten months by the 2080s.
15
Change in Growing Degree Days is available in the Additional Indicators Appendix.
Climate Projections for the Okanagan Region | 21TABLE 4: CHANGE IN GROWING SEASON LENGTH
2050s Change (Days) 2080s Change (Days)
Past (Days)
Average (Range) Average (Range)
Whole Regional District 167 36 (23 to 49) 62 (47 to 76)
RDNO
Valley Bottom Only 227 39 (28 to 54) 72 (54 to 85)
Whole Regional District 180 39 (26 to 54) 67 (50 to 80)
RDCO
Valley Bottom Only 237 44 (31 to 61) 78 (60 to 93)
Whole Regional District 163 41 (28 to 54) 69 (50 to 86)
RDOS
Valley Bottom Only 243 44 (29 to 55) 73 (56 to 91)
TABLE NOTES
Past refers to the time period from 1971 to 2000.
2050 Change refers to the projected increase in the days of growing season by the 2050s from the past baseline.
2080 Change refers to the projected increase in the days of growing season by the 2080s from the past baseline.
Cooling Degree Days
About this Indicator
Cooling degree days refers to the number of degrees that a day’s average temperature is above 18°C. To determine the
number of cooling degree days in a month, the number of degrees that the daily temperature is over 18°C for each day would
be added to give a total value. This measure is used to estimate the use of air conditioning to cool buildings and homes.
Projections
• H
istorically, there has been moderate demand for cooling in this region by this measure (an average of about 50 cooling degree
days). Valley bottoms in all Regional Districts have experienced significantly more cooling degree days than in the past, over three
times the regional average.
• The Okanagan can expect an increase of 144 more cooling degree days by the 2050s, and 312 more by the 2080s.
• V
alley bottoms are projected to experience nearly double the regional average cooling degree days in the future. As this is a measure of
cooling demand, these increases indicate that significantly more energy will be required to cool homes and buildings in the future.
TABLE 5: CHANGE IN COOLING DEGREE DAYS
Past 2050s Change (Degree Days) 2080s Change (Degree Days)
(Degree Days) Average (Range) Average (Range)
Whole Regional District 48 150 (60 to 265) 325 (136 to 538)
RDNO
Valley Bottom Only 216 342 (168 to 547) 635 (339 to 951)
Whole Regional District 67 176 (72 to 298) 368 (163 to 592)
RDCO
Valley Bottom Only 230 354 (173 to 565) 655 (354 to 977)
Whole Regional District 42 130 (55 to 224) 285 (118 to 468)
RDOS
Valley Bottom Only 243 360 (174 to 573) 664 (363 to 984)
TABLE NOTES
Past refers to the time period from 1971 to 2000.
2050 Change refers to the projected increase in cooling degree days by the 2050s from the past baseline.
2080 Change refers to the projected increase in cooling degree days by the 2080s from the past baseline.
Actual change is recorded (not percent change) due to low baseline values.
22 |Chapter 4
Winter
Temperature
Indicators
Climate Projections for the Okanagan Region | 23Chapter 4
Winter Temperature Indicators
Future climate projections indicate that the Okanagan can expect to see warmer winter months.
By the 2080s, January temperatures will feel more like mid to late autumn temperatures
of the past, with warmer nights, and fewer frost days. These indicators are useful when trying
to determine how ecological systems, and associated economic and cultural activities, can be
expected to change over time.
Average Spring Nighttime Low Temperatures
About this Indicator
Average spring nighttime low temperatures are averaged over the season and illustrated in the
tables and plots below.
Projections
• A
verage past spring nighttime lows were -1.6°C in the Okanagan. Spring nighttime lows are projected to increase
by 3°C by the 2050s, and by 5°C by the 2080s. This is similar across all Regional Districts and valley bottoms.
TABLE 6: CHANGE IN AVERAGE SPRING NIGHTTIME LOW
2050s Change (ºC) 2080s Change (ºC)
Past (ºC)
Average (Range) Average (Range)
Whole Regional District -1.6 3.1 (2 to 4) 5.1 (4 to 6)
RDNO
Valley Bottom Only 3.0 3.1 (2 to 4) 5.1 (4 to 6)
Whole Regional District -0.7 3.1 (2 to 4) 5.0 (4 to 6)
RDCO
Valley Bottom Only 3.6 3.1 (2 to 4) 5.0 (4 to 6)
Whole Regional District -1.9 3.0 (2 to 4) 4.9 (4 to 6)
RDOS
Valley Bottom Only 3.5 3.0 (2 to 4) 4.9 (4 to 6)
TABLE NOTES
Past refers to the time period from 1971 to 2000.
2050 Change refers to the projected increase in temperature (°C) by the 2050s from the past baseline.
2080 Change refers to the projected increase in temperature (°C) by the 2080s from the past baseline.
24 |FIGURE 5: SPRING NIGHTTIME LOWS – PAST
FIGURE 6: SPRING NIGHTTIME LOWS – FUTURE (2050s)
Climate Projections for the Okanagan Region | 25Coldest Night
About this Indicator
Coldest night refers to the coldest nighttime low temperature of the year (or in a particular season), on average. This
measure illustrates how extreme temperature changes are projected to unfold over time.
Projections:
• In the past, the coldest winter night for the Okanagan region was about -25°C. By the 2050s, the coldest night is expected to warm by
6°C to -19°C, and by the 2080s, temperatures are projected to warm by 10°C to -15°C. While the coldest night is projected to warm in all
seasons, the coldest night in winter is projected to warm more rapidly than other seasons.
• V
alley bottoms follow a similar trend, though historically coldest winter nights have been approximately 3°C to 5°C warmer than the
Regional District average.
TABLE 7: CHANGE IN COLDEST NIGHTS
2050s Change (ºC) 2080s Change (ºC)
Past (ºC)
Average (Range) Average (Range)
Whole Regional District -25.4 5.9 (3 to 9) 10.1 (8 to 14)
Winter
Valley Bottom Only -21.9 6.0 (4 to 9) 10.3 (8 to 14)
RDNO
Whole Regional District -16.0 5.5 (4 to 7) 8.1 (6 to 10)
Autumn
Valley Bottom Only -11.7 5.5 (4 to 7) 8.1 (6 to 10)
Whole Regional District -24.6 6.1 (4 to 10) 10.3 (8 to 15)
Winter
Valley Bottom Only -18.8 6.1 (4 to 10) 10.3 (8 to 15)
RDCO
Whole Regional District -15.8 5.4 (4 to 7) 8.0 (6 to 10)
Autumn
Valley Bottom Only -10.1 5.2 (4 to 6) 7.8 (6 to 9)
Whole Regional District -24.5 6.1 (4 to 10) 10.3 (8 to 14)
Winter
Valley Bottom Only -18.9 6.1 (4 to 10) 10.3 (9 to 15)
RDOS
Whole Regional District -16.5 5.0 (3 to 6) 7.4 (5 to 9)
Autumn
Valley Bottom Only -10.6 5.1 (4 to 7) 7.6 (5 to 9)
TABLE NOTES
Past refers to the time period from 1971 to 2000.
2050 Change refers to the projected increase in temperature (°C) by the 2050s from the past baseline.
2080 Change refers to the projected increase in temperature (°C) by the 2080s from the past baseline.
Frost Days
About this Indicator
Frost days is an annual count of days when the daily minimum temperature is less than 0°C, which may result in frost on
the ground. This indicator is helpful to understand changes and impacts on agriculture and ecosystems, as it indicates
how often temperatures below freezing occur.16
Projections
• In the past, the region experienced on average about six months of frost days, annually. The region is expected to experience 28% fewer frost
days by the 2050s, and about half as many as in the past by the 2080s. This trend is similar across all three Regional Districts.
• V
alley bottoms have historically experienced fewer frost days. In the past, the South Okanagan’s valley bottom has experienced 96 frost
days, annually. This is less than the other Regional Districts. By the 2050s, frost days in the South Okanagan are expected to decline by 49%,
and by 71% by the 2080s.
• Fewer frost days have implications for invasive species, agriculture, and streamflow.
16
Freezing degree days is available in the Additional Indicators Appendix.
26 |You can also read