Air Quality Monitoring Plan for the Greater Sydney Region 2021-25 - DEPARTMENT OF PLANNING, INDUSTRY & ENVIRONMENT
←
→
Page content transcription
If your browser does not render page correctly, please read the page content below
DEPARTMENT OF PLANNING, INDUSTRY & ENVIRONMENT

Air Quality
Monitoring Plan for
the Greater Sydney
Region 2021–25

environment.nsw.gov.au

© 2021 State of NSW and Department of Planning, Industry and Environment
With the exception of photographs, the State of NSW and Department of Planning, Industry
and Environment are pleased to allow this material to be reproduced in whole or in part for
educational and non-commercial use, provided the meaning is unchanged and its source,
publisher and authorship are acknowledged. Specific permission is required for the
reproduction of photographs.
The Department of Planning, Industry and Environment (DPIE) has compiled this report in
good faith, exercising all due care and attention. No representation is made about the
accuracy, completeness or suitability of the information in this publication for any particular
purpose. DPIE shall not be liable for any damage which may occur to any person or
organisation taking action or not on the basis of this publication. Readers should seek
appropriate advice when applying the information to their specific needs.
All content in this publication is owned by DPIE and is protected by Crown Copyright, unless
credited otherwise. It is licensed under the Creative Commons Attribution 4.0 International
(CC BY 4.0), subject to the exemptions contained in the licence. The legal code for the
licence is available at Creative Commons.
DPIE asserts the right to be attributed as author of the original material in the following
manner: © State of New South Wales and Department of Planning, Industry and
Environment 2021.
Cover photo: Meadowbank, Sydney, NSW. Don Fuchs/DPIE

Published by:
Environment, Energy and Science
Department of Planning, Industry and Environment
Locked Bag 5022, Parramatta NSW 2124
Phone: +61 2 9995 5000 (switchboard)
Phone: 1300 361 967 (Environment, Energy and Science enquiries)
TTY users: phone 133 677, then ask for 1300 361 967
Speak and listen users: phone 1300 555 727, then ask for 1300 361 967
Email: info@environment.nsw.gov.au
Website: www.environment.nsw.gov.au
Report pollution and environmental incidents
Environment Line: 131 555 (NSW only) or info@environment.nsw.gov.au
See also www.environment.nsw.gov.au
ISBN 978-1-922493-81-1
EES 2021/0146
First published in December 2020; reprinted April 2021 with amendments.

Find out more about your environment at:

www.environment.nsw.gov.au
Contents
1.   About this document                                                     1
     1.1    Purpose                                                           1
     1.2    Target audiences                                                  1
     1.3    Plan update and review                                            2
2.   Recommended air quality monitoring plan for the Greater Sydney
     Region                                                         2
     2.1    Region definition                                                 3
     2.2    Regional monitoring plan 2021–25                                  4
     2.3    Changes since the 2001 monitoring plan                            6
3.   Key factors analysis                                                    8
     3.1    Geographic extent and boundary                                    8
     3.2    Population                                                        8
     3.3    Terrain                                                          10
     3.4    Regional climate and meteorology                                 11
     3.5    Emission sources                                                 16
     3.6    Historical air quality monitoring in the Greater Sydney Region   17
     3.7    Community engagement                                             19
     3.8    Overall analysis                                                 20
4.   Further information                                                     21
     Recent air quality studies for the Greater Sydney Region                21
5.   References                                                              24

                                         iii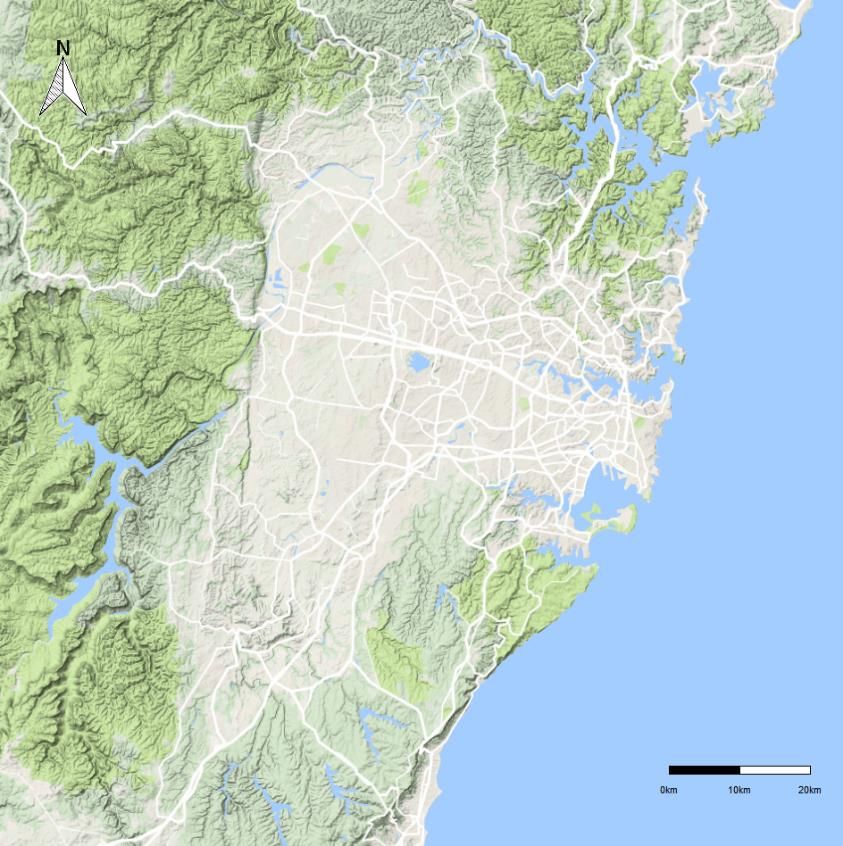
List of tables
Table 1    Monitoring plan updates and reviews                               2
Table 2    Monitoring stations in the Greater Sydney Region (by subregion)   5
Table 3    Reporting plan 2021–25                                            6
Table 4    Stations required according to population                         10
Table 5    Top three emission activities contributing to PM2.5, PM10, SO2, NOx
           and CO emissions in 2013 in the Greater Sydney Region            17

List of figures
Figure 1   Air quality monitoring in the Greater Sydney Region (as of 1 January
           2021)                                                              3
Figure 2   Population density in the Greater Sydney Region                   9
Figure 3   Topography of the Greater Sydney Region                           11
Figure 4   Summer wind roses for Sydney                                      13
Figure 5   Autumn wind roses for Sydney3                                     14
Figure 6   Winter wind roses for Sydney3                                     15
Figure 7   Spring wind roses for   Sydney3                                   16

                                      iv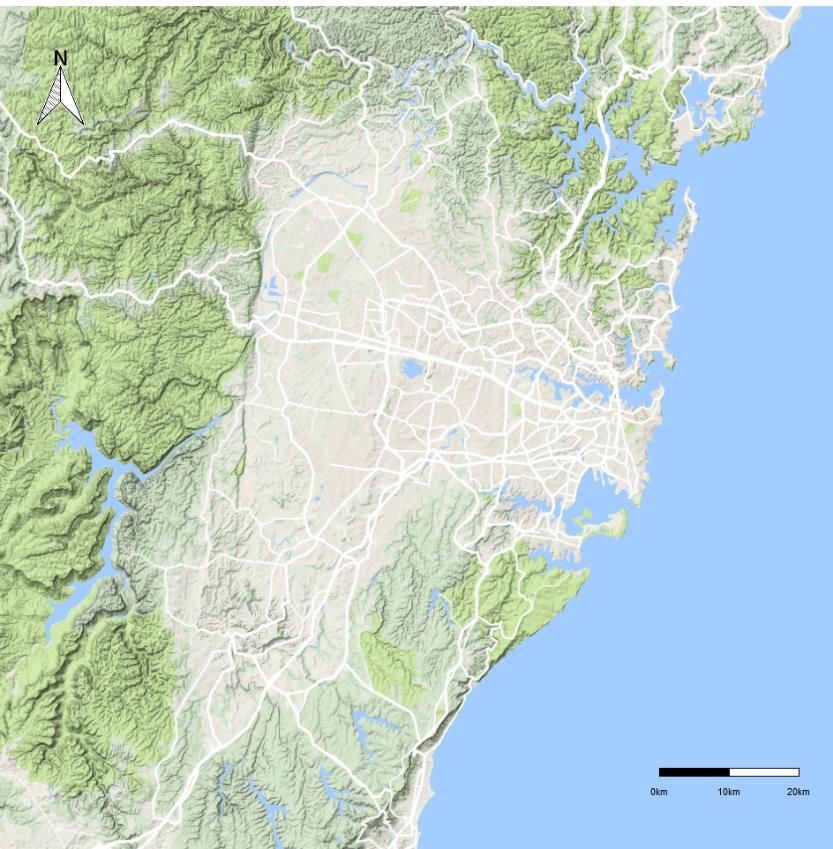
Air Quality Monitoring Plan for the Greater Sydney Region 2021–25

1. About this document
1.1 Purpose
The purpose of this document is to explain how the NSW Government intends to monitor
ambient air quality in the Greater Sydney Region during the next five-year period: 2021 to
2025.
This air quality monitoring plan meets the requirement of National Environment Protection
(Ambient Air Quality) Measure (AAQ NEPM), Part 4 Section 10, that each jurisdiction must
have a plan setting how it proposes to monitor air quality for the purposes of this measure.

1.2 Target audiences

Concerned citizens and advocates
This document is for those who wish to learn about the methods and systems used to
monitor air quality in their region so they can take informed action to reduce pollutants and
populations’ exposure to them. They can learn how certain types of pollutants, landforms
and weather patterns might result in higher localised air pollution, and how nearby activities
such as industry and traffic may affect amenity, and public and environmental health.

Industry
For businesses with activities subject to air quality regulation and licensing, this document
explains how the NSW Government uses industry monitoring as part of an integrated and
rigorous air quality monitoring system. Monitoring helps local industry understand the
community’s concerns.

NSW Government policymakers
This information can help Ministers and senior public servants to assess the adequacy of
monitoring and pollution control for managing public health. Monitoring helps policymakers
allocate and prioritise resources for air quality, and make decisions about the adequacy of
policies, programs and regulations to manage air pollution.

National Environment Protection Council
This regional plan describes monitoring in the Greater Sydney Region for the National
Environment Protection (Ambient Air Quality) Measure (AAQ NEPM).

                                                  1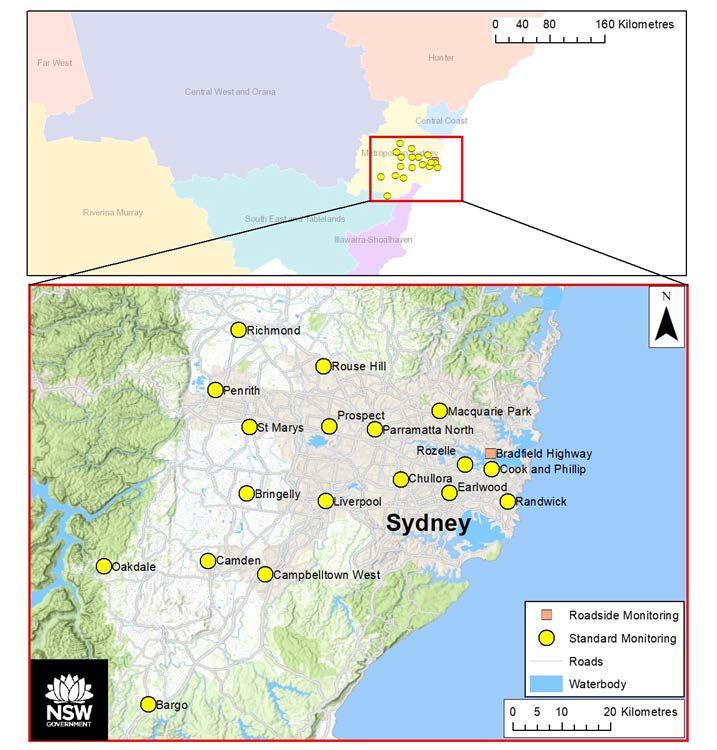
Air Quality Monitoring Plan for the Greater Sydney Region 2021–25

1.3 Plan update and review
This monitoring plan will be updated annually and reviewed every five years.

Table 1         Monitoring plan updates and reviews

 Version        Release date       Purpose
 Version 1.0    2001               Initial monitoring plan required under NEPM 1998.
 (original
 plan)
 Major          2018               To evaluate how well NSW is meeting the AAQ NEPM
 periodic                          requirements, what is monitored for non-NEPM purposes, and
 reviews                           where available resources could best be deployed to gather
 2017–18                           required and additional information about air quality.
                                   The reviews identified extra monitoring requirements due to
                                   growing populations, new sources of air pollution, new
                                   technologies and specific community concerns.
 Version 2.0    December 2020      Major plan update based on the 2017–18 major periodic
                                   reviews.
 Version 2.01   April 2021         Minor corrections
 Version 2.1    December 2021      Next scheduled annual update.
 Version 3.0    December 2025      Next scheduled five-year review.

2. Recommended air quality monitoring plan
   for the Greater Sydney Region
Air quality is monitored to assess if the air we breathe poses a risk to human health.
Monitoring information provides evidence to the public, health professionals and
policymakers when choosing short-term and long-term actions to reduce harm. Risk of harm
is a function of the number of people exposed (population), and the level of exposure –
pollutant types, concentrations, and durations.

                                                  2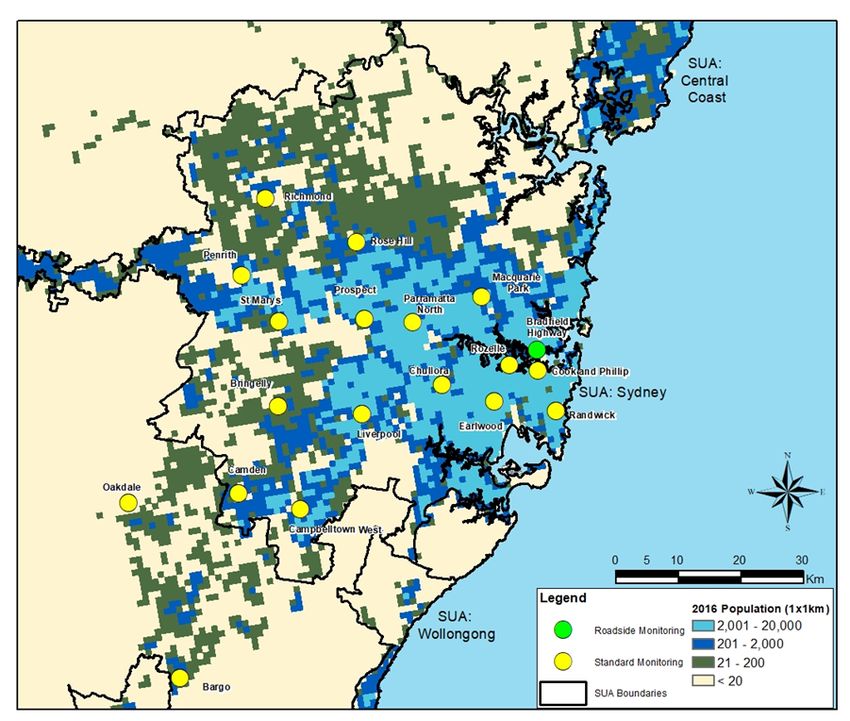
Air Quality Monitoring Plan for the Greater Sydney Region 2021–25

2.1 Region definition

Figure 1      Air quality monitoring in the Greater Sydney Region (as of 1 January 2021)
              The top insert shows the Greater Sydney planning region (yellow).

This plan is presented by air quality monitoring region, based on NSW strategic planning
regions, an administrative boundary determined by the Department of Planning, Industry and
Environment, broadly in line with population centres and human land-uses. Human activities
(such as burning fossil fuels for energy and transport) and land-use patterns (such as
population density, travel patterns, location of polluting industries and their proximity to
vulnerable types of people such as children, and urban heat-island effect) influence air
quality and its effect on the population.
The Sydney significant urban area (SUA), as defined in 2016 by the Australian Bureau of
Statistics (ABS) covers the major populated parts of Sydney, as well as extending to
Katoomba in the Blue Mountains. The areas to the south-west of the SUA, such as Bargo
and Oakdale, are retained within the Greater Sydney air quality region. These areas are
included in the Greater Sydney planning region.
For National Environment Protection Measure (NEPM) compliance reporting, the Greater
Sydney Region is reported as a single region. However, air quality subregions are used for
other reporting purposes. These include live public reporting of air quality data, air quality
alerts, and air quality analysis. These subregions are useful given the large geographic area,
significant population size and existing knowledge on air quality and pollutant dispersion and
sources within Sydney.

                                                  3
Air Quality Monitoring Plan for the Greater Sydney Region 2021–25
Air quality monitoring in the Greater Sydney Region includes the following air quality
subregions, based on the Greater Sydney planning subregions:
• Central West Sydney (based on Central River City)
• East Sydney (based on Eastern Harbour City)
• North West Sydney (based on the northern part of Western Parkland City)
• South West Sydney (based on the southern part of Western Parkland City).
These subregions have been updated compared with those used before 2020. The changes
include:
• A new subregion has been created: Central West Sydney. This region was created by
splitting sites near the geographic centre of Sydney and those in Parramatta from other
sites in the former Sydney North West region. The new North West Sydney region
includes sites in the outer reaches of North West Sydney.
• Lidcombe and Chullora sites have been moved from the previous Sydney East region to
the Central West Sydney region.
• South West Sydney corresponds directly to the previous Sydney South West region.
Underlying atmospheric and pollution analysis is based on natural boundaries, mainly
airshed, which is a function of terrain and climate. Smoke, dust and gaseous chemical
pollutants are moved by thermal currents and blown by the wind. Natural convection causes
hot air to rise, taking pollution with it. Landscape features, such as hills and valleys, are
natural barriers that limit the dispersal of pollutants and can result in pollution pools with
higher pollution concentrations. Winds and air movement patterns often follow a diurnal and
seasonal pattern – for example, sea breezes in the afternoon. Changes to the climate mean
historically typical meteorological patterns might change in future.
2.2 Regional monitoring plan 2021–25
AAQ NEPM compliance statement
The region requires between eight and 10 stations based on population considerations.
For NEPM compliance, the plan for 2021–25 sets 17 current sites for ozone, nitrogen
dioxide, particles as PM2.5 and particles as PM10. Nine stations monitor carbon monoxide,
and 12 stations are set to monitor sulfur dioxide.
Cook and Phillip and Penrith will be assessed in future years, and added for NEPM
compliance reporting if appropriate.
Lidcombe station will replace the nearby Chullora trend station in 2021, as the latter will be
decommissioned. Both stations will be maintained for a short period of time to determine if
pollutant measurements are comparable.
Monitoring outside NEPM compliance purposes
The Bradfield Highway roadside monitoring station will continue to measure peak air quality
levels experienced on a busy road to assess general fleet emissions.
4Air Quality Monitoring Plan for the Greater Sydney Region 2021–25
Table 2 Monitoring stations in the Greater Sydney Region (by subregion)
Station Station Year O3§ NOx§ PM10 PM2.5* Vis§ CO SO2 Met§
type† est.
East Sydney
Bradfield Highway R 2018 (2018)
Cook and Phillip C 2019 (2019)
Earlwood T 1978 (2012)
Macquarie Park P 2017 (2017)
Randwick T 1995 (2017)
Rozelle T 1970 (2015)
Central West Sydney
Chullora T 2002 (2012)
Lidcombe T 2020 (2020)
Parramatta North P 2017 (2017)
Prospect T 2007 (2015)
Rouse Hill P 2019 (2019)
North West Sydney
Penrith T 2020 (2020)
Richmond T 1992 (2012)
St Marys T 1992 (2016)
South West Sydney
Bargo T 1996 (2016)
Bringelly T 1992 (2016)
Campbelltown P 2012 (2015)
West
Camden P 2012 (2012)
Liverpool T 1988 (2012)
Oakdale T 1996 (2016)
* Denotes the year in which beta attenuation monitors (BAM) were installed at monitoring sites to measure
PM2.5. Note some stations measured PM2.5 before this year using tapered element oscillating microbalance
(TEOM) method.
§ O3 = Ozone; NOx = oxides of nitrogen which includes nitrogen dioxide (NO2); Vis = visibility as measured
by nephelometer; Met = meteorology (such as wind, temperature).
† P = performance station (NEPM compliant); T = trend station (NEPM compliant); R = roadside (source)
station (non-NEPM compliance reporting); C = campaign monitoring (to become assessed for NEPM
compliance).
Planned monitoring technologies
The current monitoring technologies, including instrumentation for each pollutant, are
described in ‘Schedule 2: Register of NSW monitoring stations’ of NSW Air Quality
Monitoring Plan – Methods for creating plans (DPIE 2020), and this information is also
accessible on the Sharing and Enabling of Environmental Data in NSW (SEED) portal. This
schedule is updated regularly by the Department’s Climate and Atmospheric Science
Branch.
5Air Quality Monitoring Plan for the Greater Sydney Region 2021–25
Planned reporting of air quality monitoring results
Table 3 Reporting plan 2021–25
Report type Plan for 2021–25 Schedule
Current/live results Publish live air quality monitoring results for the region Website upgrade
by station and region on the Department’s website. Website improvements Part 1 November
are scheduled for release in 2020 and 2021. 2020
Website upgrade
Part 2 March 2021
Website upgrade
Part 3 July 2022
NSW annual Meet AAQ NEPM requirements to report annually on Second half of
compliance with compliance with the goals and standard. Publish an each calendar year
AAQ NEPM annual compliance report on the Department’s
website.
NSW annual air Report annually on air quality over the past year. Annually each
quality statement Publish an air quality statement on the Department’s January
website.
Special air quality Publish special air quality analysis reports of selected Quarterly when
report air pollution episodes and events on the Department’s applicable
website.
Inventory of pollution An inventory of pollution sources was published every To be determined
sources within the five years, but is now published as required.
GMR*
* GMR refers to the Greater Metropolitan Region, as defined for the NSW air emissions inventory. This
includes Greater Sydney, as well as Illawarra, Lower Hunter and Central Coast.
2.3 Changes since the 2001 monitoring plan
Key changes to monitoring stations since 2001
In general, changes made to the network have been documented in annual NEPM
compliance reports. A full list of stations is available on the Sharing and Enabling of
Environmental Data in NSW (SEED) portal. This schedule is updated regularly by the
Department’s Climate and Atmospheric Science Branch.
Significant changes have occurred in the network since the last published review. The total
number of monitoring stations has fluctuated between 13 and 20 stations since 2001, with
slightly fewer stations during 2005–16, although the exact pollutants monitored at some sites
have varied.
Major changes
• Stations referred to in the 2001 report that are now decommissioned include:
o a peak roadside monitoring station in the Central Business District (CBD), which
ceased operation in 2002 as leaded petrol was phased out
o Woolooware station, which ceased in 2004
o Kurrajong Heights station, which ran as a campaign monitoring site from 2000–03.
6Air Quality Monitoring Plan for the Greater Sydney Region 2021–25
• Several stations have been relocated, or are planned to be relocated, to new nearby
locations. These include:
o Blacktown – relocated to Prospect in 2007
o Vineyard – relocated to Rouse Hill in 2019
o Lidcombe – relocated to Chullora in 2003 (relocation back to a second location in
Lidcombe will occur in 2021)
o Macarthur – was planned in 2001, operated between 2004 and 2012, and relocated
to Campbelltown West in 2012
o industry monitoring at Campbelltown ceased in early 2004, with Macarthur and later
Campbelltown West monitoring in its place.
• Stations referred to in the 2001 report which were later decommissioned, but later re-
established as of January 2021:
o continual monitoring at Westmead ceased in 2004; it was re-established (as
Parramatta North station) at the same location in 2017
o industry monitoring at Camden ceased in 2004; it was re-established as permanent
monitoring at the same location in 2012.
• New stations which have been commissioned as of January 2021:
o Liverpool, which was to be replaced by Macarthur, has been retained in the network
continually since 2001
o roadside monitoring at Bradfield Highway in Milsons Point, commissioned in 2018,
represents a source site and will not be used in NEPM compliance reporting
o a Sydney CBD site was established at Cook and Phillip Park in 2019, and will be
assessed for NEPM compliance in future
o monitoring in Penrith was commissioned in 2020, given population growth in the
area.
Key changes to monitoring technologies since 2001
The AAQ NEPM legislation was updated in 2016, with monitoring of fine particles as PM2.5
now a mandated process. The high particle levels measured statewide during the bushfire
crisis in the 2019–20 summer season has reinforced the necessity and the health benefits of
measuring PM2.5 routinely at multiple locations, with live reporting of those results helping
people to actively manage their exposure.
The 2001 NSW Air Quality Monitoring Plan did not mention PM2.5 specifically. However, at
the time PM2.5 was undertaken at up to five stations within the Sydney region using tapered
element oscillating microbalance instruments (TEOM). This was based on available
instrumentation, and in the absence of available standard methods at the time, these were
run in accordance with United States Environmental Protection Agency (USEPA)
equivalence methods. Since 2012 these have been gradually replaced in New South Wales
with beta attenuation monitor (BAM) instruments. BAM instruments were further deployed
across the network to most locations between 2012 and 2017, given the importance of
measuring these smaller particles.
Since the introduction of unleaded petrol in Sydney in 1986, and the phasing out of leaded
petrol in 1993, lead levels in the Sydney region have declined. In 1998 the CBD peak
monitoring station recorded an annual average lead concentration that was 40% of the
NEPM standard of 0.5 micrograms per cubic metre (μg/m³). Lead levels subsequently
reduced to less than 10% of the national annual standard. Screening criteria were applied to
reduce the number of stations that monitor this pollutant (i.e. based on the maximum annual
average concentration being less than 65% of the NEPM standard for two to four years). As
a result, the Department phased out ambient lead monitoring for the AAQ NEPM during
7Air Quality Monitoring Plan for the Greater Sydney Region 2021–25
2004. The case for discontinuing lead monitoring was approved by the National Environment
Protection Council (NEPC).
3. Key factors analysis
This regional monitoring plan has been prepared by analysing the following key factors, as
defined in NSW Air Quality Monitoring Plan – Methods for creating plans.
3.1 Geographic extent and boundary
The Greater Sydney Region extends from Wollondilly Shire in the south to the northern
boundary of Broken Bay and the Hawkesbury River, and includes Richmond–Windsor and
the Blue Mountains in the west. The region and its population density are shown in Figure 2.
3.2 Population
Sydney lies in its own region with a population of around 4.45 million reported in ABS 2016
census data, the largest population in New South Wales.
The population has grown significantly since the first air quality monitoring plan was
prepared in 2001. The Department publishes NSW population and household projections.
The Population Projection forecasts that by 2026, the Greater Sydney population will have
grown to 5.75 million people, compared with 4.69 million people in 2016 (NSW Department
of Planning Industry and Environment, 2019).
The forecast population using the planning region includes the entire Sydney SUA (as
defined by ABS), as well as small population centres outside this region, specifically in the
Wollondilly, Hawkesbury and Blue Mountains local government areas (LGAs).
8Air Quality Monitoring Plan for the Greater Sydney Region 2021–25
Figure 2 Population density in the Greater Sydney Region
NEPM requirements for monitoring based on population
Applying the formula in Clause 14(1) of the AAQ NEPM to Sydney’s ABS-estimated
population of 4.45 million in 2016, the number of monitoring stations required for the Greater
Sydney Region is currently eight. Based on NSW Planning Projections for population (see
Table 4), the required number of stations for 2016 was eight, rising to 10 in 2026.
There are 17 NEPM compliance monitoring stations operating in the Sydney SUA. Currently,
15 of these are included as NEPM compliance monitoring stations, with a further two
stations (Bargo and Oakdale) located outside Sydney SUA but considered within the Greater
Sydney air quality monitoring region.
9Air Quality Monitoring Plan for the Greater Sydney Region 2021–25
Table 4 Stations required according to population
Year and population calculation method Population Number of stations based
(millions) on NEPM calculation 1
2016 (ABS Sydney SUA) 4.45 8
2016 (NSW planning assumptions, Greater 4.69 8
Sydney)
2026 (NSW planning assumptions, Greater 5.75 10
Sydney)
Conclusions and recommendations for monitoring
The current number of monitoring stations meets AAQ NEPM requirements based on overall
region population.
There will be significant future population growth in the north-west and south-west of
Sydney; expansion of the network (e.g. Penrith) will be crucial to providing accurate data on
population exposure to NEPM pollutants. This aspect will be assessed annually and also in
the five-year review in 2025.
3.3 Terrain
The Greater Sydney Region is a coastal basin bound by elevated terrain to the north, west
and south. The weather within the region is affected by relatively complex topography, which
divides it into a number of subregions depending on prevailing synoptic conditions. The
land–sea interface develops mesoscale flows, which further complicates the monitoring of air
quality in the airshed.
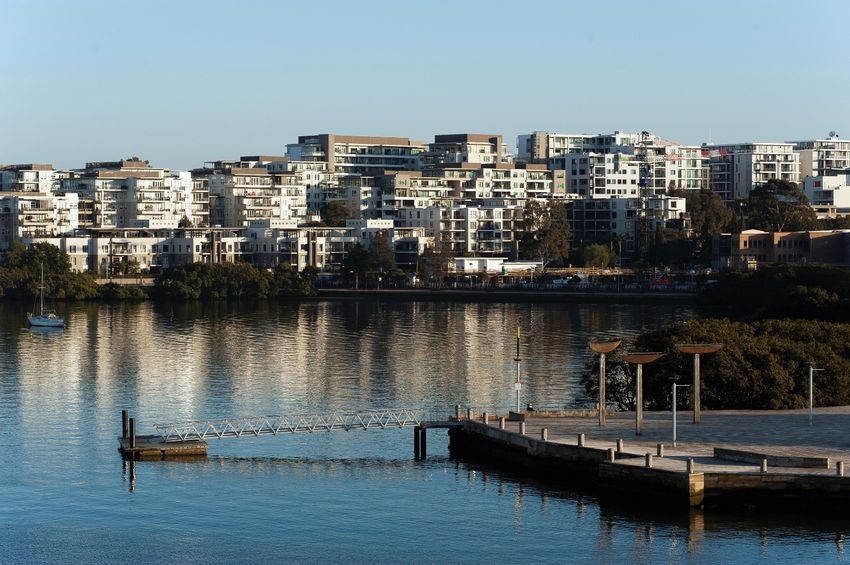
Figure 3 shows that the southern part of the Hawkesbury Basin is separated from the
Liverpool Basin and the rest of the region by the Blacktown Ridge (a band of relatively high
ground extending north–south from Campbelltown to Blacktown).
Air quality data show that the northern and southern regions of the Hawkesbury Basin have
distinct patterns of pollutant concentration, largely because of the north-easterly sea breeze.
1
Section 14(1) of the AAQ NEPM: (1) Subject to subclauses (2) and (3) below, the number of performance
monitoring stations for a region with a population of 25,000 people or more must be the next whole number
above the number calculated in accordance with the formula: 1.5P + 0.5, where P is the population of the region
(in millions). (2) Additional performance monitoring stations may be needed where pollutant levels are influenced
by local characteristics such as topography, weather, or emission sources. (3) Fewer performance monitoring
stations may be needed where it can be demonstrated that pollutant levels are reasonably expected to be
consistently lower than the standards mentioned in this Measure.
10Air Quality Monitoring Plan for the Greater Sydney Region 2021–25
Northern
Hawkesbury
Basin
Southern Liverpool
Hawkesbury Basin
Basin
Figure 3 Topography of the Greater Sydney Region
3.4 Regional climate and meteorology
Sydney has a generally mild, subtropical climate, affected by relatively complex topographic
features as outlined in Section 3.3. Given its coastal location, land breeze – sea breeze
interactions develop in the region, adding further complexity to its meteorological
configuration.
In general, daytime maximum temperatures increase with distance away from the coast,
particularly in summer. Winter minimum temperatures also typically decrease with distance
from the coast. In the eastern part of the region, the Sydney CBD records an average
summer maximum temperature of 26°C in January and an average winter minimum of 8°C
in July (AdaptNSW Regional Climate Snapshots). Penrith, in Western Sydney, experiences
an average summer maximum temperature of 31°C in January and a minimum average
temperature of 5°C in July.
Rainfall also decreases significantly away from the coast, with Sydney CBD recording an
annual average rainfall of 1213 mm compared to 705 mm in Penrith.
Distinct meteorological and associated air quality patterns can be observed across Sydney
throughout the year. Daily temperatures and solar radiation intensity are sufficiently high to
11Air Quality Monitoring Plan for the Greater Sydney Region 2021–25
promote photochemical smog in the warmer months from October to April, largely
associated with the movement of predominant north-easterly sea breezes. Winters are mild
near the coast with occasional frosts in the west of the Sydney Basin. Strong surface
temperature inversions are more likely to occur during winter months. An inversion tends to
trap air pollution in a layer of cold air close to the ground by a layer of warm air held above.
The strength and duration of the temperature inversions have great effect on air pollution.
With a stronger inversion, less surface pollution can disperse into the higher atmosphere.
The longer an inversion lasts, the more pollution may build up locally, and the worse air
quality can be.
Seasonally variable wind-flow patterns occur across Sydney, with north-easterly surface
winds dominating in the warmer months and westerly surface winds dominating in the cooler
months (Hyde et al. 1997; Hart et al. 2006; Jiang et al. 2016a). In the cooler months, the
daytime meteorology is controlled by large-scale synoptic features, with high-pressure
systems over southern Australia prevailing. In the Sydney Basin, light north-westerly
synoptic winds dominate, tending to transport pollutants offshore (Jiang et al. 2016a). In
contrast, summer coastal sea breezes tend to sweep pollution inland.
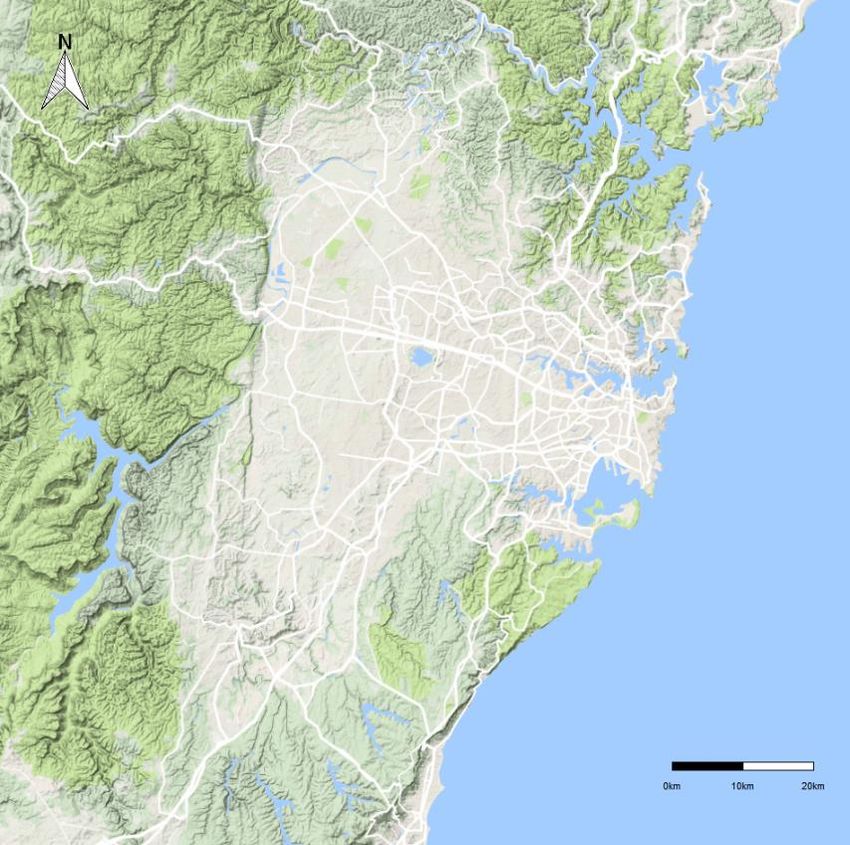
To illustrate the seasonal variability and geographical spread in surface wind patterns across
Sydney, hourly wind data from five selected stations (Chullora, Randwick, Richmond,
Bringelly and Bargo) have been plotted (Figure 4 to Figure 7). These seasonal wind roses
show distinct differences in wind patterns between the Hawkesbury Basin in the west and
the Liverpool Basin (east of the Blacktown Ridge) (Figure 3).
In summer (Figure 4), before sunrise, calm or light winds dominate throughout the Sydney
Basin as local down-valley or katabatic winds 2. In the afternoon, moderate to strong north-
easterly to easterly sea breezes dominate. These sea breezes extend as far south-west as
Bargo, and beyond. The direction and timing of the sea breeze are important, especially for
generating elevated ozone concentrations.
During autumn and winter (Figure 5 and Figure 6), the wind direction shifts to a westerly
direction. In the morning, wind speeds are relatively low to moderate, predominantly westerly
in the eastern part of the basin and south-westerly in the western part of the basin. In the
afternoon, wind flows vary on a daily basis. Light sea breezes can occur during the late
morning or early afternoon. Stronger westerly winds can also occur in the afternoon in all
parts of the basin.
Air temperatures are relatively low in winter (compared to summer) with weak or reversed
inland-to-coast temperature gradients that temper the sea breeze. The solar radiation
intensity is also low. Light gradient winds and stable conditions are conducive to clear, cold
nights and the development of nocturnal radiation inversions and drainage flows. These
conditions trap pollutants close to the surface, leading to high concentrations of particulates
arising from activities such as residential wood heating and hazard-reduction burning.
In spring there are strong synoptic pressure gradients, with high-speed westerly winds
prevailing (Figure 7) across the Sydney Basin (Crawford et al. 2016). Dust storms are most
common between September and December. These storms transport dust from inland
Australia and tend to occur when frontal systems pass west to east (McTainsh et al. 2005).
During late spring the winds begin shifting back to a north-easterly direction.
Further information on air pollution meteorology and climatology can be found in Section 4.
2 Katabatic wind, also called downslope wind, or gravity wind, is wind that blows down a slope because of gravity.
It occurs at night, when the highlands radiate heat and are cooled. The air in contact with these highlands is thus
also cooled, and it becomes denser than the air at the same elevation but away from the slope; it therefore
begins to flow downhill. This process is most pronounced in calm air because winds mix the air and prevent cold
pockets from forming. ‘Katabatic wind | meteorology | Britannica.’ https://www.britannica.com/science/katabatic-
wind.
12Air Quality Monitoring Plan for the Greater Sydney Region 2021–25
Richmond
0% 4% 8% 12% 16% 20%
Bringelly
Randwick
Chullora
0% 4% 8% 12% 16% 20%
0% 4% 8% 12% 16% 20%
Wind Speed (m/s)
>0 - 0.5
Bargo >0.5 - 3
>3 - 5
>5 - 7
0% 4% 8% 12% 16% 20% >7 - 9
Figure 4 Summer wind roses for Sydney 3
3 Wind roses show the wind direction and speed at a location. The length of each bar around the circle in these
wind roses shows the percentage of time the wind blows from a specific direction. The colours along the bars
indicate wind speeds. Wind speed in shown in metres per second (m/s).
13Air Quality Monitoring Plan for the Greater Sydney Region 2021–25
Richmond
0% 4% 8% 12% 16% 20%
Bringelly
Randwick
Chullora
0% 4% 8% 12% 16% 20%
0% 4% 8% 12% 16% 20%
0% 4% 8% 12% 16% 20%
Wind Speed (m/s)
Bargo >0 - 0.5
>0.5 - 3
>3 - 5
>5 - 7
0% 4% 8% 12% 16% 20%
>7 - 9
Figure 5 Autumn wind roses for Sydney3
14Air Quality Monitoring Plan for the Greater Sydney Region 2021–25
Richmond
0% 4% 8% 12% 16% 20%
Bringelly
Chullora Randwick
0% 4% 8% 12% 16% 20%
0% 4% 8% 12% 16% 20%
0% 5% 10% 15% 20%
Bargo
0% 5% 10% 15% 20%
Figure 6 Winter wind roses for Sydney3
15Air Quality Monitoring Plan for the Greater Sydney Region 2021–25
Richmond
0% 4% 8% 12% 16% 20%
Bringelly
Randwick
Chullora
0% 5% 10% 15% 20%
0% 5% 10% 15% 20% 0% 4% 8% 12% 16% 20%
Bargo
0% 5% 10% 15% 20%
Figure 7 Spring wind roses for Sydney3
3.5 Emission sources
The 2013 Calendar Year Air Emissions Inventory for the Greater Metropolitan Region (NSW
EPA, 2019) identified sources contributing to pollutant emissions in the Greater Sydney
Region.
Table 5 presents the top three emission activities contributing to PM2.5, PM10, SO2, NOx
and CO emissions in 2013 for the Greater Sydney Region (NSW EPA 2019). Major sources
contributing to PM2.5 emissions are residential wood heating (36.4%), hazard reduction
burning and bushfires (26.1%), and shipping (5.2%). Residential wood heating (24.5%) and
hazard-reduction burning and bushfires (19.9%) are also the top two activities contributing to
PM10 emissions in the region. Shipping is the dominating source of SO2 emissions (62.7%),
followed by petroleum and coal product manufacturing that contributes 22%. For NOx, diesel
and petrol vehicle exhaust contribute 30.9% and 22.1% respectively. The CO emissions
arise mainly from petrol vehicle exhaust (33.8%), hazard-reduction burning and bushfires
(16.6%) and residential wood heating (14.7%).
16Air Quality Monitoring Plan for the Greater Sydney Region 2021–25
Table 5 Top three emission activities contributing to PM2.5, PM10, SO2, NOx and CO
emissions in 2013 in the Greater Sydney Region
Substance Top three emission activities in the region
PM2.5 Domestic– Natural Off-Road
commercial
Residential wood Prescribed burning Shipping
heating and bushfires
36.4% 26.1% 5.2%
PM10 Domestic– Natural Commercial
commercial
Residential wood Prescribed burning Non-metallic mineral
heating and bushfires mining and quarrying
24.5% 19.9% 8.4%
SO2 Off-road Commercial Commercial
Shipping Petroleum and coal Ceramic product
product manufacturing manufacturing
62.7% 22.0% 4.4%
NOx On-Road On-Road Off-Road
Diesel vehicle Petrol vehicle exhaust Shipping
exhaust
30.9% 22.1% 11.2%
CO On-road Natural Domestic–commercial
Petrol vehicle Prescribed burning Residential wood
exhaust and bushfires heating
33.8% 16.6% 14.7%
3.6 Historical air quality monitoring in the
Greater Sydney Region
The Greater Sydney Region is subject to intensive, continuous air quality monitoring, as
shown in Table 2. A comprehensive list of metadata for the air quality monitoring stations,
including location, commissioning and decommissioning dates, is available on the
Department’s website: Air quality monitoring network.
Long-term trend analysis results are available at numerous sources, so are not replicated
here. These include:
• annual NEPM compliance reports, which give a comprehensive summary of air quality
trends and statistical data for this region against the NEPM air quality standards and
goals: Air quality annual reports
• NSW State of the Environment Reports (Air Quality), which are published on three-year
cycles
• NSW annual air quality statements, which summarise air quality across the network by
calendar year.
17Air Quality Monitoring Plan for the Greater Sydney Region 2021–25
Summary
Since 1994, air quality in this region has been ‘very good’ or ‘good’ for 70–85% of days in
Sydney. Sydney experienced ‘poor or worse’ air quality days due to ozone and particle
(PM10 and PM2.5) pollution.
There have been significant reductions in ambient nitrogen dioxide (NO2), carbon
monoxide (CO), sulfur dioxide (SO2) and lead levels since the 1990s. Ambient
concentrations of these pollutants are consistently below the relevant national standards.
Particle and ozone pollution are the main air quality issues for the region. The NEPM
standards have been exceeded from time to time for ozone and particles (as PM10 or
PM2.5).
A description of regional pollution by pollutant is presented below, with information on other
studies presented in Section 4.
Further details by pollutant
Particles
Particle pollution consists of both primary particles (released directly from sources) and
secondary particles (produced by chemical reactions between gases or between gases and
other particles in the air).
Sources of primary particle emissions include residential wood heaters in winter, bushfires,
construction work, motor vehicle exhaust, mining activities and occasional regional dust
storms.
Gaseous pollutants such as SO2, volatile organic compounds (VOCs), NOx and ammonia
contribute to the formation of secondary particles in the air. Rates of formation of secondary
inorganic and organic aerosol (SIA and SOA) increase during the summer, when increased
solar radiation enhances chemical reaction rates.
Major dust storms, bushfires and hazard-reduction burn days from 2000 to 2020 that
affected particle levels in the Greater Sydney Region were:
• November 2019 to January 2020 – ‘black summer’ bushfires which impacted south-east
Australia and burnt 18 million hectares
• May 2016 – several hazard-reduction burns in the Blue Mountains
• October 2013 – NSW ‘state of emergency’ bushfire
• September 2009 – the ‘red dawn’ dust event.
Particles as PM10
Since 1994, PM10 concentrations and the number of exceedance days have varied across
the years due to climatic conditions and there is no discernible trend. However, in 2018 and
2019 there has been a marked increase in the number of PM10 exceedance days. Higher
concentrations and more exceedances occurred in these years, with more-frequent
bushfires and dust storms. In general, dry El Niño years (e.g. 2002–07) are characterised by
higher concentrations and a greater number of exceedance days, with lower levels occurring
during wetter La Niña years such as 1998–2001 and 2010–11. In 2019, due to the ‘black
summer’ bushfires, the Greater Sydney Region recorded its highest number of exceedance
days (47) since 1994.
18Air Quality Monitoring Plan for the Greater Sydney Region 2021–25
Particles as PM2.5
Long-term trend data for PM2.5 is difficult since approved PM2.5 monitoring instrumentation
was not deployed across the Greater Sydney Region until 2012. Since then there has been
an increase in the number of exceedance days due to bushfires and hazard-reduction burns.
In 2019, due to the ‘black summer’ bushfires, the Greater Sydney Region recorded its
highest number of exceedance days (55) since 2012.
Ozone
Ground-level ozone is a secondary pollutant produced by the reaction of NOx and VOCs in
sunlight. High ozone concentrations in the Sydney subregions can result from local
precursor emissions, or the transport of ozone or precursor compounds from other regions
by the sea breeze. This is described in detail in ozone episode analysis reports from 2017,
2018 and 2018–19.
Since 1994 the number of ozone exceedance days in Sydney, in general, has declined.
Between 2009 and 2018 the number of exceedance days decreased considerably, with
fewer peak ozone events occurring between 2009 and 2019, despite this period including
the hottest years on record. However, in 2019 the total number of exceedances increased
sharply to a near-record number of 28 exceedance days, the highest since 1994. This was
due to two factors:
• the ‘black summer’ bushfires led to 19 exceedance days between October and
December across the entire Sydney region
• a significant heatwave in January led to nine exceedance days, primarily in south-
western Sydney.
Carbon monoxide, nitrogen dioxide, sulfur dioxide and lead
Since 1994, there have been significant reductions in the ambient concentrations of CO,
NO2, SO2 and lead. There have been few, if any, exceedances for these pollutants since that
time. Over recent years, the reductions in the concentrations of these pollutants have tailed
off, potentially indicating the benefits of emission reduction measures are being offset by
growth in emissions activities.
3.7 Community engagement
Monitoring must serve community needs. The NSW Government listens and learns from
communities, pursuing the best outcomes and creating opportunities that benefit all.
Monitoring must always be done for the sake of people’s wellbeing and the prosperity of
NSW. The NSW EPA leads engagement activities to identify and respond to community
needs. It produces a range of draft policies, agreements and reports that call for community
involvement, engagement and consultation. For example,
• In 2017, the NSW Government invited air quality stakeholders to complete an online
survey to help inform the development of a clean air policy for NSW. Survey
respondents called for more monitoring stations in locations such as Lake Macquarie,
Orange, Armidale, Dubbo, large regional centres on the North Coast, Western Sydney,
the Northern Beaches of Sydney, and Sutherland Shire. The survey findings are
available on the NSW EPA website.
• At the Clean Air Summit in June 2017, the NSW Government committed to expanding
the NSW air quality monitoring network, including new stations in CBDs and at a busy
roadside location in Sydney.
19Air Quality Monitoring Plan for the Greater Sydney Region 2021–25
NSW Government Air Program scientists participate in community engagement activities
and panels administered by the NSW EPA. There are several continuous feedback channels
for the public to discuss air quality monitoring and reporting. These include
• website feedback forms
• Environment Line online, or email info@environment.nsw.gov.au, or phone 131 555
• correspondence arising from email newsletters and reports.
Feedback and queries from these channels have resulted in a number of actions for
improving air quality monitoring and reporting. For example,
• Community feedback during the NSW 2019–20 bushfire period demonstrated a need to
improve our public information services. The NSW Government is working with other
jurisdictions, through the National Air Technical Advisory Group (NATAG), to ensure a
nationally consistent approach to air quality data reporting and to deliver health
information that is easier to understand. The NSW Government has implemented the
Environmental Health Standing Committee (enHealth) recommendation for hourly
PM2.5 reporting and related health messaging on its website.
• The Enhance Website and Data Delivery (EWADD) project, commissioned in 2019, is
implementing a system for managing, reporting and delivering air quality data to meet
changing business needs and customer expectations. A new website will deliver
enhanced public-facing air quality data and information services and replace the data
management and reporting system that has operated since 2008.
3.8 Overall analysis
Conclusions from analysis of other factors and recommendations for air
quality monitoring
Based on analysis of factors, the current monitoring regime will be maintained for the next
five years. The monitoring plan will be updated annually, with a major review in 2025.
In mid-2017, the NSW Government committed to commissioning new monitoring stations in
the Sydney CBD, in Parramatta CBD, and at a busy roadside location, and to investigating
monitoring needed for Penrith.
The Parramatta North site was commissioned in December 2017 at the former Westmead
Hospital site 4. A Sydney CBD site was established at a temporary location in September
2019 and moved to a permanent location nearby in February 2020. A Penrith monitoring
station was commissioned in 2020.
In 2018, a roadside monitoring site was established at Milsons Point, near the Sydney
Harbour bridge, to monitor all pollutants from heavy traffic flows.
The significant bushfire crisis of 2019–20 across Australia, and the consistently high levels of
air pollution measured across NSW, highlighted the dual purposes of an active air quality
monitoring network: monitoring air quality impacts across long time periods, and providing
information to help members of the public manage impacts on their health in real time. To
perform this second task adequately, monitors (whether fully NEPM compliant or not) need
to be located in areas where they can provide accurate information to the widest cohort of
the community as possible.
4. Monitoring was conducted at this site from 1980 to 2004.
20Air Quality Monitoring Plan for the Greater Sydney Region 2021–25
The NSW Government is considering monitoring in locations which have a large population
base and which are not significantly close to existing monitoring stations, or where unique
terrain or emission sources mean the expected air quality cannot be inferred from other
monitoring stations. Deployment of new monitoring must also be considered against
available resources, geographic equity across the entire State, and frequency of pollution
events expected.
Staged updates to the air quality website will be undertaken during the 2021–25 period. We
are working with the Australian Government and other jurisdictions to ensure a nationally
consistent approach to reporting air quality and associated health advice. A new, dedicated
air quality website is under development, with its official launch expected in 2022.
Within the Greater Sydney Region, gaps identified in the network coverage include
Sutherland Shire and surrounds, Northern Beaches and parts of the upper North Shore, and
the Blue Mountains. All three of these regions have significant population bases, are located
adjacent to bushland areas, and have areas of dispersed population across either hilly and
mountainous terrain, or in the case of the Northern Beaches, spread across a long stretch of
coast which can have varied air quality depending on meteorology and localised particle
sources from surrounding bushland.
4. Further information
Recent air quality studies for the Greater Sydney Region
There have been two recent significant studies carried out in Sydney to better understand
the composition and sources of particulate pollution:
• A very comprehensive set of observations and modelling studies of fine particles was
made during summer and autumn of 2011–12. This work culminated in the Sydney
Particle Study 2010–13 report (Cope et al. 2014).
• An analysis was made of particulate data collected from January 2000 to 31 December
2014. This work culminated in the Sydney Particle Characterisation Study report (Cohen
et al. 2016).
A third study, the Sydney Air Quality Study, is being undertaken by the Department to
assess air quality trends and source contributions to air pollution concentrations. This was
released in November 2020 and is available on NSW Environment website.
Sydney Particle Study 2010–13
The aim of the Sydney Particle Study 2010–13 (Cope et al. 2014) was to provide both an
improved understanding of the particle sources the population in the Greater Sydney Region
is exposed to, and a qualitative model of such sources. Two observation programs were
undertaken at Westmead (26 kilometres west of the Sydney CBD) to characterise particles
under summer conditions (February–March 2011) and autumn conditions (April–May 2012).
Particle measurements accounted for:
• particle number and size
• particle mass
• light scattering by particles
• particle composition.
The chemical composition of gaseous pollutants that form particles through chemical
reactions in the air was also measured.
21Air Quality Monitoring Plan for the Greater Sydney Region 2021–25
The modelling framework included meteorological modelling and chemical transport
modelling of pollutants released from natural and human activities.
Sydney Particle Study: summer observations
The summer observations identified the major components of fine particles (PM2.5) as:
• 34% of measured average PM2.5 was sea salt emissions from waves breaking in the
open ocean and coastal surf breaks.
• 34% of measured average PM2.5 was organic matter. This included primary particles
released from sources such as car exhaust, and secondary organic particles formed in
the atmosphere. Up to 70% of organic matter assessed through the study could be
secondary organic particles formed from gases released by biogenic sources.
• 15% of PM2.5 was secondary inorganic particles, which are fine particles of sulfate,
nitrate and ammonium produced by chemical reactions in the atmosphere from SO2,
NOx and ammonia emissions.
• 11% of PM2.5 was soil particles
• 6% was elemental carbon. Elemental carbon is emitted directly to the air from
combustion sources such as vehicles, wood heaters and bushfires.
Sydney Particle Study: autumn observations
During the autumn observation program:
• Organic matter was identified as the major component of PM2.5, constituting 57% of
measured average PM2.5. This component included primary particles released from
sources such as car exhaust, and secondary organic particles formed in the
atmosphere.
• Elemental carbon constituted 16% of autumn PM2.5 particles, secondary inorganic
particles 15%, soil 7% and sea salt 5%.
The autumn study found lower levels of sea salt in PM2.5 than did the summer one, while
organic matter comprised a larger portion of the PM2.5 particles measured. The contribution
from elemental carbon was also larger than in summer, while the secondary inorganic
contribution was about the same.
Sydney Particle Characterisation Study 2016
The aim of the Sydney Particle Characterisation Study (Cohen et al. 2016) was to identify
and quantify the major contributors of fine particle pollution in the Sydney Basin, and how
contributions have changed over time. This involved:
• identifying and quantifying sources contributing to PM2.5 concentrations, based on the
analysis of an existing 15-year PM2.5 mass and elemental dataset available for four
sites in the Sydney Basin (Lucas Heights, Richmond, Mascot and Liverpool)
• characterising seasonal and annual variations in the contribution of sources to PM2.5
concentrations over the 2000–14 period for each of the four sites.
The key findings were:
• Sydney’s air contains fine particles from wood smoke, industry, vehicles, sea salt and
soil.
• Smoke, including domestic wood burning sources, contributed 60–80% of fine particles
at some sites in the winter months.
22Air Quality Monitoring Plan for the Greater Sydney Region 2021–25
• Secondary sulfates, due to emissions from coal-fired power stations and industry,
contributed 50–70% of fine particles in summer at some sites.
• Particles from automobiles declined by 40% over the 15 years, but much of this
reduction occurred before about 2008, and motor vehicles remain a significant source of
fine particle pollution.
• Around 85% of the PM2.5 mass across the four sampling sites is from human sources.
Automobile sources contributed 1.45 μg/m³ or around 23% of the total PM2.5.
Secondary sulfates contributed a further 24% to the total PM2.5. Natural emissions such
as sea salt and dust also contributed to PM2.5 concentrations. Over the 15-year period,
PM2.5 emissions from automobiles, industry and smoke have declined.
Sydney air pollution synoptic climatology studies
The Jiang et al. (2016b) study provides both temporal and spatial analyses of the synoptic
processes affecting warm-month ozone and particle pollution in Sydney. The results suggest
that, due to Sydney's subtropical coastal-basin environment, the interaction between
mesoscale and synoptic-scale features determines local air quality conditions in the region,
rather than the synoptic conditions alone. Emissions from bushfires appear to have
considerable impacts on the synoptic modulation to visibility and PM10 levels, with such
impacts tending to be more at a local scale. In contrast, no comparable impacts were found
for ozone pollution. For ozone and visibility, the probability for an exceedance day under
some synoptic types varied considerably over time, implying there might have been a shift in
the role of synoptic modulation to local air quality associated with changes in air emissions
profiles. This study provides a leap in our understanding of the relationship between synoptic
circulation and air quality in a coastal-basin environment. The results are useful for
improving air quality forecasting in Sydney, with the methodology developed readily
applicable to similar regions elsewhere.
The Jiang et al. (2016a) study illustrates that while synoptic circulation types are influential,
the within-type variability in mesoscale flows plays a critical role in determining local ozone
levels in Sydney. The study identified three types of synoptic weather patterns most closely
associated with higher than average ozone concentrations in summer. All three synoptic
types are characterised by high solar radiation and high inland-to-coast temperature
gradients. Local circulation features such as terrain-related drainage flows and sea breezes
also play a significant role in producing ozone exceedances in the Sydney Basin.
Sydney Particle Study: chemical transport modelling
Chemical transport modelling indicated the release of VOCs from vegetation was a major
source of secondary organic particles during summer, whereas wood heaters were a
dominant source of such particles in autumn.
In summary, this combined monitoring–modelling study showed a seasonally varying
composition of fine particles, with natural emissions such as sea salt and biogenic emissions
(VOCs from vegetation and bushfires) contributing significantly to background PM2.5
concentrations. Secondary particles formed in the air were modelled to account for over 40%
of the PM2.5 concentrations measured during the autumn and summer observational
periods.
Data and modelling tools from the study have been used by the Department to develop its
particle models to account for chemical transformation and secondary particle formation.
Advanced particle modelling currently being undertaken as part of the Sydney Air Quality
Study will provide more evidence to guide NSW air policy.
23Air Quality Monitoring Plan for the Greater Sydney Region 2021–25
The Blue Mountains
The Blue Mountains, 120 kilometres west of Sydney, also experience cold winters. For
example, Katoomba, (elevation 1010 metres above sea level) experiences winter night-time
temperatures of -1°C on clear nights and 3–4°C on cloudy nights. Hazard-reduction burning
and residential wood heating are prevalent across the Blue Mountains in winter; bushfires
are common in summer. Although the Blue Mountains is part of the Sydney SUA, it is
geographically separated from the Sydney Basin by the Great Dividing Range. Previous
campaigns were conducted in Wentworth Falls during 1998–99 and Kurrajong Heights
during 2000–03. Ozone, NOx and visibility were monitored at both sites and PM10 at
Wentworth Falls only. Given the current population of the Blue Mountains of 29,320 (Urban
Centre and Locality [UCL] basis; ABS 2016) and the prevalence of particle pollution, a
campaign monitoring of all NEPM pollutants, including particulate pollutants, started in May
2019 and finished in June 2020. This project, entitled Blue Mountains and Lithgow Air
Watch, was managed by the EPA, with support from a range of Blue Mountains community
groups and volunteers, the Department of Planning, Industry and Environment, Blue
Mountains City and Lithgow Councils, Doctors for the Environment, Western Sydney
University and the Nepean Blue Mountains Local Health District.
5. References
AdaptNSW Regional Climate Snapshots 2020, Climate projections for your region,
https://climatechange.environment.nsw.gov.au/Climate-projections-for-NSW/Climate-
projections-for-your-region.
Cohen DD, Atanacio AJ, Stelcer E & Garton D 2016, Sydney Particle Characterisation
Study: PM2.5 Source Apportionment in the Sydney Region between 2000 and 2014,
Australian Nuclear Science and Technology Organisation, Sydney.
Cope M, Keywood M & Emmerson K et al. 2014, Sydney Particle Study 2010–13, Centre for
Australian Weather and Climate Research.
Crawford J, Griffiths A, Cohen D, Jiang N & Stelcer E 2016, Particulate Pollution in the
Sydney Region: Source Diagnostics and Synoptic Controls, Aerosol and Air Quality
Research 16, pp.1055–1066.
Hart M, De Dear R & Hyde R 2006, A Synoptic Climatology of Tropospheric Ozone Episodes
in Sydney, Australia, International Journal of Climatology 26, pp.1635–1649.
Hyde R, Young M, Hurley P & Manins P 1997, Metropolitan Air Quality Study – Meteorology
– Air Movements, Consultant’s Report to the EPA, NSW Environment Protection Authority,
Sydney.
Jiang N, Betts A & Riley M 2016a, Summarising Climate and Air Quality (Ozone) Data on
Self-organising Maps: a Sydney Case Study, Environmental Monitoring and Assessment
188(2):103.
Jiang N, Scorgie Y, Hart M, Riley ML, Crawford J, Beggs PJ, Edwards GC, Chang L, Salter
D & Di Virgilio G 2016b, Visualising the relationships between synoptic circulation type and
air quality in Sydney, a subtropical coastal-basin environment, International Journal of
Climatology 37, doi:10.1002/joc.4770.
McTainsh G, Chan YC, McGowan H, Leys J & Tews K 2005, The 23rd October 2002 Dust
Storm in Eastern Australia: Characteristics and Meteorological Conditions, Atmospheric
Environment 39, pp.1227–1236.
24You can also read