Next Generation P2P Botnets: Monitoring under Adverse Conditions - Protective
←
→
Page content transcription
If your browser does not render page correctly, please read the page content below
Next Generation P2P Botnets:
              Monitoring under Adverse Conditions

                    Leon Böck1 , Emmanouil Vasilomanolakis1 ,
                   Max Mühlhäuser1 , and Shankar Karuppayah2
          1
             Telecooperation Lab, Technische Universität Darmstadt, Germany,
                     {boeck,vasilomano,max}@tk.tu-darmstadt.de
    2
        National Advanced IPv6 Centre, Universiti Sains Malaysia (USM), Malaysia,
                                   kshankar@usm.my

Abstract

The effects of botnet attacks, over the years, have been devastating. From high
volume Distributed Denial of Service (DDoS) attacks to ransomware attacks,
it is evident that defensive measures need to be taken. Indeed, there has been
a number of successful takedowns of botnets that exhibit a centralized archi-
tecture. However, this is not the case with distributed botnets that are more
resilient and armed with countermeasures against monitoring. In this paper, we
argue that monitoring countermeasures, applied by botmasters, will only become
more sophisticated; to such an extent that monitoring, under these adverse con-
ditions, may become infeasible. That said, we present the most detailed analysis,
to date, of parameters that influence a P2P botnet’s resilience and monitoring
resistance. Integral to our analysis, we introduce BotChurn (BC) a realistic and
botnet-focused churn generator that can assist in the analysis of botnets. Our
experimental results suggest that certain parameter combinations greatly limit
intelligence gathering operations. Furthermore, our analysis highlights the need
for extensive collaboration between defenders. For instance, we show that even
the combined knowledge of 500 monitoring instances is insufficient to fully enu-
merate some of the examined botnets. In this context, we also raise the question
of whether botnet monitoring will still be feasible in the near future.

1       Introduction

Botnets are networks of infected computers, that can be remotely controlled
by malicious entities, commonly referred to as botmasters. Botnets have been
historically used for launching a multitude of attacks, ranging from DDoS and
blackmailing, to credential theft, banking fraud, etc. Recently, with the emer-
gence of the Internet of Things (IoT), the landscape of vulnerable connected
devices has increased significantly. This led to a resurgence of many new botnets
infecting weakly protected IoT devices. These IoT botnets are particularly noto-
rious for their high bandwidth DDoS attacks, bringing down even well protected
websites and services.
An approach to remove the botnet threat, is to identify and take down the
Command and Control (C2) channel used by the botmasters. For centralized
botnets, this has proven to be an effective approach with many being taken
down by seizing their respective C2 servers [1]. More advanced botnets over-
come this Single Point of Failure (SPoF), by employing a peer-to-peer (P2P) C2
structure, where each bot acts as a server and a client. Hence, defenders have
to target the majority of bots to take the botnet down. This requires knowledge
about the population and inter-connectivity of the botnet, which is commonly
achieved via monitoring. Monitoring mechanisms are commonly developed by re-
verse engineering and re-implementing the communication protocol of a botnet
to gather intelligence. As botnet monitoring poses a threat for the botmasters,
many botnets, e.g., GameOver Zeus [2] and Sality [3], implement monitoring
countermeasures. These mechanisms increase the difficulty of monitoring oper-
ations, but do not prevent them [4]. Nevertheless, recent publications presented
sophisticated countermeasures, that further limit or even prevent monitoring
activities [5–7]. Hence, we argue that it is a matter of time until botmasters
introduce such countermeasures to impede monitoring in its current form.
    To deal with next-generation botnets, we need to understand the extent at
which advanced countermeasures prevent monitoring operations. Investigating
each of the countermeasures individually will likely end in a never ending arms
race for new monitoring and anti-monitoring mechanisms. To avoid this arms
race, we instead introduce a lower boundary for monitoring operations in adverse
conditions, i.e., monitoring in the presence of sophisticated countermeasures.
    To achieve this, we make the assumption that a botmaster can detect any be-
havior deviating from that of a normal bot. Therefore, the maximum intelligence
that can be gathered with a single monitoring instance is limited to the informa-
tion that can be obtained by any regular bot itself. As this can vary for different
botnets, we analyze several botnet parameterizations to be able to evaluate how
much intelligence can be gathered in different botnet designs. This allows us to
evaluate the effectiveness of monitoring operations in adverse conditions, based
on the parameters of the botnet protocol. To ensure that our simulations accu-
rately replicate the behavior of real bots, we utilize churn measurements taken
from live botnets [8]. Moreover, we develop and present a novel botnet churn
generator that simulates churn more accurately than the state of the art. At a
glance, the two major contributions of this paper are:
 – An extensive analysis of botnet designs and parameterizations, with an em-
   phasis to their resilience and monitoring resistance.
 – A realistic and botnet-focused churn generator, namely BotChurn (BC).
    The remainder of this paper is structured as follows. Sections 2 and 3, intro-
duce the background information and the related work respectively. Section 4,
presents our analysis regarding the effectiveness of monitoring in adverse con-
ditions. Section 5, provides a detailed description of our proposed botnet churn
generator. Section 6 discusses the evaluation of our churn generator and the ef-
fectiveness of monitoring in adverse conditions. Lastly, Section 7, concludes our
work and presents outlooks with regard to our future work.
2     Background
In the following, we provide background information with regard to P2P botnets
and their underlying technologies as well as introductory information regarding
common monitoring mechanisms.

2.1   P2P Botnets
The decentralized nature of P2P botnets and the absence of a SPoF, makes
them highly resilient against takedown attempts [4]. P2P networks can be cate-
gorized into structured and unstructured overlays. Structured P2P overlays such
as Kademlia [9] use a concept called Distributed Hash Table (DHT). As an exam-
ple, Kademlia implements a ring structure on which all peers, i.e., participants
in the P2P network, are placed based on their ID. Peers connect to a set peers,
based on their distance in the ring structure. Unstructured P2P overlays do
not have such a structure but maintain connectivity based on a Membership
Management (MM) mechanism. At the core of this MM is a so called Neigh-
borlist (NL). The NL consists of a subset of all existing peers commonly referred
to as neighbors. To maintain connectivity within the network, peers frequently
exchange NL-entries with their neighbors.
    For botnets, the major difference between structured and unstructured P2P
networks is related to the difficulty of monitoring. For instance, structured bot-
nets, e.g., Storm [10], can be monitored efficiently [11]. More recent P2P botnets
such as Sality [3], GameOver Zeus [2] and ZeroAccess [12] use unstructured
P2P overlays. This makes them more difficult to be monitored, as the lack of
a structure prevents the usage of efficient approaches applicable to structured
P2P networks. Due to the greater resistance against monitoring attempts, this
paper focuses on unstructured P2P botnets.
    A major challenge for any P2P overlay is the handling of node churn, i.e.,
nodes leaving and joining the network. Churn is caused by diurnal patterns or
by machines being turned off and on throughout the globe. To ensure that the
network remains connected under the effects of churn, P2P overlays leverage
the MM system. The MM ensures that inactive peers, in the NL of a node, are
replaced with responsive peers. This is usually achieved by probing the activity
of all entries in an NL at fixed intervals. Common values for such Membership
Management Intervals (MMIs) are between one second [12] and 40 minutes [3].
    If an entry in the NL of a bot is unresponsive for several consecutive MMIs,
it is removed from the NL. To replace removed peers, a node commonly asks
their own neighbors for responsive candidates by sending an NL-request. A bot’s
NL can also be passively updated upon receipt of a message from a bot that
is not in the bot’s NL [2]. This allows the bots to maintain active connections
among bots within the P2P overlay despite being affected by churn.

2.2   Botnet Monitoring Mechanisms
To obtain information about the extent of a botnet infection, one has to conduct
intelligence gathering by monitoring the botnet. Monitoring a P2P botnet is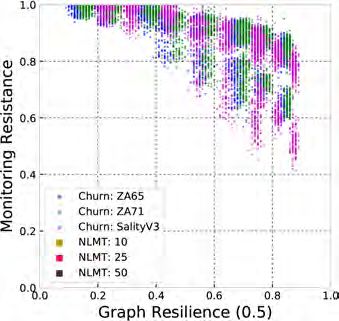
achieved via the usage of crawlers, sensors or a combination of both. At a glance,
crawlers are more of an active approach whereas sensors are more passive.
    A crawler enumerates the botnet by continuously requesting NL-entries from
bots. Given a list of seed-nodes, a crawler follows a crawling strategy such as
Breadth-First Search (BFS), Depth-First Search (DFS) or Less Invasive Crawl-
ing Algorithm (LICA) [13] to discover bots within the botnet. The seed-list is
updated between crawls by adding all newly discovered bots into it. This allows
crawlers to quickly obtain information about participating bots and their inter-
connectivity. The major drawback of crawlers is that they cannot discover bots
that are behind Network Address Translation (NAT) or a firewall. Such bots usu-
ally cannot be contacted from the Internet, unless they initiate the connection
first. Therefore, crawlers underestimate the population of a botnet [4]. Moreover,
the aggressive sending of NL-requests makes crawlers easy to detect [5].
    Sensors can provide more accurate enumerations of botnets by overcoming
the aforesaid drawback of crawlers. A sensor imitates the behavior of a regular
bot by responding to probe messages from other bots. By remaining active within
the botnet for prolonged periods, sensors become popular within the botnet.
That is, more bots will add the sensor to their NL and frequently contact it
during their MMI. This allows a sensor to accurately keep track of the entire
botnet population including those that are behind NAT-like devices. However,
a major drawback for sensors is the lack of inter-connectivity information of
the botnet. Therefore, sensors are commonly used as an addition to crawlers
instead of a replacement. Another drawback of sensors is that they require time
to become popular and therefore do not yield results as quickly as crawlers. This
can again be surmounted by using a crawler to help spread information about
the sensor to speed up the popularization process [14].

3     Related Work

In this section, we discuss the state of the art of: i ) P2P botnet monitoring
techniques and ii ) advanced countermeasures against monitoring.

3.1   P2P Botnet Monitoring

Rossow et al. present an in-depth analysis on the resilience against intelligence
gathering and disruption of P2P botnets [4]. They analyze the peer enumeration
capabilities of sensors and crawlers on several P2P botnets and provide real world
results. Furthermore, they analyze the resilience of these botnets against com-
munication layer poisoning and sink-holing attacks. Their work clearly presents
the drawbacks and benefits of crawlers and sensors. The authors also present
an analysis of reconnaissance countermeasures implemented by botnets. Most
notably, botnets such as Sality and GameOver Zeus implement rate limiting
mechanisms on neighborlist replies. In addition, GameOver Zeus implements an
automated blacklisting mechanism against aggressive crawlers.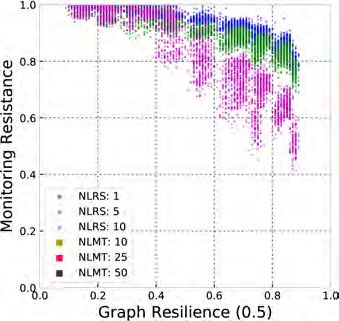
Karuppayah et al. introduce a new crawling strategy called LICA [13]. Their
crawling algorithm approximates the minimum vertex coverage by prioritizing
nodes with high in-degree. Their approach provides a means to crawl a bot-
net faster and more efficiently compared to BFS or DFS. Yan et al. present a
sensor popularization method called popularity boosting [14]. Popularity boost-
ing leverages a mechanism that botnets commonly use to allow new bots to
get into other peers NLs. For instance, in the Sality botnet, a bot can send a
server-announcement-message upon joining the botnet. If the bot fulfills a set
of conditions, such as being publicly routable, it will be added at the end of the
receiving bot’s NL. This mechanism allows sensors to be quickly injected into
the NL of active bots in a botnet. In [15], the authors present an algorithm that
efficiently extracts all entries from a bot’s NL in the GameOver Zeus botnet.
Contrary to a random spoofing of IDs, their strategic approach guarantees to
extract all entries from a bot’s NL. Lastly, botnet detection mechanisms such
as [16, 17] also provide monitoring information about botnets. While the main
goal this research is to detect botnets within a monitored network, this infor-
mation can also be used for enumeration or derivation of connectivity between
individual bots.

3.2   Monitoring Countermeasures
In this section, we introduce the landscape of monitoring countermeasures. We
differentiate between countermeasures that have been implemented by botmas-
ters and novel countermeasures that have been proposed by researchers.

Existing Anti-Monitoring Mechanisms: As monitoring poses a threat to
botmasters, some botnets implement features specifically aimed at preventing
monitoring attempts. Many botnets such as GameOver Zeus [2], Sality [3], and
ZeroAccess [12] implement restricted Neighborlist Reply Sizes (NLRSs). This
means, that when being requested, they only share a subset of their NL to the
requesting bot. This significantly increases the enumeration effort for crawlers.
    Furthermore, GameOver Zeus implements an automated blacklisting mech-
anism that blacklists a node if it sends more than five requests within a sliding
window of one minute. The Sality botnet also implements a simple trust mech-
anism called Goodcount. For each NL-entry, such a Goodcount value is main-
tained. A bot sends periodic messages to all its neighbors and increases a nodes
Goodcount upon receipt of a valid reply and decreases the Goodcount otherwise.
This locally maintained reputation mechanism prevents that a bot replaces well
known active NL-entries with newer entries, e.g., sensors.

Proposed Advanced Anti-Monitoring Mechanisms: Andriesse et al. an-
alyzed whether sensors and crawlers can be detected, from the botmasters’ per-
spective, based on protocol and behavioral anomalies [7]. Their findings suggest
that crawlers can indeed be detected based on anomalous behavior. The anoma-
lies that were used for identifying the crawlers, vary from implementation-specific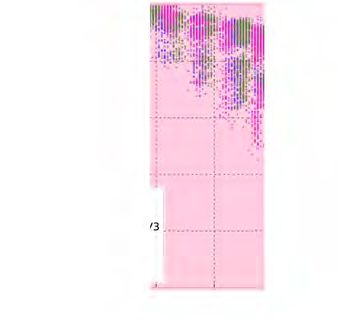
ones to logical and protocol level misconducts. The authors were also able to de-
tect sensor nodes based on deviating (protocol) features.
    Karuppayah et al. present another mechanism, that uses a bot’s local view
to identify crawlers within a P2P botnet [5]. For that, they focus on protocol
violations that are common for crawlers in all P2P botnets. Upon detection, a
bot can blacklist the crawler and prevent any further communication with it.
    In [18] and [8], the authors use graph connectivity metrics to identify sensor
nodes within P2P overlays. Both approaches are based on the assumption that
researchers and law enforcement agencies cannot aid the botnet in any way, in-
cluding the returning of valid neighbors when being asked. Böck et al. [18] use
the Local Clustering Coefficient (LCC) mechanism to detect sensors that do not
have any neighbors or groups of sensors that are fully meshed. Moreover [8], im-
proves upon this and introduces two other mechanisms based on PageRank [19]
and Strongly Connected Components (SCCs). Their proposed mechanisms can-
not be easily avoided by defenders as they require either large numbers of col-
luding sensors or active sharing of valid neighbors when being requested. Lastly,
Vasilomanolakis et al. propose the use of computational trust for calculating
trust scores for all neighbors of a bot [6]. This allows them to automatically
blacklist bots that refuse to cooperate in the sharing of commands.

4     Botnet Monitoring under Adverse Conditions

The adoption of advanced countermeasures will change the landscape of botnet
monitoring. Here, we define the term adverse conditions and discuss approaches
for monitoring in the presence of countermeasures. Furthermore, we introduce
the idea of leveraging the Membership Management (MM) to obstruct moni-
toring operations. Moreover, we discuss the limitations of the MM design with
regard to the trade-off between monitoring resistance and the resilience of bot-
nets.

4.1   Identifying the Worst-Case Monitoring Scenario

We contend, that existing botnet monitoring mechanisms may no longer be fea-
sible under adverse conditions (see Section 3). Therefore, new approaches to
monitor botnets are urgently needed. Based on our analysis of the related work,
we propose five approaches to conduct monitoring in adverse conditions. Namely
these are: short-term monitoring, network traffic analysis, network scanning, tak-
ing control of active bots, and running botnet malware in controlled environments.
    Depending on the specifics of the implemented anti-monitoring mechanisms,
short-term monitoring may be possible for monitoring using crawlers and sen-
sors. To avoid preemptive blacklisting of legitimate bots, anti-monitoring mech-
anisms may require multiple anomalous interactions before a blacklisting oc-
curs [6]. This can allow short-time monitoring, in which the anti-monitoring
mechanisms are not triggered. Furthermore, if sufficient resources are available,
blacklisted IPs can be replaced to perform continuous monitoring. The major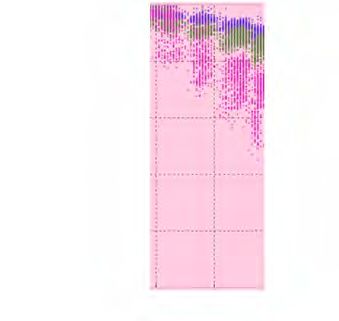
drawback of this approach is the scarcity of IP addresses which leads to higher
costs and eventually IPs run out due to blacklisting.
    Network traffic analysis based monitoring approaches are not affected by the
anti-monitoring mechanisms described in Section 3. Traffic based monitoring
passively analyzes the network traffic and is therefore outside the scope of ad-
vanced countermeasures. Approaches such as [16,17] can detect botnet traffic on
top of Internet Service Provider (ISP) level network traces. The benefit of this
approach is that it provides a centralized view on all bot infections within the
network and their neighbors. Nevertheless, this approach is unlikely to provide a
holistic view of the botnet unless all ISPs cooperate and share their information.
    Alternatively, another approach is to scan the Internet for botnet activity
on specific ports. Such a network scanning approach has already been done to
obtain bootstrap nodes for crawling the ZeroAccess botnet [20]. This requires the
botnet to use a fixed port for its communication which is the case for botnets
such as the ZeroAccess family [12]. In fact, tools such as ZMAP are capable
of rapidly scanning the entire IPv4 address space [21]. However, many recent
botnets implement dynamic ports to avoid being scanned easily.
    Another approach to obtain intelligence about a botnet can be to take control
of active bots. This could theoretically be realized by anti-virus companies or
operating system manufacturers. Once the malware is identified, the related
network traffic can be analyzed to identify other infected hosts. Furthermore,
if detailed knowledge about the malware is available, malicious traffic could be
blocked. This would allow the controlling parties to use the infected machines
themselves as monitors by analyzing the MM traffic.
    In addition, it is also possible to run and observe botnet malware in a con-
trolled environment, such as a bare metal machine or a controlled virtual envi-
ronment. Contrary to taking control of an infected device, a clean machine is
deliberately infected with the botnet malware. This allows to set up machines
specifically for botnet monitoring, e.g. not storing sensitive data, rate limiting
network connections, or installing software to analyze the network traffic. Even
with such safeguards, legal and ethical limitations need to be considered with
this approach.
    Defining exactly how much information can be gathered under adverse con-
ditions is not possible, as combinations of monitoring and sophisticated counter-
measures will only lead to a never-ending arms race. However, all of the discussed
monitoring approaches can gather at least as much information as a regular bot
without being detected. In fact, network-based monitoring approaches on the
ISP level will likely observe traffic of multiple infections at once. To avoid the
aforementioned arms race, we focus on the worst-case scenario and establish a
lower boundary for monitoring under adverse conditions.
    Based on the findings of this section, we want to define the term Monitoring
Device (MD) as any monitoring approach, that obtains intelligence based on the
view of a bot. Similarly, we define the term adverse conditions as a botnet envi-
ronment in which any behavior deviating form that of a normal bot can be auto-
matically detected by botmasters. Therefore, we argue that the lower boundary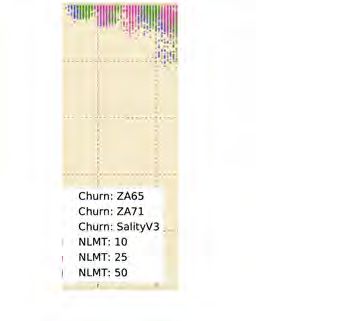
for monitoring operations in adverse conditions is limited to the knowledge/view
that can be obtained by any regular bot itself.

4.2   Limiting Monitoring Information through the MM Design
The amount of information a single bot can obtain influences the results of
monitoring in adverse conditions. Hence, it is likely that botmasters will design
their botnets such that a single bot learns as less as possible about the botnet
without jeopardizing the resilience of the botnet itself. This can be achieved by
tweaking the MM protocol of the botnet. At its core, the MM protocol must
provide three features: maintain an NL, provide a means to update the NL and
frequently check the availability of neighbors. To identify how these requirements
are met by existing botnets, we identified and compared the related parameters
of five existing P2P botnets in Table 1.
    The need of maintaining an NL is commonly addressed with two parameters,
the NL-size and the Neighborlist Minimum Threshold (NLMT). The NL-size is
an integer indicating the maximum size of the NL. The NLMT is another integer
indicating the minimum number of bots that should always be maintained. A
bot will not remove any more bots once this threshold is reached, and it will start
sending NL-requests to obtain fresh entries. Oftentimes, botnets do not explicitly
state an NLMT and instead have NL-size = NLMT. To update a bot’s NL, both
push or pull based NL-updates can be used. Push based updates allow a bot to
insert itself into another bot’s NL and are commonly only used for bots joining
a botnet. Pull based updates are usually realized through NL-request messages,
which allow a bot to ask actively for additional bots. NL-request messages are
often affected by an Neighborlist Reply Size (NLRS) which limits the number of
bots shared upon a single request, and the Neighborlist Reply Preference (NLRP)
which defines how the shared bots are selected. Lastly, to check the availability
of their neighbors, bots commonly probe all NL-entries during the MMI.
    To illustrate how MM can be used to limit monitoring information, we con-
sider the following scenario. The NLMT indicates the minimal number of neigh-
bors with whom a bot communicates regularly. Thus, limiting the NLMT is an
effective measure to limit the knowledge that can be obtained by a bot. However,
the NLMT is not the only parameter that can limit this type of knowledge. Other
parameters such as the MMI, the number of nodes returned upon an NL-request,
the churn behavior of the botnet or which neighbors are returned when being
requested, can influence the amount of knowledge each bot can obtain about
the botnet. In Section 6, we examine in detail, how each parameter influences
the knowledge obtainable by a single bot, i.e., the lower boundary knowledge for
monitoring operations under adverse conditions.

4.3   Botnet Design Constraints
Optimizing a botnet’s MM to impede monitoring operations, comes at a cost.
The usage of P2P overlays for inter-bot communication was initially intended
to improve the resilience against takedown attempts. However, we expect that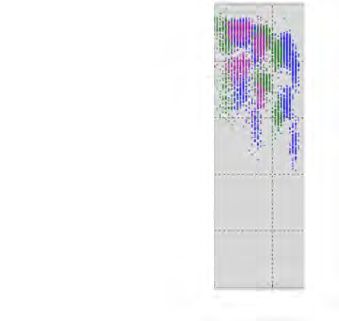
GameOver Sality ZeroAccess         Kelihos F.         Nugache
                     Zeus [2] [3]    [22]               [4]                [4]
Pull based updates      Yes      Yes       Yes             Yes               Yes
Push based updates    Always     Join      Join            Join             Join
MMI                   30min     40min       1s            10min            random
NL-size                 50       1000      256             3000              100
NLRS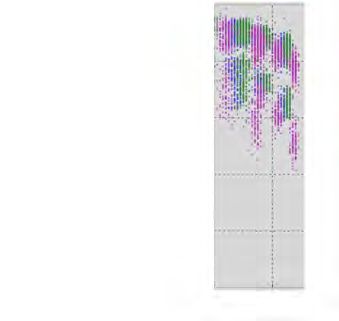
5     Modeling and Simulating Botnet Churn
As one of the core contributions of this paper, we propose and verify a novel churn
model and generator, focused on the simulation of botnet churn based on real
world measurements. Section 5.1 discusses the shortcomings of existing churn
generators with regard to simulation of real world botnet churn. Furthermore,
Section 5.2 introduces our churn generator.

5.1   Simulation of Real World Churn Models
The availability of a bot’s neighbors directly influences whether old connections
are retained or if newer connections need to be established. Therefore, churn
significantly impacts the overall structure of the botnet overlay. This is why we
consider churn generators as a crucial feature for a P2P botnet simulator.
    A recent survey by Surati at al. [23] examined the existing P2P simulators.
We analyzed each of these simulators with regard to their churn generator func-
tionalities. Out of all simulators, Peerfactsim.kom [24] and OverSim [25] provide
the most advanced churn functionalities. Peerfactsim.kom implements a churn
generator that is based on the exponential distribution, whereas OverSim pro-
vides the choice between random, life-time and Pareto churn models. However,
according to Stutzbach et al. [26] exponential and Pareto distributions do not fit
churn characteristics observed in real world P2P networks. Moreover, a random
churn model is also not suitable as it only provides rudimentary presentation
of churn and does not characterize the network accurately. This leaves only the
option of life-time based churn models. Such a churn, which is implemented in
OverSim, allows the usage of different probability distributions, e.g., the Weibull
distribution. According to both [8, 26], Weibull distributions fit well with the
churn observed in regular P2P networks and P2P botnets.
    However, the implementation in OverSim has two major drawbacks. First,
the life-time and down-time of nodes is drawn from the same probability distri-
bution. We speculate that this is done to allow for an easily adjustable active
population. However, this is a critical issue, as it is highly unrealistic that life-
and down-time distributions are equal, at least in the case of P2P botnets.
Second, the implementation in OverSim requires the overall population of the
simulated network to be exactly double of the desired active population. This
allows to have an equal number of active and inactive nodes. In combination
to nodes joining and leaving based on the same distribution the active popula-
tion is approximated throughout the simulation period. Given these drawbacks
of life-time churn, all existing churn generators present severe drawbacks with
regard to a realistic simulation of churn in P2P botnets.

5.2   The BotChurn (BC) generator
Based on the aforesaid shortcomings of existing churn simulation models, we
develop BC, a novel approach to simulate P2P botnet churn based on real world
measurements. To overcome the drawbacks of existing churn generators, BC
focuses on addressing the following three features: i ) individual distributions for
life- and down-times of nodes, ii ) support for existing P2P churn measurements,
and iii ) independently adjustable active and overall population parameters.
Support for distinct Weibull distributions for life- and down-times:
One approach to overcome the issue of having a single distribution for life- and
down-times would be to use two different distributions as it is done for the Pareto
churn model [27]. However, obtaining accurate measurements of down-times is
often not possible as many P2P botnets do not provide unique identifiers [3, 12].
Therefore, it is difficult to accurately measure when a node rejoins a system.
As an alternative, BC is based on a life-time and an inter-arrival distribution.
Theoretically, any probability distribution function can be used. However, we
currently support only the Weibull distribution for life-time and inter-arrival
measurements as it is found best suited for churn in P2P systems [8, 26]. In
contrast to life-time churn, BC starts with all nodes being inactive. Based on
the times drawn from the inter-arrival distribution, a random inactive node is
activated. Upon activation, a life-time value is assigned based on the life-time
distribution. Once a bot’s life-time comes to an end, it becomes inactive. This is
a continuous process, where inactive bots will eventually rejoin the system based
on the inter-arrival cycle.
Calculation of the average active population: One issue that needs to be
addressed by our approach, is that whenever a node needs to be activated, an
inactive node must be available to join the network. Therefore, the overall bot
population needs to be larger than the average active population of the simulated
botnet. This requires that we first calculate the average active number of bots
based on the two input distributions.
According to the law of large numbers, with sufficiently long simulation time
τ , with τ → ∞, the average inter-arrival time of nodes joining the system
will converge towards the mean of the inter-arrival distribution. Therefore, the
arrival-rate Ra will eventually converge towards the mean. However, the number
of nodes leaving the system is dependent on the life-time distribution and the
number of nodes active in the system. If we consider the average life-time λ and
an active number of nodes Na , on average nodes will go off-line at a rate of Nλa .
We can therefore calculate the average active population by identifying the
active population Na , at which the average departure-rate Rd is equal to the
average arrival-rate Ra . This is achieved by solving Equation 1.
λ λ
Ra = Rd = ⇒ Na = (1)
Na Ra
Independent active- and overall-populations: Lastly, we want to address
the need for an independently adjustable overall- and active-population. In BC,
the overall-population can be set to any desired value. However, as discussed
earlier, it should be bigger than the desired active-population.Adjusting the active population requires additional effort. In more details, it
is necessary to modify at least one of the two distributions, as the active popu-
lation is directly related to both inter-arrival and life-time distributions. While
this means that we modify the values obtained from real world measurements,
this is often necessary to experiment with different sizes of botnets.
To adjust the active population, we can modify either the inter-arrival or
the life-time Weibull distribution. As the reported measurements of Karuppayah
[8] showed high similarity in the fitting of Weibull life-time distributions for
botnets of different sizes, we maintain the input life-time distribution without
any modification. Furthermore, it is not very likely that the size of a botnet has
a direct influence on the life-time behavior of its individual nodes.
Therefore, we have to adjust the inter-arrival distribution to accommodate
an adjustable active population. To adjust a Weibull distribution, one can either
choose its shape β or scale α parameter. To change the real world measurements
as little as possible, we want to change the parameter that is less similar across
all botnets measured in [8]. The shape parameter of the reported inter-arrival
distributions ranges from 0.61 to 1.04, whereas the scale parameter varies be-
tween 0.6801 and 160.2564. As the difference between the scale parameters is
bigger across the measured botnets, we choose to modify the scale parameter α,
while keeping the shape parameter β unaltered. With this modification, we can
choose any desired active population value as an input to Equation 1 and obtain
the required arrival rate Ra .
6 Evaluation
Within this section, we present the evaluation of BotChurn (BC) and the influ-
ence of MM on monitoring resistance and resilience of botnets. Furthermore, an
analysis on the effectiveness of monitoring in adverse conditions is also provided.
6.1 Datasets and Evaluation Metrics
In our evaluation, we utilize three datasets: i ) real world churn measurements of
Sality and ZeroAccess botnets, ii ) real world graphs of the Sality botnet and iii )
a simulated dataset consisting of 1, 458 combinations of different parameters.
The real-world churn measurements, that we obtained from [8], consist of
inter-arrival and life-time distributions. In this paper, we focus on three par-
ticular measurements. These are the ZeroAccess 16465 (ZA65) including non-
superpeers, i.e., bots behind NAT or firewalls, ZeroAccess 16471 (ZA71) and
Sality version three (SalityV3). The details for these datasets are given in Table
2.
The real-world snapshots of the Sality botnet were taken from [28]. The au-
thors, present an analysis on the graph characteristics and resilience of the Sality
and ZeroAccess botnets. The metrics used in their analysis are the number of
nodes, number of edges, degree, in-degree, out-degree, density, global clustering
coefficient, average path length and the diameter of the botnet. We utilize theirZeroAccess 71 ZeroAccess 65 Sality v3
including non-super peers
(ZA71) (ZA65) (SalityV3)
Inter-Arrival: Ra (β, α) (0.95, 3.0769) (1.04, 3.8023) (0.66, 5.814)
Life-Time: λ(β, α) (0.21, 76.9231) (0.18, 12.21) (0.28, 1139.3174)
Active Population (Na ) 165 1037 1963
Table 2: Churn measurements by [8]; weibull parameters as tuples (shape, scale).
publicly available snapshot of the Sality botnet to compare it against our simu-
lated botnet topologies. More specifically, we utilize the dataset to compare the
graph characteristics and resilience reported by Haas et al. [28] against those
from the generated topologies.
Our last dataset is generated using our simulation framework3 . We simulated
1, 458 different parameter combinations with 20 repetitions for a duration of 75
days each. Table 3, presents all parameter types and their values. The parame-
ters used in our simulations consist of the churn model, the MM parameters as
discussed in Section 4, the number of MDs and the active and overall population.
It is important to note, that the maximum NL-size is not independently
varied but instead dependent on the Neighborlist Minimum Threshold (NLMT).
In an analysis on the influence of each individual parameter, we found that
the NL-size itself only has a minor influence on the resilience or monitoring
resistance. The reason for this is, that bots only search for additional neighbors
if the NLMT is reached. Therefore, we set the NL-size to be twice as large as the
NLMT. Furthermore, we adjusted the overall population in relation to the active
population. We chose to use a factor of three, four or five, as our simulations
of the churn model have shown, that the simulated graphs are most similar to
the real world graphs at an overall population about four times larger than the
active population.
Parameter Value
Churn Model SalityV3, ZA65, ZA71
Membership Management Interval (MMI) 30m, 1h, 2h
Max NL-size 2x NLMT
Neighborlist Minimum Threshold (NLMT) 10, 25, 50
Neighborlist Reply Size (NLRS) 1, 5, 10
Neighborlist Reply Preference (NLRP) Latest, Random
Number of MDs 1, (10, 50, 200, 500)
Active Population (Na ) 1963, 1037, 165
Overall Population (Nt ) x3, x4, x5 Active Population
Table 3: Parameter combinations used for the evaluation.
3
https://git.tk.informatik.tu-darmstadt.de/SPIN/BSFTo evaluate our work, we utilize the network resilience and monitoring resis-
tance metrics. We measure the resilience of a botnet similarly to [28]. Iteratively
the bot with the highest in-degree is removed from the botnet, until the ratio
of nodes disconnected from the largest weakly connected component exceeds a
threshold t ∈ [0, 1]. Therefore, the GraphResilience(t) denotes the fraction of
bots that need to be removed, to have more than t% of the remaining bots dis-
connected from the botnet. Within our evaluation, we consider a threshold of
t = 0.5, as it was least affected by outliers. The monitoring resistance indicates
the difficulty of monitoring a botnet, i.e., the fraction of the overall population
that could not be enumerated. We define monitoring resistance ρ in Equation 2,
based on the overall-population Nt , and µ the information obtained by an MD.
|µ|
ρ=1− (2)
|Nt |
6.2 Simulation Setup
Within this subsection, we introduce our simulation setup. Overall we introduce
three separate experiments: i ) an evaluation of BC, ii ) an analysis of the MM
on monitoring resistance and network resilience, and iii ) an evaluation on how
utilizing multiple MDs increases the intelligence gathered through monitoring.
For the evaluation of BC, we intend to investigate two research topics. First,
the warm-up time required to reach the desired active population, and second,
whether the generated topologies are more similar to the real-world characteris-
tics reported in [28] than those created with OverSim’s life-time churn generator.
To compare the two churn generators with the real world dataset, we run 24
simulations of the Sality botnet with each of them. To match the active popula-
tion of the real world Sality graph provided by Haas et al. [28], we set the target
active population to 1, 422. In addition, to compare the difference between the
graph characteristics of the real world Sality botnet and the simulated topolo-
gies, we use the mean absolute error. The Mean Absolute Error (MAE) allows us
to calculate the average difference between the graph characteristics of the sim-
ulated and real world dataset. To ensure, that the parameters are in comparable
value ranges when calculating the error, we normalized all values through feature
scaling. Furthermore, we compare the graphs with regard to their resilience.
To analyze the effects of each MM parameter with regard to monitoring resis-
tance and botnet resilience we use our simulated dataset (see Table 3). Further-
more, to highlight the influence of each parameter, we analyze and discuss each
of them individually. Every simulation is run for a period of 75 days, with the
MD joining after 40 days. After the entire simulation time, we took a snapshot
of the graph and then analyzed its monitoring resistance and graph resilience.
We expect, that a single MD will not yield enough intelligence to conduct
successful monitoring in adverse conditions. This raises the question about how
we can improve the knowledge obtained by monitoring operations. One approach
is to broaden the information obtained via monitoring by increasing the number
of MDs. To analyze the effects of aggregating the information of multiple MDs,we repeated the simulations with the most monitoring resistant and resilient
MM parameter combinations, i.e., under the most adverse conditions. To keep
the number of MDs within a realistic range, we ran the simulations with 10, 50,
200 and 500 deployed MDs. Note that, 500 is close to the highest number of
sensors ever reported (512) to be used to monitor a botnet [7].
6.3 Results
In this subsection, we present the results of our evaluation.
BotChurn (BC) evaluation Before the comparison between simulated and
real world graphs, we evaluated the warm-up period required by BC to reach
the desired active population. The results for all three investigated churn models
indicate, that the active population is reached within less than 40 days.
0.60
life-time: 2844 BC: 5500 1.0 BotChurn (BC)
0.55 BC: 4000 BC: 6000 Life-Time Churn
Portion isolated nodes
BC: 4500 BC: 6500 SalityV3 max Population
mean absolute error
0.50 BC: 5000 0.8 SalityV3 min Population
0.45
0.6
0.40
0.35 0.4
0.30 0.2
0.25
0.0
0.20 10 15 20 25 30 35 40 45 50 0.0 0.2 0.4 0.6 0.8 1.0
Simulation days Portion removed nodes
(a) MAE at different populations. (b) Graph resilience comparison.
Fig. 1: Comparison of life-time churn, BC and the real world Sality botnet graph.
Figure 1a, depicts the mean absolute error between simulated graphs and a
real world Sality snapshot obtained from [28]. The results clearly indicate, that
the graphs generated with BC are closer to the real world botnet. Furthermore,
our churn generator performs best at an overall population between 5, 500 to
6, 500. This is about twice as much as the overall population in life-time churn,
which does not allow to adapt the overall population. While the error for BC
generated botnets may still seem high, we want to point out that the error is
dominated by only two out of 13 graph properties. In fact, the average path
length and diameter are so similar throughout all graphs, that due to the nor-
malization even slight changes cause large errors. For BC at a population of
6000, the average path length is 1.7045 compared to 1.5149 in Sality and the
diameters are 2 and 3 respectively. If we remove these two outliers from the
calculation, the error drops from 27% to only 15%.
Figure 1b, compares the average resilience of the simulated graphs against
the resilience of the real world graph at its maximum and minimum population.Interestingly, the simulated networks are significantly more resilient than the real
world Sality graphs. The reasoning behind this finding is that the connections
in all graphs are made prominently through a strongly connected core. However,
the simulated graphs also have more connections among bots at the edges of
the graph, which leads to the higher resilience. We speculate, that this is largely
caused by the Goodcount mechanism of Sality and the botnet being active for
several years. Even though, the resilience of the simulated graphs are significantly
higher than the real world Sality, similar resilience has been observed for the
ZeroAccess botnet [28]. In summary, the graphs generated with BC are more
similar to the real-world graphs than those create with life-time churn.
1.0 1.0
0.8 0.8
Monitoring Resistance
Monitoring Resistance
0.6 0.6
0.4 0.4
0.2 0.2
Active pop.: 165 NLMT: 10
Active pop.: 1037 NLMT: 25
Active pop.: 1963 NLMT: 50
0.00.0 0.2 0.4 0.6 0.8 1.0 0.00.0 0.2 0.4 0.6 0.8 1.0
Graph Resilience (0.5) Graph Resilience (0.5)
(a) Active Population (b) NLMT
Fig. 2: Influence of individual parameters on monitoring resistance and resilience.
MM Design Evaluation We now investigate, the influence each parameter
has on monitoring resistance and botnet resilience. As the first parameter, we
look at the influence of the active population. The results depicted in Figure 2a
indicate, that the active population4 of the botnet has a significant impact on
its monitoring resistance. We argue that there is a two-fold reasoning behind
this behavior. First, if more highly stable nodes are available in the botnet, they
must share the in-degree of the less stable nodes and therefore, it is less likely
for an MD to be within a bot’s NL. Second, parameters such as the NL-size do
not scale with the active population. Therefore, the information contained in a
MD’s NL amounts to a significantly larger fraction of the population in small
botnets when compared to larger botnets.
Out of all MM parameters, the Neighborlist Minimum Threshold (NLMT)
has the greatest influence on the resilience of a botnet. Figure 2b, highlights this
4
The scatter plots depict all parameter variations, with one of them being highlighted.influence in a scatter plot of all simulation runs with an active population of 1963.
As the botnets with such a population size are most resistant to monitoring, we
omit other active populations in the subsequent analysis due to clarity/space
reasons. While the highest resilience obtained by botnets with an NLMT of 10
is approximately 40%, botnets with an NLMT of 50 approached a resilience of
almost 90%. However, the increase of resilience comes at the cost of decreasing
monitoring resistance (see also Section 4). As the resilience of the botnet is
evaluated based on global knowledge of the botnet, we cannot state the best value
for a botnet’s NLMT. While a low NLMT hampers the gathering of information
required to conduct an attack, a high NLMT is more likely to withstand an
attack even if a lot of information is obtained by botnet defenders.
(a) NL Reply Size (b) Overall Population
Fig. 3: Influence of individual parameters on monitoring resistance and resilience.
The effects of the Neighborlist Reply Size (NLRS) on the monitoring resis-
tance of a botnet increases with higher NLMTs. Figure 3a illustrates, that with
increased resilience the difference between an NLRS of 1 and 10 changes signif-
icantly. This growth of resilience is caused by the increasing NLMT, which is
highlighted by the colored overlays. While the difference between an NLRS of 1,
5, or 10 does not seem to have a significant influence at an NLMT of 10, it is
clear that an NLRS of 1 is superior at NLMTs of 5 and 10. We speculate, that
the reason for this is, that an NL-reply is likely to contain more entries than
the requesting bot needs. As an example, if a bot with 47 out of 50 neighbors
receives an NL-reply with 10 entries, that is seven more bots than it required to
have a full NL. Therefore, an NLRS of 1 is preferable with regard to monitoring
resistance, as no unnecessary information is shared.
Similar to the active population, the overall population greatly influences the
resilience of the botnet. Figure 3b, depicts the analysis of overall populations of
5889, 7852, and 9815 for an active population of 1963. The figure shows, thatthe resilience increases with a lower overall population. This pattern is repeated
based on different NLMTs which are highlighted by the colored overlays. We
argue, that this is caused by the increased likelihood of any node being online.
As the overall population is lesser, a node will rejoin the botnet more frequently.
The difference among the three observed churn models seems to be most
pronounced in the resilience of the botnet. Our analysis results in Figure 4a,
indicate that the botnets differ slightly with regard to resilience and monitoring
resistance. The churn models SalityV 3 followed by ZA71 create more resilient
botnets, whereas ZA65 has the highest monitoring resistance. Nevertheless, the
scaling of churn models appears to work well with only small differences between
the churn models with regard to resilience and monitoring resistance.
1.0 NLMT: 10
NLMT: 25
NLMT: 50
0.8
Monitoring Resistance
0.6
0.4
0.2
0.0
0 100 200 300 400 500
Number of MDs
(a) Churn Model (b) Multiple MDs
Fig. 4: Influence of parameters on monitoring resistance (and resilience).
The NLRP, minimally influences the monitoring resistance of a botnet. In-
terestingly, the preferable parameter value changes with growing NLMT. Our re-
sults indicate that a random selection is preferable for an NLMT of one, whereas
returning the last seen neighbors is better for NLMTs of higher values.
The range of values we analyzed for the MMI, did not show any influence on
monitoring resistance or resilience. Nevertheless, a lower MMI may reduce the
probability of a bot getting disconnected from the botnet. At the same time,
the shorter the MMI, the more communication overhead will be incurred by
the botnet. We expect that with increased message overhead, it will be easier to
detect the botnet. Therefore, any of the values is good with regard to monitoring
resistance and resilience, but may cause the botnet to be more susceptible to
detection.
In summary, we identified that among the MM parameters, NLMT and NLRS
have the greatest effect on monitoring resistance and botnet resilience. Contrary,
the MMI and NLRP exhibit only minor effects. We argue, based on our results,that a parameter combination of NLMT = 10, NLRS = 1, NLRP = random and
MMI = 1h, exhibits the most adverse conditions for monitoring. Furthermore,
our analysis of active and overall population indicates that with growing popula-
tion the monitoring resistance increases significantly. Lastly, the three evaluated
churn models showed similar behavior for the observed active populations.
Successful Monitoring in Adverse Conditions For our last experiment, we
analyzed how increasing the number of MDs influences the monitoring resistance
of a botnet. Figure 4b, presents the results of deploying multiple MDs for the
botnets with the most adverse conditions. In addition to the optimal parameter
combination identified in the previous section, we varied the NLMT to cover
the more resilient botnets as well. One can observe how an increase in MDs
results in a decreased monitoring resistance of the botnet. However, the increase
in knowledge does not increase linearly with the increase in MDs. This is the
case due to two reasons: i ) knowledge gained by adding additional MDs may
overlap with existing knowledge and therefore not add to the overall knowledge,
and ii ) the potential increase in knowledge is limited by the total population of
the botnet. Due to these factors, we can only enumerate the entire botnet for an
NLMT of 50. Moreover, this is only possible with 500 deployed MDs. However, a
fraction of the nodes remains unknown in the NLMT = 25 scenario, and almost
20% of the overall population remain undiscovered using 500 MDs in a botnet
with an NLMT of 10.
We argue, that this clearly indicates that short term monitoring, deploying
bots in controlled environments, or controlling active bots requires a large pool
of diverse IP addresses to effectively monitor botnets in adverse conditions. As
suggested by [8] and [7], this could be realized through collaboration of multiple
parties. Furthermore, network based monitoring is a promising approach, as large
amounts of bots can be observed at once without requiring a pool of IP addresses.
However, a drawback of this approach is that it requires the collaboration of
multiple ISPs which may prove to be difficult, as they are usually reluctant
about sharing private data.
7 Conclusion and Future Work
In this paper, we argue that once botnets adapt more advanced countermea-
sures, monitoring as we know it today will no longer be feasible. We defined the
term adverse conditions as a botnet environment in which any deviation from
the behavior of a regular bot can easily be detected by the botmaster. Further-
more, we investigated the idea of designing a botnet’s MM to further limit the
knowledge obtainable by monitoring.
To thoroughly analyze botnets, we discussed different churn models and pro-
pose BotChurn (BC), a novel churn generator for botnets. In our experiments,
we identified a lower boundary for intelligence gathering in adverse conditions.
In particular, our results indicate that the MM design significantly affects boththe monitoring resistance and resilience of the botnet. Finally, we conducted ad-
ditional simulations in which we aggregated the intelligence obtained by multiple
MDs, to observe how this increases the intelligence obtained via monitoring. The
results indicate, that such a distributed approach provides a way to improve the
gathered intelligence. However, this requires a significant amount of available
IP addresses. To overcome this, we suggest that future research considers the
concept of collaborative monitoring. If the defenders combine their resources,
this would increase the quality of the gathered intelligence and also reduce the
cumulative cost to conduct monitoring.
Acknowledgments
This work was supported by the German Federal Ministry of Education and
Research (BMBF) and by the Hessen State Ministry for Higher Education, Re-
search and the Arts (HMWK) within CRISP. The research leading to these
results has also received funding from the European Union’s Horizon 2020 Re-
search and Innovation Program, PROTECTIVE, under Grant Agreement No
700071 and the Universiti Sains Malaysia (USM) through Short Term Research
Grant, No: 304/PNAV/6313332.
References
[1] Greengard, S.: The war against botnets. Communications of the ACM 55(2)
(2012) 16
[2] Andriesse, D., Rossow, C., Stone-Gross, B., Plohmann, D., Bos, H.: Highly Re-
silient Peer-to-Peer Botnets Are Here: An Analysis of Gameover Zeus. In: Inter-
national Conference on Malicious and Unwanted Software. (2013)
[3] Falliere, N.: Sality: Story of a peer-to-peer viral network. Technical report, Syman-
tec Corporation (2011)
[4] Rossow, C., Andriesse, D., Werner, T., Stone-gross, B., Plohmann, D., Dietrich,
C.J., Bos, H., Secureworks, D.: P2PWNED: Modeling and Evaluating the Re-
silience of Peer-to-Peer Botnets. In: Symposium on Security & Privacy, IEEE
(2013)
[5] Karuppayah, S., Vasilomanolakis, E., Haas, S., Muhlhauser, M., Fischer, M.:
BoobyTrap: On autonomously detecting and characterizing crawlers in P2P bot-
nets. 2016 IEEE International Conference on Communications, ICC 2016 (2016)
[6] Vasilomanolakis, E., Wolf, J.H., Böck, L., Karuppayah, S., Mühlhäuser, M.: I trust
my zombies: A trust-enabled botnet. arXiv preprint arXiv:1712.03713 (2017)
[7] Andriesse, D., Rossow, C., Bos, H.: Reliable Recon in Adversarial Peer-to-Peer
Botnets. In: Internet Measurement Conference, ACM (2015)
[8] Karuppayah, S.: Advanced monitoring in P2P botnets. PhD thesis, Technische
Universität Darmstadt (2016)
[9] Maymounkov, P., Mazieres, D.: Kademlia: A peer-to-peer information system
based on the XOR metric. In: Peer-to-Peer Systems. Volume 2429 of LNCS.
Springer (2002)
[10] Holz, T., Steiner, M., Dahl, F., Biersack, E., Freiling, F.: Measurements and
Mitigation of Peer-to-Peer-based Botnets: A Case Study on Storm Worm. LEET
(2008)[11] Salah, H., Strufe, T.: Capturing connectivity graphs of a large-scale p2p overlay
network. In: Distributed Computing Systems Workshops (ICDCSW), 2013 IEEE
33rd International Conference on. (2013)
[12] Neville, A., Gibb, R.: ZeroAccess Indepth. Technical report (2013)
[13] Karuppayah, S., Fischer, M., Rossow, C., Muhlhauser, M.: On Advanced Moni-
toring in Resilient and Unstructured P2P Botnets. In: International Conference
on Communications, IEEE (2014)
[14] Yan, J., Ying, L., Yang, Y., Su, P., Li, Q., Kong, H., Feng, D.: Revisiting Node
Injection of P2P Botnet. In: Network and System Security. Volume 8792 of Lecture
Notes in Computer Science. (2014) 124–137
[15] Karuppayah, S., Roos, S., Rossow, C., Mühlhäuser, M., Fischer, M.: ZeusMilker:
Circumventing the P2P Zeus Neighbor List Restriction Mechanism. In: Interna-
tional Conference on Distributed Computing Systems, IEEE (2015) 619–629
[16] Gu, G., Perdisci, R., Zhang, J., Lee, W., et al.: Botminer: Clustering analysis
of network traffic for protocol-and structure-independent botnet detection. In:
USENIX security symposium. Volume 5. (2008) 139–154
[17] Narang, P., Ray, S., Hota, C., Venkatakrishnan, V.: Peershark: detecting peer-
to-peer botnets by tracking conversations. In: Security and Privacy Workshops
(SPW), 2014 IEEE, IEEE (2014) 108–115
[18] Böck, L., Karuppayah, S., Grube, T., Mühlhäuser, M., Fischer, M.: Hide And Seek:
Detecting Sensors in P2P Botnets. In: Communications and Network Security,
IEEE (2015) 731–732
[19] Page, L., Brin, S., Motwani, R., Winograd, T.: The PageRank citation ranking:
bringing order to the Web. (1999)
[20] Kleissner, P.: Me Puppet Master: Behind the scenes of crawling P2P botnets.
(2014)
[21] Adrian, D., Durumeric, Z., Singh, G., Halderman, J.A.: Zippier zmap: Internet-
wide scanning at 10 gbps. In: WOOT. (2014)
[22] Wyke, J.: The ZeroAccess Botnet – Mining and Fraud for Massive Financial Gain.
Technical Report September, Sophos (2012)
[23] Surati, S., Jinwala, D.C., Garg, S.: A survey of simulators for p2p overlay net-
works with a case study of the p2p tree overlay using an event-driven simulator.
Engineering Science and Technology, an International Journal (2017)
[24] Stingl, D., Gross, C., Rückert, J., Nobach, L., Kovacevic, A., Steinmetz, R.: Peer-
factsim.kom: A simulation framework for peer-to-peer systems. In: High Perfor-
mance Computing and Simulation (HPCS), IEEE (2011) 577–584
[25] Baumgart, I., Heep, B., Krause, S.: Oversim: A scalable and flexible overlay frame-
work for simulation and real network applications. In: Peer-to-Peer Computing,
IEEE (2009) 87–88
[26] Stutzbach, D., Rejaie, R.: Understanding Churn in Peer-to-Peer Networks. In:
ACM SIGCOMM Conference on Internet Measurement. (2006) 189–201
[27] Yao, Z., Leonard, D., Wang, X., Loguinov, D.: Modeling heterogeneous user churn
and local resilience of unstructured p2p networks. In: International Conference on
Network Protocols (ICNP), IEEE (2006) 32–41
[28] Haas, S., Karuppayah, S., Manickam, S., Mühlhäuser, M., Fischer, M.: On the
resilience of p2p-based botnet graphs. In: Communications and Network Security
(CNS), IEEE (2016) 225–233You can also read