Linking genome size variation to population phenotypic variation within the rotifer, Brachionus asplanchnoidis - Nature
←
→
Page content transcription
If your browser does not render page correctly, please read the page content below
ARTICLE
                  https://doi.org/10.1038/s42003-021-02131-z                  OPEN

                  Linking genome size variation to population
                  phenotypic variation within the rotifer, Brachionus
                  asplanchnoidis
                  Claus-Peter Stelzer              1 ✉,   Maria Pichler1 & Anita Hatheuer1

                  Eukaryotic organisms usually contain much more genomic DNA than expected from their
                  biological complexity. In explaining this pattern, selection-based hypotheses suggest that
                  genome size evolves through selection acting on correlated life history traits, implicitly
1234567890():,;

                  assuming the existence of phenotypic effects of (extra) genomic DNA that are independent
                  of its information content. Here, we present conclusive evidence of such phenotypic effects
                  within a well-mixed natural population that shows heritable variation in genome size. We
                  found that genome size is positively correlated with body size, egg size, and embryonic
                  development time in a population of the monogonont rotifer Brachionus asplanchnoidis. The
                  effect on embryonic development time was mediated partly by an indirect effect (via egg
                  size), and a direct effect, the latter indicating an increased replication cost of the larger
                  amounts of DNA during mitosis. Our results suggest that selection-based change of genome
                  size can operate in this population, provided it is strong enough to overcome drift or
                  mutational change of genome size.

                  1 University   of Innsbruck, Mondseestr. 9, 5310 Mondsee, Austria. ✉email: claus-peter.stelzer@uibk.ac.at

                  COMMUNICATIONS BIOLOGY | (2021)4:596 | https://doi.org/10.1038/s42003-021-02131-z | www.nature.com/commsbio   1
ARTICLE                                                               COMMUNICATIONS BIOLOGY | https://doi.org/10.1038/s42003-021-02131-z

E
       ukaryotic organisms display enormous variations in genome           controlling cell size, and they point to an abundance of cell-cycle
       size, with haploid nuclear DNA contents ranging from 2.3            control genes that would render “nucleotypic control” of cell size
       million base pairs in the microsporidian Encephalitozoon            unnecessary21. In summary, selection-based explanations of
intestinalis1 to 152 billion base pairs in the monocot plant Paris         genome size are widespread and popular, but the evidence for
japonica2. Closely related species may differ substantially in their       nucleotypic effects still faces some caveats and limitations.
genome size, often by an order of magnitude3–6. Even intraspe-                Some of these limitations can be overcome by studying evo-
cific genome size variation has been described, among geo-                  lutionarily recent changes in genome size, for instance, variation
graphically isolated populations3,7,8, among lab strains of model          among subpopulations along geographic or altitudinal clines32.
organisms9,10, and in a few cases, within geographic                       Nevertheless, gene flow is typically reduced between such popu-
populations11,12. On a mechanistic level, such genome size var-            lations, thus the above limitations mentioned still exist, even
iations can be often attributed to variable proportions of repeti-         though to a lesser degree than in interspecific comparisons. To
tive DNA, in particular transposons4,13–15. Even though the                our knowledge, no study has yet convincingly shown that heri-
number of genes scales positively with genome size across the              table within-population genome size variation significantly cov-
domain Eukaryota13, most species, and especially those with large          aries with traits that are mechanistically associated with
genomes, carry much more genomic DNA in their nuclei than                  individual fitness (see, p. 34 in21). Such correlations, if they exist
expected from their biological complexity and evolved                      in a well-mixed natural population, would provide a much
functions16. Overall, the question as to why some eukaryotic               stronger case for nucleotypic effects, because confounding
genomes are streamlined, while others reach staggering sizes, still        through different genetic backgrounds is avoided. Genetic varia-
lacks a clear answer13.                                                    tion affecting the phenotype should be randomized across dif-
   Current hypotheses on genome size evolution in Eukaryotes               ferent genome size classes (e.g., large, medium, or small genome
strongly differ in their emphasis on the evolutionary forces of            size), thus avoiding biases in the genetic background among
mutation, selection, and drift. Theories focusing on mutations             population members. Here we use the monogonont rotifer Bra-
state that the genome size of a species represents a long-term             chionus asplanchnoidis, which allows to address such issues on a
equilibrium of mutations that increase and decrease genome size,           population level.
by either referring to small indels (17,18, but see19), or to the             Monogonont rotifers are small metazoans, few hundred
dynamics of transposable elements20. Variation among taxa is               micrometers in size, found in fresh and brackish water habitats
considered the result of biases in mutational rates, such that             throughout the world. They have a facultatively parthenogenetic
organisms with smaller genome sizes are able to remove DNA at              life cycle, which involves several generations of asexual repro-
faster rates than organisms with large genome size. In contrast,           duction, via ameiotic parthenogenesis, followed by occasional
the mutational hazard hypothesis prioritizes drift as the main             episodes of sex. In the genus Brachionus, sex is induced by pro-
evolutionary force shaping genome size variation in                        teins excreted upon population crowding, which trigger the
eukaryotes21,22. It assumes a constant influx of mutations that             production of mictic females and haploid males, which mate with
increase genome size, which imposes a mutational hazard by                 each other and produce sexually recombined resting eggs. A
increasing the genomic target size to deleterious mutations (in            rotifer clone refers to the asexual descendants of a single resting
particular, harmful gain-of-function mutations). According to              egg, thus each clone is a unique genotype. In lab cultures, it is
this hypothesis, variation in genome size mainly stems from                possible to suppress sexual reproduction by frequent dilution
differences in effective population size (hence, drift) among taxa.        intervals or large culture volumes, allowing the propagation of a
Large amounts of non-coding DNA may accumulate in small                    rotifer clone for hundreds of asexual generations. Likewise, by
populations through drift, while at large population size this             inducing mixis in small culture volumes, males and mictic
process is prevented by selection. Finally, selection-based                females from two different clones can be crossed with each other
hypotheses23,24 emphasize that genome size could be indirectly             to produce outcrossed offspring, or mated within a clone, which
selected through its correlations with various phenotypic traits.          is genetically equivalent to selfing.
Selection-based hypotheses allow for scenarios in which nuclear               In the present study, we focus on a population of B.
DNA content is optimized. Even additions of non-coding DNA                 asplanchnoidis from Obere Halbjochlacke (OHJ), a shallow
might sometimes be beneficial if they shift nuclear DNA content             alkaline lake in Eastern Austria. Recent studies have shown that
closer to an optimum level, while in other cases, genome                   this population harbors substantial and heritable within-
streamlining might occur25. In analogy to the term “genotype”,             population genome size variation8,11. Clones can be crossed
Bennett26 coined the term “nucleotype”, and nucleotypic effects,           with each other—even if they substantially differ in genome size.
referring to those phenotypic effects of DNA that are independent          Genome size can be selected up or down by crossing individuals
of its information content.                                                at the upper or lower end of the genome size distribution11.
   Nucleotypic effects imply that genome size causally determines          Genome size variation in the OHJ-population is mediated by
cell size and/or other life-history traits such as developmental           relatively large genomic elements (several megabases in size),
rates and body size26,27. The main evidence in favor of this               which segregate independently during meiosis and can thus be
consists of ubiquitous correlations between genome size and                recombined to produce offspring that are variable in genome size.
different life-history traits in a variety of organisms28,29. How-         More recently, it has been demonstrated that these independently
ever, correlation does not imply causation, and much of this               segregating elements consist of tandemly repeated satellite DNA,
evidence actually involves distantly related lineages, sometimes           with only few interspersed genes or other sequences33. This
different genera, or even orders30. Such evolutionary units are            strongly suggests that the extra DNA that is segregating in the
probably separated by tens to hundreds of millions of years and            OHJ-population has rather low information content.
can be expected to differ in many aspects other than genome size.             In the present study, we took advantage of this natural genome
Proponents of selection-based explanations cite polyploidy/                size variation and investigate whether genome size correlates with
chromatin diminution (i.e., programmed elimination of DNA                  a variety of phenotypic traits, such as body size, egg size,
during somatic cell divisions) as additional evidence for a causal         embryonic development time, asexual population growth, and the
link, because such mechanisms usually increase/decrease cell size          propensity for sexual reproduction. To this end, we analyzed
within and among individuals23,31. However, opponents argue                body size and egg size variation in 141 genotypes of the OHJ-
that such patterns could also be caused by dosage effects of genes         population, which were either sampled directly as resting eggs or

2                         COMMUNICATIONS BIOLOGY | (2021)4:596 | https://doi.org/10.1038/s42003-021-02131-z | www.nature.com/commsbio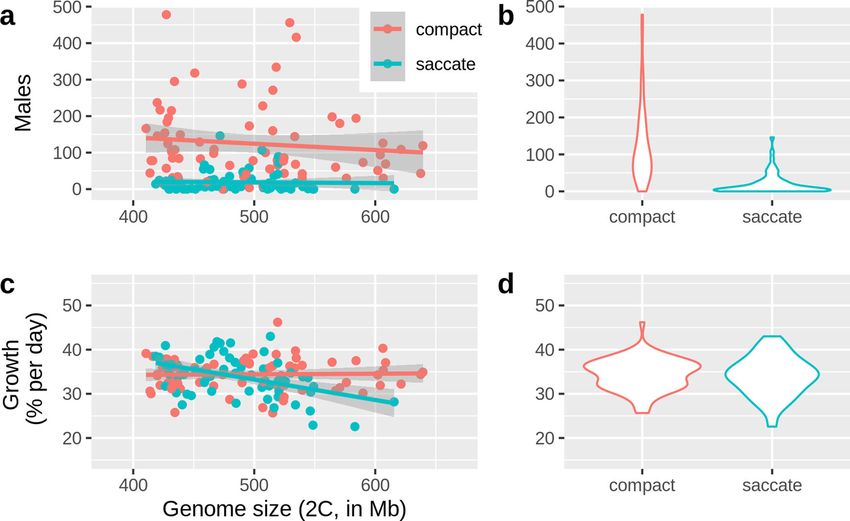
COMMUNICATIONS BIOLOGY | https://doi.org/10.1038/s42003-021-02131-z ARTICLE
Fig. 1 Relationship between genome size and morphotype on body and egg size. a Correlation between genome size and body size (body volume in 106
femtoliters) in 141 rotifer clones (c.f., Supplementary Data 2); b Correlation between genome size and egg size (egg volume in 106 fl); c Representative
photographs of the two morphs (Scale bars are 100 μm); d the two morphotypes could be distinguished by shape parameters using principle components
analysis (here shown as a density plot, due to a large number of data points; see Supplementary Fig. 3 for display of individual clones and factor loadings).
Source data of this figure are provided in Supplementary Data 1 and 2.
their outcrossed offspring. Genotypes were cultured clonally 0.031). Combining the data of the two morphs resulted in a
throughout this study and their genome sizes ranged from 414 to significant correlation between genome size and EDT (r15 =
639 Mb (mega bases, 2C value). In the same set of clones, we 0.538, p = 0.026, Fig. 2a). Since egg size was positively correlated
gathered data on asexual population growth and sexual pro- with genome size (Fig. 1b), we used path analysis to distinguish
pensity. In a subset of 17 clones, we additionally measured the between a direct effect of genome size on EDT and an indirect
embryonic development time. Our overall goal was to test whe- effect (i.e., an effect of genome size on EDT via egg size). In our
ther within-population genome size variation correlates with any dataset, the direct effect was about three times stronger than the
of these phenotypic traits. indirect effect (Fig. 2c, Supplementary Table 1). A small pro-
portion of eggs did not hatch during the experiment (1.9%, n =
Results 40). These unhatched eggs were not different from viable (i.e.,
Size measurements. Egg volumes and body volumes spanned a hatched) eggs in terms of their size (Supplementary Fig. 5). By
two- and four-fold range, respectively, from 0.8 to 1.8 × 10⁶ fem- contrast, the few occasionally picked male eggs (0.9%, n = 18),
toliters (fl) in the egg volumes, and 5–20 × 106 fl in the body which are considerably smaller in volume, took almost 20%
volumes. This large variation was mostly caused by two discrete longer to hatch, compared to the mean EDTs of females of the
morphotypes present in the population, a larger “saccate” morph same respective clone (Supplementary Fig. 5).
and a smaller “compact” morph. The discovery of these morphs
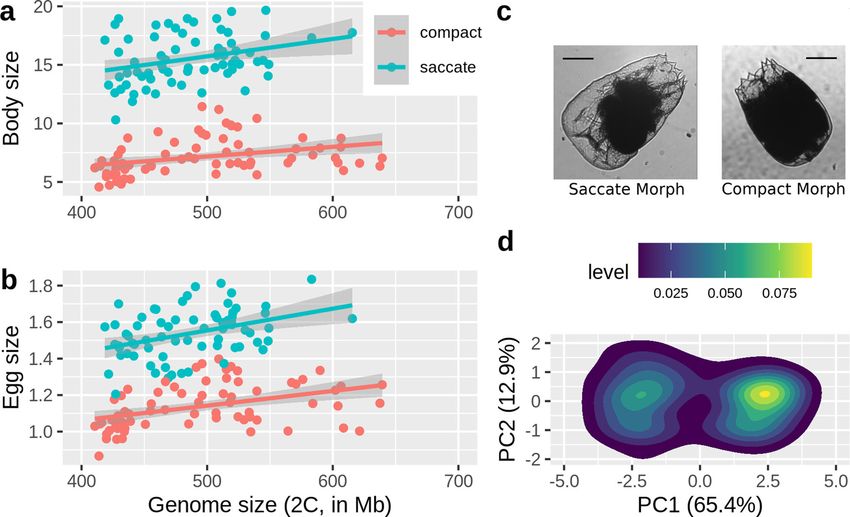
was unexpected, but they could be distinguished by eye using light Population growth and sexual propensity. Finally, we checked
microscopy, or classified with principal components analysis, solely whether genome size or morphotype affected sexual propensity
based on their body shape (Fig. 1, Supplementary Fig. 3, Supple- (measured as the number of males produced by a clonal culture)
mentary Data 1, 2). Using the first principal component, we clas- and population growth rate (Fig. 3). While genome size did not
sified 69 clones in our dataset as saccate (threshold: PC1 < 0) and 72 affect sexual propensity, we observed a strong difference in
clones as compact (PC1 > 0). Both morphotypes were found across between the two morphs, with the compact morph producing
the entire spectrum of genome sizes (Fig. 1). Within morphotype, significantly more males than the saccate morph (Fig. 3a and b,
all correlations between genome size and body size, or egg size, were Supplementary Table 2). In contrast, morphotype did not affect
significant (Body size/saccate: r67 = 0.31, p = 0.011; body size/ population growth up to a genome size of ~500 Mb, but popu-
compact: r70 = 0.34, p = 0.0035; egg size/saccate: r67 = 0.38, p = lation growth significantly decreased with genome size in the
0.0012; egg size/compact: r70 = 0.43, p = 0.0001). Egg size and body saccate morph (Fig. 3c and d, Supplementary Table 3).
size were also significantly correlated with each other in both
morphs (compact: r70 = 0.82, p < 0.0001, saccate: r67 = 0.7, p < Discussion
0.0001, Supplementary Fig. 4). In this study, we provided evidence that genome size in B.
asplanchnoidis positively correlates with body size, egg size, and
Embryonic development time. Morphotype did not significantly embryonic development time (EDT). To our knowledge, this is
affect embryonic development time (EDT), but genome size did the first demonstration of such correlations in a well-mixed
(Morphotype: F1 = 0.016, p = 0.899; genomesize: F1 = 5.73, p = natural population with heritable variation in genome size. Earlier
COMMUNICATIONS BIOLOGY | (2021)4:596 | https://doi.org/10.1038/s42003-021-02131-z | www.nature.com/commsbio 3ARTICLE COMMUNICATIONS BIOLOGY | https://doi.org/10.1038/s42003-021-02131-z Fig. 2 Relationship between genome size on embryonic development time (EDT). a Genome size in 17 clones of the OHJ-population is positively correlated with average EDT. Shaded regions are the 95% confidence intervals. b Correlation between egg size and EDT, based on measurements of 2010 amictic eggs (Supplementary Data 3). c Path diagram showing direct and indirect effects (i.e., via egg size) of genome size on embryonic development time. The results of the underlying structural equation model are displayed in Supplementary Table 1. Source data of this figure are provided in Supplementary Data 3. Fig. 3 Relationships between genome size and morphotype on sexual propensity and population growth rate. a Sexual propensity (number of males produced in dense clonal cultures) was not significantly correlated with genome size (n = 141 clones); b Morphotypes differed in sexual propensity, as the compact morph produced significantly more males than the saccate morph (p < 0.001, Supplementary Table 2); c Population growth rates were significantly reduced at higher genome sizes in the saccate morph (p < 0.05, Supplementary Table 3). d The two morphotypes did not differ in growth rate. Source data of this figure are provided in Supplementary Data 4. 4 COMMUNICATIONS BIOLOGY | (2021)4:596 | https://doi.org/10.1038/s42003-021-02131-z | www.nature.com/commsbio
COMMUNICATIONS BIOLOGY | https://doi.org/10.1038/s42003-021-02131-z                                                                  ARTICLE

studies on the OHJ-population confirm our assumption that it is                 They include discrete morphotypes, with variation in body
genetically homogeneous, showing neither signs of genetic sub-                 appendages, presence/absence of anterior or posterior spines, or
division nor presence of cryptic species using molecular markers               different body shapes. Such morphotypes often persist over many
and barcoding genes8,34. Moreover, population members could be                 asexual generations, suggesting some form of epigenetic
readily crossed with each other8,11. Population growth was also                inheritance41. Morphotypes can additionally differ in physiolo-
slower at larger genome sizes, but only in the saccate morph                   gical characteristics, for example sex-induction41, which was also
(Fig. 3c, Supplementary Table 3), possibly in part due to the                  found in our study (Fig. 3b). Currently, we can only speculate
slowed embryonic development of individuals with larger gen-                   about the adaptive significance of the two morphs. We suspect
omes. The fact that we only observed this effect when the large                that they might be adaptations to different environmental con-
morph was combined with large genome size might indicate that                  ditions (e.g., different predators, salinity), but further studies are
strong deviations in body size are deleterious and would be                    needed to establish this. Overall, the relationship between genome
selected against. However, these measurements have been done in                size and both body size and egg size was nearly the same in both
a benign laboratory environment, and under natural conditions                  morphs.
there could be situations where large body size is advantageous.                  There are a few studies that have addressed genome size var-
   Nucleotypic effects on body size are particularly plausible for             iation in populations and their phenotypic correlates, but with a
rotifers, which are eutelic and consist of ~1000 cells35. If cell size         slightly different approach. Huang et al.10 examined genome size
increases with genome size, body size should increase as well                  variation in the Drosophila melanogaster Genetic Reference Panel
(unless there were fundamental constraints on maximum body                     (DGRP), a collection of 205 inbred lines that derive from a nat-
size). Average cell size is difficult to quantify in rotifers since many        ural population. Mated females were collected from the field and
tissues are syncytial in adults. However, egg volume might serve as            subjected to 20 generations of full-sib mating in the laboratory.
a proxy for cell size, and thus allow comparisons among clones as              Thus, the DGRP contains a representative sample of naturally
asexual eggs are extruded before cleavage division. Consistently,              segregating variation, but the high inbreeding coefficient of 0.986
egg size was correlated with genome size, and there was also a                 predicts that most loci will be homozygous, including the many
strong correlation between egg size and body size across our                   insertion (+) and deletion (−) alleles across the genome whose
studied clones (Supplementary Fig. 4). In non-eutelic organisms,               net number ultimately determines the genome size of an indivi-
correlations between genome size and body size are expected to be              dual. Thus, we expect fixation of most (−) alleles in strains with
weaker, since variation in cell number among individuals might                 the smallest genomes and fixation of most (+) alleles in strains
blur the relationship between genome size and body size.                       with the largest genomes. Such individuals/genotypes are not very
   We also found that genome size correlates positively with EDT,              likely to occur in an outbred heterozygous natural population. In
another important life-history variable. EDT accounts for ~7% of               a follow up study, Ellis et al.42 selected 50 lines representing the
the ~10-day life span in this species36,37. Two mechanistic                    25 of the largest and 25 smallest genomes from the DGRP,
pathways might be responsible for the prolonged duration of                    measured life history traits in all 50 of these lines. Thus, they only
EDT at larger genome sizes, a direct effect, and an indirect effect            worked with the most extreme genome sizes. While this among-
via egg size. In many animals, EDT is positively correlated with               line genome size variation ultimately stems from structural var-
egg size across a wide range of temperatures, indicating a uni-                iants that were already present in the original population, among-
versal physiological constraint38. Such an indirect effect via egg             line variation in genome size is probably much higher than
size was also present in B. asplanchnoidis, however, the direct                among-individual variation in a natural population. The DGRP
effect was about three times stronger. Theoretically, this direct              approach offers greater resolution of genome size—phenotype
effect can be attributed to an increased replication cost of the               connections than is possible with studies of wild individuals, and
larger amounts of DNA during mitosis26. In the future, detailed                indeed this study uncovered some interesting phenotypic
experiments on the embryological development of large vs. small                correlates42. However, applying these genome size—phenotype
genomes might clarify the exact cellular mechanism.                            relationships to the original population is not straight forward
   Genome size is certainly not the only factor determining body               due to the inbred history. In our study, clones represent the
size in this population. In most animals, body size or weight                  natural genotypes and nucleotypes, with essentially the same level
shows significant heritability39, so it is reasonable to assume that            of heterozygosity as in the field population. Thus, a correlation
this trait might also be under polygenic control in B. asplanch-               between genome size and a phenotypic trait can be directly
noidis as well. However, such genetic variation should be ran-                 applied to the population, especially since genome size is inher-
domized across genome sizes in this well-mixed population.                     ited like a quantitative trait with a heritability of 111.
Sexual dimorphism is another source of phenotypic variation:                      Another recent study on flies examined whether long-term
rotifer males are typically much smaller than females, which is                phenotype selection results in genome size differences between
consistent with the fact that they are haploid. However, the longer            lines that experienced contrasting selection regimes43. Lines
EDT of male eggs (this study, and40) at first sight appears to                  selected for fast/slow development did not change in genome size
contradict the relationship between genome size and EDT in                     as expected (i.e., decreasing/increasing in genome size), instead
female eggs, which contain twice as much DNA than male eggs.                   they all converged to the same mean genome size, but with
We suspect that this is due to additional processes/delays specific             reduced genome size variation compared to the founding popu-
to male development. Within male eggs, we would expect that                    lations. Likewise, selection for body size did not result in sig-
EDT increases with genome size. An examination of this possi-                  nificant differences among lines in outbred selection lines
bility would require measurements of genome size in individual                 maintained at large effective population size. However, isolines
males, since male genome size can vary even within a clone due to              derived from such populations after ten generations of full-sib
meiotic segregation of the elements that cause genome size var-                mating experienced greatly increased genome size variation and
iation in this species11.                                                      “bloating” of genome size in several individuals. This observation
   Morphotype (“saccate” versus “compact”) is an additional                    closely resembles the pattern of increased genome size variation in
variable affecting body size in B. asplanchnoidis. We currently do             the DGRP lines (discussed above), and it matches our own
not know the mechanism that causes these two morphs - it might                 observations in B. asplanchnoidis, where repeated selfing can lead
be either genetic or epigenetic. Interestingly, non-genetic poly-              to surprisingly high genome size variation and to increases in
morphisms have been documented in several rotifer species41.                   genome size compared to the founding individual (see Fig. 3 in11).

COMMUNICATIONS BIOLOGY | (2021)4:596 | https://doi.org/10.1038/s42003-021-02131-z | www.nature.com/commsbio                                        5
ARTICLE                                                                         COMMUNICATIONS BIOLOGY | https://doi.org/10.1038/s42003-021-02131-z

Our tentative conclusion is that patterns in genome size derived                      we analyzed body size and egg sizes of 141 different B. asplanchnoidis clones. Some
from highly inbred lines might not be representative for genome                       of our rotifer clones directly hatched from the natural population, while others
                                                                                      were the sexual (outcrossed) offspring of the founders in the F1 or F2 generation11.
size evolution in a natural population. Even though such obser-                       Three independent preparations on different dates were made for each clone,
vations are highly interesting and potentially informative about                      which consisted of collecting ~20 adult females with two attached asexual eggs
the basic mechanisms of genome size variation, we decided to not                      from stock cultures, exactly one week after re-inoculation and growth at 18 °C.
include selfed lines in our present study.                                            Rotifers were fixed in Lugol’s solution, and eggs were detached from the females by
   Finally, one might argue that there are many studies on B-                         vigorously vortexing the fixed sample for three minutes. Eggs and females were
                                                                                      then collectively transferred into a well of a 96-well plate (Greiner, no. 655096).
chromosomes and their correlations with phenotypic traits (e.-                        Each well was carefully topped off with culture medium and covered with a
g.,44–46), which might also qualify as evidence for a genome size—                    microscopic coverslip. Body sizes and egg sizes were determined using a custom-
phenotype relationship. B-chromosomes are one possible mani-                          made digital image analysis system, which used custom algorithms written in the
festation of intraspecific genome size variation, in which extra                       NI Labview and NI Vision software packages (National Instruments) for con-
                                                                                      trolling hardware, image acquisition, and image processing (for details, see Sup-
DNA is organized into accessory chromosomes rather than as                            plementary Methods and Supplementary Figs. 1, 2). Body and egg volumes were
insertions/deletions to the normal chromosomes. Thus, it may be                       calculated from length and width measurements by approximating the shape of an
tempting to consider the number of B-chromosomes in those                             ellipsoid (main axis = length).
studies as a proxy for genome size and to interpret these corre-
lations accordingly. However, B-chromosome numbers can be                             Embryonic development time. Embryonic development times were measured in a
very misleading. For example, in maize extra DNA can be present                       subset of 17 rotifer clones, which were selected to represent the genome size range
                                                                                      of the natural OHJ-population (404–552 Mb). We quantified the duration of
as B-chromosomes and/or chromosomal knobs, which are large                            embryonic development, i.e., the time from egg extrusion until hatching, using a
heterochromatic regions on normal chromosomes. Intraspecific                           time-lapse recording system, which was a modified version of our image analysis
genome size variation between cultivars or across altitudinal                         system mentioned above (see Supplementary Methods and55). With this setup, we
clines is mainly mediated by chromosomal knob content32,47, yet                       could simultaneously follow the hatching phenology of up to 96 embryos over the
                                                                                      course of one day. Production of eggs, as well as checks for hatching, were confined
surprisingly, Bs and knob content are often inversely correlated48.                   to 30 min-intervals. For each of the 17 rotifer clones, the hatching times of 96–141
Thus, while studies on B-chromosome variation are certainly                           asexual eggs were recorded.
interesting in their own right, simple extrapolations from the
number of Bs towards genome size are not appropriate. To make                         Population growth and sexual propensity. We also obtained estimates of clonal
inferences about the effects of extra DNA, there seems to be no                       population growth and of the propensity of clones to induce sex. This was also
way around directly measuring genome size.                                            done along our earlier measurement campaign of genome size variation while
                                                                                      growing biomass for flow-cytometric measurements11. Briefly, 1-L culture flasks
   In this study, we provide conclusive evidence that additional                      were inoculated with 60–300 females (depending on preliminary screens of
DNA, which is present in the genome of some individuals of a                          population growth in the stock cultures), with each female carrying two asexual
population but missing in others, exhibits nucleotypic effects. In                    eggs, and they were allowed to grow for seven days. Three replicates per clone were
B. asplanchnoidis, this additional DNA is largely non-coding,                         used. After 1 week, two 1 ml samples were taken from the well-mixed culture, and
mainly consisting of tandem repeats of satellite DNA with only                        females and male rotifers were counted. Population growth was calculated as (ln Nt
                                                                                      − lnN0)/t, where N0 and Nt represent the number of females at inoculation and
few interspersed genes33. This suggests that the studied popula-                      after 1 week, respectively. The number of males in the three 1 + 1ml-samples
tion meets the basic requirements for genome size to be selected                      served as a measure of sexual propensity.
up or down, indirectly, through its correlations with several
important life-history traits. So far, model organisms allowing                       Statistics and reproducibility. All statistical analyses were done in R (v4.0.2,56).
such a population genetic perspective have been missing in the                        During initial data exploration, it became obvious that the OHJ-population con-
literature. In this regard, Brachionid rotifers are very suitable for                 sisted of two discrete morphotypes, which differed in size and shape (a larger
                                                                                      “saccate” and a smaller “compact” morph). To objectively identify these two
even experimental approaches, owing to their short generation                         morphs, we used principle components analysis on rotifer body shape with the
times and ease of culture49,50. In addition, genomic tools are                        function prcomp. For graphical visualization we used the package ggfortify57 and its
becoming increasingly available for these species15,51–53. Future                     function autoplot. The input variables for PCA consisted of eight different (size-
investigations in this system could address selection-based                           independent) shape parameters, which we obtained through automated particle
                                                                                      measurements implemented in the NI Vision software package (for more details,
mechanisms in more detail experimentally, and allow to quan-                          see Supplementary Methods). For example, the so-called compactness factor relates
tify their relative importance and interactions with mutational- or                   the area of a particle (i.e., the binarized picture of a rotifer) to the area of its
drift-based mechanisms, in order to explain genome size evolu-                        bounding rectangle. We calculated PCAs for two levels of data aggregation, on
tion over (micro-) evolutionary time spans.                                           clone means (n = 141) and on measurements of each individual female (n = 5644).
                                                                                      Pearson correlation tests of genome size vs. body size, egg size, and embryonic
                                                                                      development time were done in the standard module of R with the function cor.
Methods                                                                               test. To disentangle a direct effect of genome size on embryonic development time
Origin of clones and culture conditions. Resting eggs of rotifers were collected in   from an indirect effect (i.e., via egg size), we carried out path analysis using the R-
autumn 2011 from the sediments of OHJ, a small alkaline playa lake in Eastern         package lavaan58 and semPlot59. The effects of morphotype or genome size on
Austria (N 47°47′11″, E 16°50′31″). Animals were kept as clones, which consist of     sexual propensity (=number of males in dense populations) and population
the asexual descendants of an individual female that originally hatched from a        growth were examined using generalized linear models, using the functions glm.nb
single resting egg. Since resting eggs are produced sexually in Monogonont            (MASS package,60) and glm with negative binomial and quasibinomial error
rotifers35, each clone is a unique genotype. All clones have been characterized       structures, respectively.
previously with regard to their genome size, and we use the same nomenclature as
in this earlier publication11.                                                        Reporting summary. Further information on research design is available in the Nature
    Rotifers were cultured in F/2 medium54 at 16 ppt salinity and with Tetraselmis    Research Reporting Summary linked to this article.
suecica algae as food source (500–1000 cells μl−1). Continuous illumination was
provided with daylight LED lamps (SunStrip, Econlux) at 30–40 µmol quanta m−2
s−1 for rotifers, and 200 µmol quanta m−2 s−1 for algae. Stock cultures were kept     Data availability
either at 18 °C, re-inoculated once per week by transferring 20 asexual females to    The data supporting the findings of this study are available within the article and their
20 ml fresh culture medium, or they were kept for long-term storage at 9 °C,          Supplementary Data files. The source data underlying Figs. 1–3 are provided in
replacing approximately 80% of the medium with fresh food suspension every            Supplementary Data 1-4. All other data are available from the corresponding author
4 weeks.                                                                              upon reasonable request.

Size measurements. All body and egg size measurements took place soon after a         Received: 2 November 2020; Accepted: 19 April 2021;
clonal culture had been established, usually within 1–2 months after hatching from
the resting egg. The entire measurement campaign lasted for three years and
accompanied measurements on genome size variation in this population11. In total,

6                               COMMUNICATIONS BIOLOGY | (2021)4:596 | https://doi.org/10.1038/s42003-021-02131-z | www.nature.com/commsbio
COMMUNICATIONS BIOLOGY | https://doi.org/10.1038/s42003-021-02131-z ARTICLE
References 32. Bilinski, P. et al. Parallel altitudinal clines reveal trends in adaptive evolution
1. Corradi, N., Pombert, J. F., Farinelli, L., Didier, E. S. & Keeling, P. J. The of genome size in Zea mays. PLOS Genet. 14, e1007162 (2018).
complete sequence of the smallest known nuclear genome from the 33. Stelzer, C.-P. et al. Genome structure of Brachionus asplanchnoidis, a
microsporidian Encephalitozoon intestinalis. Nat. Commun. 1 (2010). Eukaryote with intrapopulation variation in genome size. bioRxiv,
2. Pellicer, J., Fay, M. F. & Leitch, I. J. The largest eukaryotic genome of them all? 2021.2003.2009.434534, https://doi.org/10.1101/2021.03.09.434534 (2021).
Botanical J. Linn. Soc. 164, 10–15 (2010). 34. Mills, S. et al. Fifteen species in one: deciphering the Brachionus plicatilis
3. Jeffery, N. W., Hultgren, K., Chak, S. T. C., Gregory, R. & Rubenstein, D. R. species complex (Rotifera, Monogononta) through DNA taxonomy.
Patterns of genome size variation in snapping shrimp. Genome 59, 393–402 Hydrobiologia 1–20, https://doi.org/10.1007/s10750-016-2725-7 (2016).
(2016). 35. Nogrady, T., Wallace, R. L. & Snell, T. W. Rotifera: Biology, Ecology and
4. Naville, M. et al. Massive changes of genome size driven by expansions of non- Systematics. Vol. 1 (SPB Academic Publishing, 1993).
autonomous transposable elements. Curr. Biol. 29, 1161 (2019). -+. 36. Sun, Y. et al. Trade-off between reproduction and lifespan of the rotifer
5. Stelzer, C.-P., Riss, S. & Stadler, P. Genome size evolution at the speciation Brachionus plicatilis under different food conditions. Sci. Rep. 7, 15370 (2017).
level: the cryptic species complex Brachionus plicatilis (Rotifera). BMC Evol. 37. Udo, T., Guissou, P. S., Ushio, H. & Kaneko, G. Ethanol extends lifespan of the
Biol. 11, 90 (2011). rotifer Brachionus plicatilis. Hydrobiologia 844, 183–190 (2019).
6. Hoang, P. T. N., Schubert, V., Meister, A., Fuchs, J. & Schubert, I. Variation in 38. Gillooly, J. F. & Dodson, S. I. The relationship of egg size and incubation
genome size, cell and nucleus volume, chromosome number and rDNA loci temperature to embryonic development time in univoltine and multivoltine
among duckweeds. Sci. Rep. 9, 3234 (2019). aquatic insects. Freshw. Biol. 44, 595–604 (2000).
7. Díez, C. M. et al. Genome size variation in wild and cultivated maize along 39. Falconer, D. S. & Mackay, T. F. C. Introduction to Quantitative Genetics. 4th
altitudinal gradients. N. Phytologist 199, 264–276 (2013). edn, (Pearson, 1996).
8. Riss, S. et al. Do genome size differences within Brachionus asplanchnoidis 40. Yin, X., Tan, B.-B., Zhou, Y.-C., Li, X.-C. & Liu, W. Development time of male
(Rotifera, Monogononta) cause reproductive barriers among geographic and female rotifers with sexual size dimorphism. Hydrobiologia 767, https://
populations? Hydrobiologia 796, 59–75 (2017). doi.org/10.1007/s10750-015-2472-1 (2015).
9. Long, Q. et al. Massive genomic variation and strong selection in Arabidopsis 41. Gilbert, J. Non-genetic polymorphisms in rotifers: environmental and
thaliana lines from Sweden. Nat. Genet. 45, 884 (2013). endogenous controls, development, and features for predictable or
10. Huang, W. et al. Natural variation in genome architecture among 205 unpredictable environments. Biol. Rev. 92, n/a-n/a, https://doi.org/10.1111/
Drosophila melanogaster Genetic Reference Panel lines. Genome Res. 24, brv.12264 (2016).
1193–1208 (2014). 42. Ellis, L. L. et al. Intrapopulation genome size variation in D. melanogaster
11. Stelzer, C. P., Pichler, M., Stadler, P., Hatheuer, A. & Riss, S. Within- reflects life history variation and plasticity. PLoS Genet. 10, e1004522 (2014).
population genome size variation is mediated by multiple genomic elements 43. Hjelmen, C. E. et al. Effect of phenotype selection on genome size variation in
that segregate independently during meiosis. Genome Biol. Evol. 11, two species of diptera. Genes 11, 218 (2020).
3424–3435 (2019). 44. Rosetti, N., Vilardi, J. C. & Remis, M. I. Effects of B chromosomes and
12. Šmarda, P., Bureš, P., Horová, L. & Rotreklová, O. Intrapopulation genome supernumerary segments on morphometric traits and adult fitness
size dynamics in Festuca pallens. Ann. Bot. 102, 599–607 (2008). components in the grasshopper, Dichroplus elongatus (Acrididae). J. Evolut.
13. Elliott, T. A. & Gregory, T. R. What’s in a genome? The C-value enigma and Biol. 20, 249–259 (2007).
the evolution of eukaryotic genome content. Philos. Trans. R. Soc. B-Biol. Sci. 45. Zima, J., Piálek, J. & Macholán, M. Possible heterotic effects of B
370, https://doi.org/10.1098/rstb.2014.0331 (2015). chromosomes on body mass in a population of Apodemus flavicollis. Can. J.
14. Wong, W. Y. et al. Expansion of a single transposable element family is Zool. 81, 1312–1317 (2003).
associated with genome-size increase and radiation in the genus Hydra. Proc. 46. Bakkali, M. et al. Effects of B chromosomes on egg fertility and clutch size in
Natl Acad. Sci. 116, 22915–22917 (2019). the grasshopper Eyprepocnemis plorans. J. Orthoptera Res. 19, 197–203 (2010).
15. Blommaert, J., Riss, S., Hecox-Lea, B., Mark Welch, D. B. & Stelzer, C. P. 47. Chia, J.-M. et al. Maize HapMap2 identifies extant variation from a genome in
Small, but surprisingly repetitive genomes: Transposon expansion and not flux. Nat. Genet. 44, 803 (2012).
polyploidy has driven a doubling in genome size in a metazoan species 48. Rosato, M., Chiavarino, A. M., Naranjo, C. A., Hernandez, J. C. & Poggio, L.
complex. BMC Genom. 20, https://doi.org/10.1186/s12864-019-5859-y (2019). Genome size and numerical polymorphism for the B chromosome in races of
16. Doolittle, W. F. & Brunet, T. D. P. On causal roles and selected effects: our maize (Zea mays ssp. mays, Poaceae). Am. J. Bot. 85, 168–174 (1998).
genome is mostly junk. BMC Biol. 15, 116 (2017). 49. Fussmann, G. Rotifers: excellent subjects for the study of macro- and
17. Petrov, D. A. Mutational equilibrium model of genome size evolution. Theor. microevolutionary change. Hydrobiologia 662, 11–18 (2011).
Popul. Biol. 61, 531–544 (2002). 50. Declerck, S. A. J. & Papakostas, S. Monogonont rotifers as model systems for
18. Petrov, D. A., Sangster, T. A., Johnston, J. S., Hartl, D. L. & Shaw, K. L. the study of micro-evolutionary adaptation and its eco-evolutionary
Evidence for DNA loss as a determinant of genome size. Science 287, implications. Hydrobiologia 796, 131–144 (2017).
1060–1062 (2000). 51. Kim, H.-S. et al. The genome of the freshwater monogonont rotifer
19. Gregory, T. R. Insertion-deletion biases and the evolution of genome size. Brachionus calyciflorus. Mol. Ecol. Resour. 18, 646–655 (2018).
Gene 324, 15–34 (2004). 52. Gribble, K. E. & Mark Welch, D. B. Genome-wide transcriptomics of aging in
20. Kapusta, A., Suh, A. & Feschotte, C. Dynamics of genome size evolution in the rotifer Brachionus manjavacas, an emerging model system. BMC Genom.
birds and mammals. Proc. Natl Acad. Sci. 114, E1460–E1469 (2017). 18, 217 (2017).
21. Lynch, M. The origins of genome architecture. (Sinauer, 2007). 53. Franch-Gras, L. et al. Genomic signatures of local adaptation to the degree of
22. Lynch, M. & Conery, J. S. The origins of genome complexity. Science 302, environmental predictability in rotifers. Sci. Rep. 8, 16051 (2018).
1401–1404 (2003). 54. Guillard, R. R. L. In Culture of Marine Invertebrate Animals (eds. Smith, W. L.
23. Gregory, T. R. Coincidence, coevolution, or causation? DNA content, cell size, & Chanley, M. H.) 29–60 (Pleum Pub. Co., 1975).
and the C-value enigma. Biol. Rev. 76, 65–101 (2001). 55. Stelzer, C. P. Extremely short diapause in rotifers and its fitness consequences.
24. Cavalier-Smith, T. Economy, speed and size matter: Evolutionary forces driving Hydrobiologia 796, 255–264 (2017).
nuclear genome miniaturization and expansion. Ann. Bot. 95, 147–175 (2005). 56. R Development Core Team. R: A Language and Environment for Statistical
25. Hessen, D. O., Jeyasingh, P. D., Neiman, M. & Weider, L. J. Genome Computing. (2020).
streamlining and the elemental costs of growth. Trends Ecol. Evol. https://doi. 57. Tang, Y., Horikoshi, M. & Li, W. ggfortify: unified interface to visualize
org/10.1016/j.tree.2009.08.004 (2010). statistical result of popular R packages. R. J. 8 (2016).
26. Bennett, M. D. Nuclear DNA content and minimum generation time in 58. Rosseel, Y. lavaan: an R package for structural equation modeling. J. Stat.
herbaceous plants. Proc. R. Soc. Lond. Ser. B. Biol. Sci. 181, 109–135 (1972). Softw. 48 (2012).
27. Gregory, T. R. The C-value enigma in plants and animals: a review of parallels 59. Epskamp, S. semPlot: unified visualizations of structural equation models.
and an appeal for partnership. Ann. Bot. 95, 133–146 (2005). Struct. Equ. Model. Multidiscip. J. 22, 474–483 (2015).
28. Gregory, T. R. The bigger the C-value, the larger the cell: genome size and red 60. Venables, W. N. & Ripley, B. D. Modern Applied Statistics with S. 4th edn,
blood cell size in vertebrates. Blood Cell Mol. Dis. 27, 830–843 (2001). (Springer, 2002).
29. Beaulieu, J. M., Leitch, I. J., Patel, S., Pendharkar, A. & Knight, C. A. Genome
size is a strong predictor of cell size and stomatal density in angiosperms. N.
Phytol. 179, 975–986 (2008). Acknowledgements
30. Gregory, T. R., Hebert, P. D. & Kolasa, J. Evolutionary implications of the We thank Peter Stadler for help during routine maintenance of the rotifers, and Simone
relationship between genome size and body size in flatworms and copepods. Riss for providing helpful comments on the manuscript. Alois Herzig provided access to
Heredity 84, 201–208 (2000). the sampling site and helped during sampling of resting eggs at Obere Halbjochlacke.
31. Gregory, T. R. & Hebert, P. D. The modulation of DNA content: proximate Funding for this project was provided by the Austrian Science Fund, grant number
causes and ultimate consequences. Genome Res. 9, 317–324 (1999). P26256 to CPS.
COMMUNICATIONS BIOLOGY | (2021)4:596 | https://doi.org/10.1038/s42003-021-02131-z | www.nature.com/commsbio 7ARTICLE COMMUNICATIONS BIOLOGY | https://doi.org/10.1038/s42003-021-02131-z
Author contributions Publisher’s note Springer Nature remains neutral with regard to jurisdictional claims in
C.P.S. conceived the study, designed, and participated in all experiments. M.P. con- published maps and institutional affiliations.
tributed the size measurements and measurements of population growth and sexual
propensity. A.H. contributed the embryonic development time measurements. A.H. and
M.P. did most of the culturing work. C.P.S. analyzed the data and drafted the article. All Open Access This article is licensed under a Creative Commons
authors read and approved the final article.
Attribution 4.0 International License, which permits use, sharing,
adaptation, distribution and reproduction in any medium or format, as long as you give
Competing interests appropriate credit to the original author(s) and the source, provide a link to the Creative
The authors declare no competing interests. Commons license, and indicate if changes were made. The images or other third party
material in this article are included in the article’s Creative Commons license, unless
indicated otherwise in a credit line to the material. If material is not included in the
Additional information article’s Creative Commons license and your intended use is not permitted by statutory
Supplementary information The online version contains supplementary material
regulation or exceeds the permitted use, you will need to obtain permission directly from
available at https://doi.org/10.1038/s42003-021-02131-z.
the copyright holder. To view a copy of this license, visit http://creativecommons.org/
licenses/by/4.0/.
Correspondence and requests for materials should be addressed to C.-P.S.
Reprints and permission information is available at http://www.nature.com/reprints © The Author(s) 2021
8 COMMUNICATIONS BIOLOGY | (2021)4:596 | https://doi.org/10.1038/s42003-021-02131-z | www.nature.com/commsbioYou can also read