Land subsidence due to groundwater pumping: hazard probability assessment through the combination of Bayesian model and fuzzy set theory - Natural ...
←
→
Page content transcription
If your browser does not render page correctly, please read the page content below
Nat. Hazards Earth Syst. Sci., 21, 823–835, 2021
https://doi.org/10.5194/nhess-21-823-2021
© Author(s) 2021. This work is distributed under
the Creative Commons Attribution 4.0 License.

Land subsidence due to groundwater pumping: hazard
probability assessment through the combination
of Bayesian model and fuzzy set theory
Huijun Li1 , Lin Zhu1 , Gaoxuan Guo2 , Yan Zhang3 , Zhenxue Dai4 , Xiaojuan Li1 , Linzhen Chang5 , and
Pietro Teatini6,7
1 Laboratory  Cultivation Base of Environment Process and Digital Simulation, Beijing Laboratory of Water Resources
Security, Key Laboratory of 3-Dimensional Information Acquisition and Application,
Capital Normal University, Beijing, 100048, China
2 Beijing Institute of Hydrogeology and Engineering Geology, Beijing, China
3 Key Laboratory of Earth Fissures Geological Disaster, Ministry of Natural Resources,

Geological Survey of Jiangsu Province, Jiangsu, China
4 College of Construction Engineering, Jilin University, Changchun, 130026, China
5 Fourth Institute of Hydrogeology and Engineering Geology, Hebei Bureau of Geology and Mineral Resources Exploration,

Hebei, China
6 Department of Civil, Environmental and Architectural Engineering, University of Padua, Padua 35121, Italy
7 Land Subsidence International Initiative (UNESCO LaSII), Querétaro, Mexico

Correspondence: Lin Zhu (hi-zhulin@163.com)

Received: 13 September 2020 – Discussion started: 26 October 2020
Accepted: 14 January 2021 – Published: 2 March 2021

Abstract. Land subsidence caused by groundwater over-            groundwater resource region in the Beijing plain. The re-
pumping threatens the sustainable development in Beijing.        sults show that rates of groundwater level decrease more than
Hazard assessments of land subsidence can provide early          1 m yr−1 in the confined and unconfined aquifers, with cu-
warning information to improve prevention measures. How-         mulative thicknesses of the compressible sediments between
ever, uncertainty and fuzziness are the major issues dur-        160 and 170 m and Quaternary thicknesses between 400 and
ing hazard assessments of land subsidence. We propose            500 m, yielding maximum hazard probabilities of 0.65, 0.68,
a method that integrates fuzzy set theory and weighted           0.32, and 0.35, respectively. The overall hazard probability of
Bayesian model (FWBM) to evaluate the hazard probabil-           land subsidence in the study area decreased from 51.3 % to
ity of land subsidence measured by Interferometric Synthetic     28.3 % between 2003 and 2017 due to lower rates of ground-
Aperture Radar (InSAR) technology. The model is structured       water level decrease. This study provides useful insights for
as a directed acyclic graph. The hazard probability distribu-    decision makers to select different approaches for land sub-
tion of each factor triggering land subsidence is determined     sidence prevention.
using Bayes’ theorem. Fuzzification of the factor significance
reduces the ambiguity of the relationship between the factors
and subsidence. The probability of land subsidence hazard
under multiple factors is then calculated with the FWBM.         1   Introduction
The subsidence time series obtained by InSAR is used to
infer the updated posterior probability. The upper and mid-      The continuous overpumping of groundwater results in dra-
dle parts of the Chaobai River alluvial fan are taken as a       matic piezometric drawdown and induces regional land sub-
case-study site, which locates the first large-scale emergency   sidence. Many countries such as China, Mexico, Italy, USA,
                                                                 Spain, and Iran (Teatini et al., 2005; Tomás et al., 2010; Gal-

Published by Copernicus Publications on behalf of the European Geosciences Union.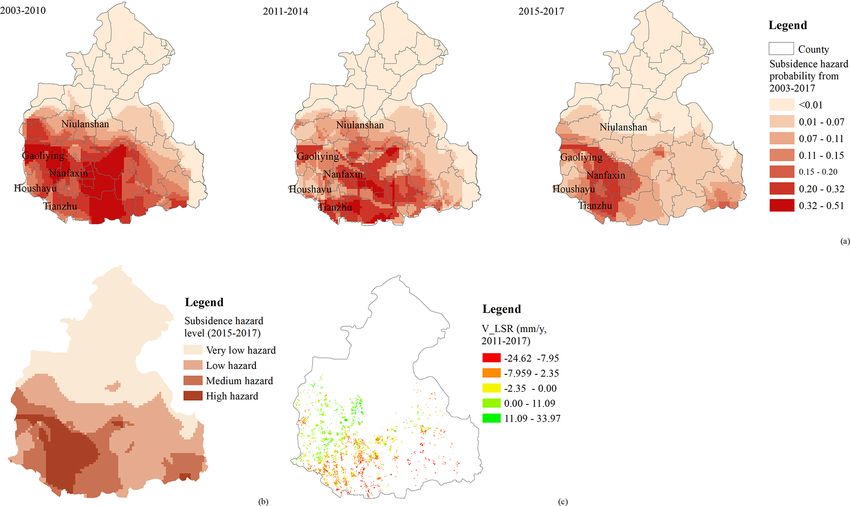
824                            H. Li et al.: Land subsidence due to groundwater pumping: hazard probability assessment

loway and Burbey, 2011; Chaussard et al., 2014; Zhu et al.,        ing (Park et al., 2012; Yi et al., 2017). However, numerical
2015; Motagh et al., 2017) have reported land subsidence due       models require detailed geo-hydrological and geological pa-
to groundwater pumping. Land subsidence is a complex pro-          rameters, which are generally difficult to collect (Smith and
cess influenced by the anthropogenic activities and geolog-        Knight, 2019). Evidence reasoning has strict combination
ical environment. The anthropogenic extraction of ground-          rules and becomes exponentially intensive from the compu-
water from aquifer is the principal triggering factor because      tational point of view as the number of elements increases,
the rapid decline in the groundwater level leads to the com-       although it can handle both certain and uncertain informa-
paction of the aquitard, and consequently the land surface         tion regardless of whether the information is complete or in-
subsides (Xue et al., 2005; Zhu et al., 2015; Gao et al., 2018).   complete and precise or imprecise (Dai et al., 1999). Further-
Although the drops of groundwater level in aquifers lead to        more, current studies mainly focus on the identification and
land subsidence, this process is also controlled by the geo-       classification of hazard levels without any quantitative anal-
logical environment, which includes hydrologic and geome-          ysis of the subsidence hazard.
chanical conditions (Zhu et al., 2015, 2017; Gambolati and            The main challenges in the field are to reduce the un-
Teatini, 2015). Terzaghi’s effective stress principle shows        certainty of hazard assessments and to find an objective
that a decrease in the pore pressure leads to an increase in the   and effective method to assess hazard areas and risks. The
effective stress, which consequently induces land subsidence.      mentioned uncertainty can be represented with probabilities.
The value of land subsidence is related to the soil mechani-       Bayesian models (BMs) are powerful probability approaches
cal properties (Bonì et al., 2020). Land subsidence threatens      to deal with uncertainty (Vilares and Kording, 2011). BMs
the environment and cause economic losses, such as munic-          have been widely applied in disaster hazard assessments,
ipal infrastructure damage, building fracture, and increasing      such as flooding hazard and pipeline damage assessments
flood risk (Wu et al., 2017; Peduto et al., 2017; Wang et al.,     (Liu et al., 2017; Zhang et al., 2016).
2018). Assessments of the subsidence hazard are necessary             This paper proposes a fuzzy weighted Bayesian
for risk prevention.                                               model (FWBM) that combines a weighted Bayesian
   Recent studies have analyzed the hazards of land subsi-         model (WBM) and fuzzy set theory to evaluate the subsi-
dence to buildings using field investigation and Interferomet-     dence hazard probability and analyze the hazard probability
ric Synthetic Aperture Radar (InSAR) (Julio-Miranda et al.,        for different rates of groundwater level change. The posterior
2012; Tomás et al., 2012; Bhattarai and Kondoh, 2017; Pe-          probability is calculated using InSAR-derived land subsi-
duto et al., 2017). Some studies assessed the regional sub-        dence as model input to reduce the epistemic uncertainty.
sidence hazard and identified the areas with high risk us-         This new approach is applied in the Chaobai River alluvial
ing spatial modeling methods based on geographic informa-          fan in Beijing, China, where the first large-scale emergency
tion system (GIS; Huang et al., 2012; Bhattarai and Kon-           groundwater resource region (EGRR) supplying water to
doh, 2017) and multi-objective decision-making (Jiang et al.,      Beijing is located. The hazard probability inferenced with
2012; Yang et al., 2013) or advanced methods along with            the proposed relatively objective method can offer scientific
fuzzy set theory (Mohebbi Tafreshi et al., 2019). The lat-         support for the prediction of land subsidence hazard.
ter require expert score, which is subjective, and the pro-
duced risk level map is also qualitative. Mohebbi Tafreshi
et al. (2019) adopted fuzzy functions to standardize param-
eters with different dimensions, which did not address the         2     Methodology
fuzziness of parameter importance. Land subsidence is a geo-
logical problem depending on various uncertain natural vari-       2.1    InSAR technology
ables. Hazard assessments are associated with an inherent de-
gree of uncertainty, which includes aleatoric aspects due to       InSAR is a microwave remote sensing technique that records
randomness and epistemic aspects related to insufficient in-       the phase and amplitude of the electromagnetic waves of
formation (Kiureghiana and Ditlevsen, 2009). Aleatoric un-         ground objects. The phase information is used to inversely
certainty may come from the randomness of natural variables        determine the subsidence. Persistent scatterer InSAR (PS-
and data quality (Matthies, 2007). Epistemic uncertainty may       InSAR) is the most popular method for detecting time series
be generated by inadequate expert knowledge, the selection         of land movements by calculating the differential interfero-
of evaluation factors, and their quantitative effects on a haz-    metric phase on PS points with a millimetric accuracy (Sun
ard (Vilares and Kording, 2011). The methods mentioned             et al., 2017). The density of PS points can reach 450 per km2
above do not fully consider these uncertainties.                   in urban areas (Ferretti et al., 2011). The differential inter-
   To avoid these disadvantages, some researchers have             ferometric phase 8 of each PS in the corresponding interfer-
adopted more objective methods, such as evidence reasoning         ogram contains five components, including the deformation
methods (Chen et al., 2014; Pradhan et al., 2014), physically      phase along the line of sight (LOS), the topographic phase,
based numerical models (Xu et al., 2015; Dai et al., 2016;         the phase component due to the atmospheric delay, the or-
Jia et al., 2018; Sundell et al., 2019), and machine learn-        bital error phase, and the phase noise (Teatini et al., 2007).

Nat. Hazards Earth Syst. Sci., 21, 823–835, 2021                                   https://doi.org/10.5194/nhess-21-823-2021
H. Li et al.: Land subsidence due to groundwater pumping: hazard probability assessment                                                 825

The deformation phase along the LOS can be extracted by           However, the weight of each factor, such as the piezometric
removing other phase information.                                 decline, soil compressibility, or high static loads on the land
  PS-InSAR processing includes four steps (Zhu et al.,            surface, is determined by its importance to land subsidence
2015):                                                            and is usually qualitative and fuzzy (Chen et al., 2016; Li
                                                                  et al., 2017). The fuzziness of the factor contribution to land
 1. master image selection,                                       subsidence may cause ambiguity in weighting when their im-
 2. construction of a series of interferograms,                   portance must be determined. These deviations can be mod-
                                                                  eled with fuzzy set theory, which expresses fuzziness through
 3. PS point selection, and                                       a membership function to objectively describe the relation-
                                                                  ship between land subsidence and the factors (Mentes and
 4. unwrapping phase.
                                                                  Helvacioglu, 2011). Therefore, the fuzzification of factor im-
2.2     FWBM method                                               portance is applied to eliminate ambiguity.
                                                                     We developed the FWBM by extending Eq. (2) with the
2.2.1    Basic principle of BM                                    introduction of a fuzzy-based weight. The probability of ran-
                                                                  dom variable T becomes
BMs consider the probability distribution of random vari-                                          m
                                                                                                    Y        w
ables and can infer the posterior probability based on weakly     P T |Y1 , . . ., Yj , . . ., Ym =   P T |Yj Fj ,             (3)
informative prior probability to address uncertainty (Weise                                           j =1
and Woger, 1993). A BM consists of a set of random vari-          where wFj is the fuzzy-based weight of Yj .
ables with complex causalities that can be plotted using a           The structure of the FWBM is shown in Fig. 1b, which is
directed acyclic graph (DAG), where random variables are          an improvement of Fig. 1a. The eigenvector nodes are fuzzy
represented as eigenvector nodes (Ren et al., 2009). In DAG       weighted.
(Fig. 1a), the hazard factors related to land subsidence are         Referring to spatial variables, a BM is used to calculate
parent nodes (Yj ), and the subsidence hazard is the child        the hazard probability of each factor through its spatial fea-
node (T ). The arrows represent the probabilistic dependence      tures. The spatial features of Yj are given by X, X = {Xj,1 ,
between nodes (Korb and Nicholson, 2003).                         Xj,2 , . . . , Xj,i−1 , Xj,i , . . . , Xj,n }, where Xj,i is defined as the
   Bayes’ theorem can be used to infer posterior probability      ith of the nth features of the j th factor, as shown in Fig. 1c.
distributions from weakly informative prior probability dis-      The value of n depends on the feature classification. Obvi-
tributions through observed results (Verdin et al., 2019). The    ously, FWBM contains three parts including (i) probability
approach is formulated as follows:                                of Yj , which consists of its n spatial features Xj,i ; (ii) the
             P (Y )P (S|Y )                                       fuzzy weight of Yj ; and (iii) the probability of T .
P (Y |S) =                  ,                              (1)       The hazard probability of the spatial feature Xj,i at sub-
                 P (S)
                                                                  sidence detection time k is calculated using the following
where S represents the observed land subsidence; Y repre-         equation, which is derived from Eq. (1):
sents the hazard factor; P (Y |S) is the posterior probability
                                                                                                                  P S|Xj,i , t = k
of Y when S is observed; P (Y ) is the prior probability inde-

                                                                  P Xj,i |S, t = k = P Xj,i , t = k                                  , (4)
pendent of S; P (S|Y ) is the likelihood function, representing                                                         P (S)
the development of Y ; and P (S) is the marginal probability.     where P (Xj,i , t = k) is the prior probability; P {S|Xj,i , t =
   For multiple factors in DAG, the jointly probability of        k} is the conditional probability calculated with the ratio
multiple conditions can be expressed as                           of the subsidence grid to the feature grid; and P (S) is the
                                  m
                                  Y                               marginal probability, which is the sum of the probability of
                                                                  each Xj,i and is calculated by

P T |Y1 , . . ., Yj , . . ., Ym =   P T |Yj ,              (2)
                                j =1                                        n
                                                                            X
                                                                  P (S) =         P Xj,i , t = k P S|Xj,i , t = k .                      (5)
where Yj is the j th of the m factors that influence T .
                                                                            i=1

2.2.2    FWBM construction                                        2.2.3    FWBM implementation

The conditional independence assumption must be met               In the FWBM framework (Fig. 2), a BM is used to infer the
for BMs. This assumption generally can be strictly met in         hazard probability with the fuzzification of factor importance
geological studies (Webb and Pazzan, 1998). WBMs use              to reduce the ambiguity of the relationship between the haz-
weighted assessment variables to relax the independence as-       ard factors and land subsidence measured by InSAR.
sumption and address the different contributions of parent           The first part of the procedure consists of data (land sub-
nodes to child node (Webb and Pazzan, 1998). It has been          sidence measurements and hazard factors) gridding to ob-
widely used in hazard-related analyses (Tang et al., 2018).       tain homogeneous datasets. The assessment hazard factors

https://doi.org/10.5194/nhess-21-823-2021                                    Nat. Hazards Earth Syst. Sci., 21, 823–835, 2021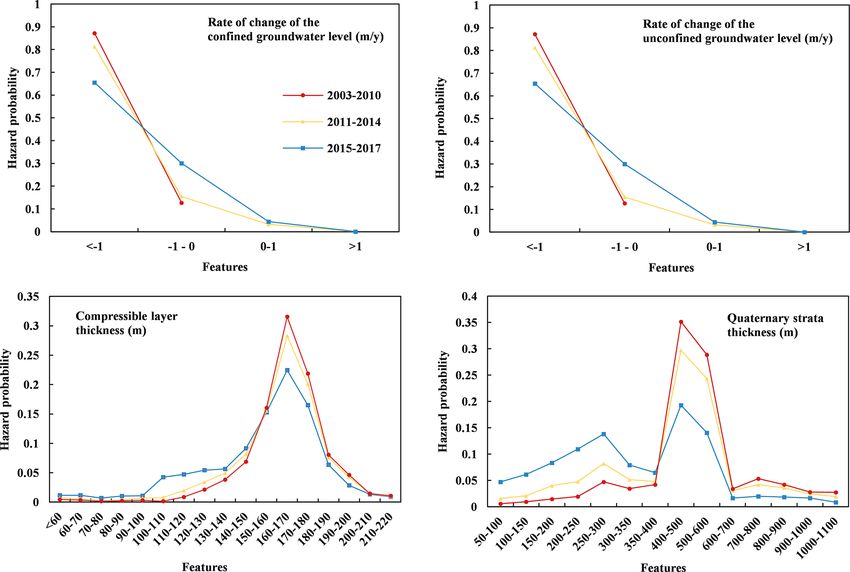
826                             H. Li et al.: Land subsidence due to groundwater pumping: hazard probability assessment

Figure 1. (a) DAG of the BM structure; (b) FWBM structure; (c) spatial features of the hazard factors (Yj , for example).

Figure 2. Flowchart of subsidence hazard assessment using the FWBM.

Nat. Hazards Earth Syst. Sci., 21, 823–835, 2021                                          https://doi.org/10.5194/nhess-21-823-2021
H. Li et al.: Land subsidence due to groundwater pumping: hazard probability assessment                                              827

are derived first, which are parent nodes (Y1 , Y2 . . . , Ym ) in
the model structure, from groundwater extraction and geo-
logical conditions. Additionally, the posterior probability in
a BM can be adjusted using new observations to reduce the
epistemic uncertainty (Weise and Woger, 1993). For the as-
sessment of land subsidence hazard, InSAR is applied to ob-
tain time series of land movements at the regional scale. A
stack of SAR images is processed with PS-InSAR to obtain
the time series of PS points. The PS points form a contin-
uous input dataset to update the posterior probability of the
FWBM, thus reducing the uncertainty in the assessment pro-
cedure. Simultaneously, the subsidence data are also used to
validate the hazard assessment outcome. The various datasets
are spatially connected using the spatial join tool in GIS for
the statistical analysis of FWBM.
   The second part is the model implementation. Three mod-
ules corresponding to the three variables that should be in-
ferred in FWBM, i.e., probability of Yj and T and factor
weight wFj , are implemented.
  – The first module infers the subsidence hazard prob-
    ability of Yj , P (Yj ). For a single factor, the poste-
    rior probability distribution of subsidence hazard is in-
    ferred through its spatial feature Xj,i using the Bayesian       Figure 3. Flowchart to infer (a) the subsidence hazard probability of
                                                                     a single factor and (b) the subsidence hazard probability influenced
    theorem. As shown in Fig. 3a, the hazard probability
                                                                     by multiple factors.
    of Xj,i , P {Xj,i |S, t = k}, is calculated using Eqs. (4)
    and (5) with the calculated prior probability P (Xj,i ,
    t = k) and conditional probability P {S|Xj,i , t = k} at                is reclassified using the natural breaks (Jenks) classi-
    subsidence detection time k. The prior probability and                  fication method, which is widely used in risk evalua-
    conditional probability are calculated through spatial                  tion (Suh et al., 2016; Liu et al., 2017), and compared
    statistical analysis with land subsidence records. This                 with the InSAR measurements to validate the assessed
    step is iterated when new subsidence events are ob-                     results.
    served (new PS points detected and used in input) to
    update the posterior probability.

  – The second module calculates the fuzzy-based                     3     Case study
    weight WFj . Fuzzification of the factor importance is
    processed by establishing fuzzy pairwise comparison              3.1    Description of the study area
    matrices (f_PCM). According to the analytic hierarchy
    process (AHP) method, the pairwise comparison                    The study area belongs to the upper-middle part of the
    criteria is divided into five levels represented with odd        Chaobai River alluvial fan in the northern Beijing plain and
    numbers from 1–9 (Saaty, 1980). The five levels are              covers approximately 1350 km2 (Fig. 4). The Huairou EGRR
    regarded as fuzzy numbers, and the medium level is               is located in this area and designed to ensure the urban wa-
    considered to be equally important. The value of each            ter supply in continuous dry or emergency conditions. Long-
    level is expressed as a triangular fuzzy number which            term groundwater overpumping has caused rapid decreases
    is commonly used to express fuzziness (Mentes and                in the groundwater level, with a maximum value of approx-
    Helvacioglu, 2011). Based on the constructed f_PCM,              imately 40 m after the EGRR operation in 2003 (Zhu et al.,
    WFj is calculated by the fuzzy extended AHP method               2015, 2016). This significant piezometric drop resulted in re-
    (Van Laarhoven and Pedrycs, 1983).                               gional land subsidence. To relieve the situation, the South-to-
                                                                     North Water Transfer Project central route (SNWP-CR) was
  – The third module infers the probability of T , P (T ). The       implemented at the end of 2014.
    hazard probability influenced by multiple factors is de-
    rived using the FWBM. As shown in Fig. 3b, with the              3.2    Datasets and processing
    probability density P (Yj ) and factor weights, the grid-
    ded hazard probability of land subsidence P (T ) is im-          In this study, four hazard factors are considered: the rates
    plemented using Eq. (3). The hazard probability map              of groundwater level change in confined (Y1 with the fea-

https://doi.org/10.5194/nhess-21-823-2021                                       Nat. Hazards Earth Syst. Sci., 21, 823–835, 2021
828 H. Li et al.: Land subsidence due to groundwater pumping: hazard probability assessment
Figure 4. Location of the study area with the digital elevation model from the Shuttle Radar Topography Mission (SRTM). The EGRR
location and the land subsidence monitoring station used to calibrate the PS-InSAR outcome are shown.
ture expressed as X1,i , i = 1 . . . 4) and unconfined (Y2 with 38 RADARSAT-2 images from November 2010 to Novem-
the feature expressed as X2,i , i = 1 . . . 4) aquifers, which re- ber 2014, and 50 Sentinel-1 images from December 2014
flect the hydrologic conditions; the cumulative thicknesses to December 2017. The subsidence results were validated
of the compressible sediments (Y3 with the feature expressed and calibrated with an extensometer station and benchmark
as X3,i , i = 1 . . . 17); and the thickness of the Quaternary data (the location is shown in Fig. 4). The difference be-
unit (Y4 with the feature expressed as X4,i , i = 1 . . . 14), tween the PS-InSAR solution and land-based land subsi-
which represent the geological setting. dence measurements amounted to ±7 mm (Zhu et al., 2015,
The contour lines of compressible soil and Quaternary unit 2020a). Note that the subsidence rate obtained by PS-InSAR
thickness were collected. The change in groundwater levels is characterized by an uncertainty of 1–3 mm yr−1 , depend-
varied from −4 to 6 m between 2015 and 2017. The annual ing on the number and quality of the processed images (Tea-
rates of groundwater level change were classified into four tini et al., 2012). The PS points with a subsidence rate above
classes. The four factors are shown in Fig. 5. 10 mm yr−1 were regarded as subsidence points.
The distribution of the factors related to groundwater level All factors and subsidence datasets were gridded into
change is split into three periods: 5664 cells, with a cell size of 500 m × 500 m. The outcomes
1. from January 2003 to December 2010, a period of mas- on grid sizes of 200, 500, and 1000 m were initially com-
sive groundwater exploitation after the EGRR establish- pared. The results for the 200 and 500 m grid size were simi-
ment; lar, with smoother edges but a higher computational cost for
the former. The results obtained on the 1000 m grid size dis-
2. from January 2011 to December 2014, when the decline played too low a resolution. Each grid ID contains five fea-
rate of the groundwater level slowed due to the long- tures including four assessment factors and land subsidence.
term loss of groundwater which reduces the capacity of
water supply and increased rainfall (Zhang et al., 2015); 3.3 Model implementation
and
3.3.1 Weight computation
3. from January 2015 to December 2017, when the
SNWP-CR operation partially relieved the groundwater The fuzzification of factor importance is expressed as a tri-
exploitation. angular fuzzy number considering the ambiguity between
A total of 125 SAR images were collected, including factors and subsidence. To compare the model performance
37 ASAR images from June 2003 to January 2010, when ambiguity was eliminated, we implemented the WBM
Nat. Hazards Earth Syst. Sci., 21, 823–835, 2021 https://doi.org/10.5194/nhess-21-823-2021H. Li et al.: Land subsidence due to groundwater pumping: hazard probability assessment 829
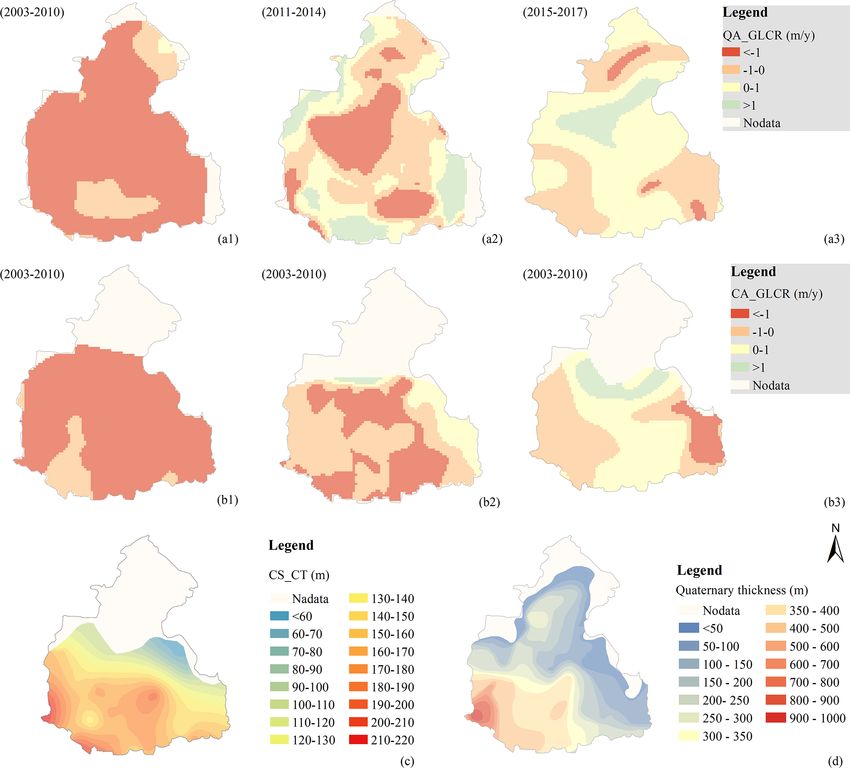
Figure 5. Assessment factors: (a1–a3) annual rate of groundwater level change in the unconfined aquifer (QA_GLCR) over the three peri-
ods 2003–2010, 2011–2014, and 2015–2017, respectively. Negative values mean lowering; (b1–b3) annual rate of groundwater level change
in the confined aquifer system (CA_GLCR) over the three periods 2003–2010, 2011–2014, and 2015–2017, respectively. Negative values
mean lowering; (c) cumulative thickness of compressible sediments (CS_CT); (d) Quaternary thickness.
with the non-fuzzy-based weight (Wj ) calculated by the AHP calculated based on Eq. (5). The posterior hazard probability
method. The result of WBM was also reclassified and sub- P {X3,12 |S, from 2003 to 2010} was calculated using Eq. (4).
tracted from FWBM to compare the levels of change when The same procedure was applied to land subsidence data
considering or not considering the ambiguity. from 2011 to 2014 and from 2015 to 2017, and the posterior
hazard probability at a previous time interval was set as the
3.3.2 Probability of Yj inference prior probability at the current one.
3.3.3 Probability of T inference
The hazard probability of feature Xj,i , P {Xj,i |S, t = k}, was
calculated first. For example, X3,12 is the twelfth feature With the probability of the single factor and factor weights,
of the compressible soil thickness (Y3 ), indicating that the the hazard probability of T , P (T ), was then calculated. Since
thickness ranges between 160 and 170 m. The prior probabil- only a phreatic aquifer exists in the northern part of the study
ity P (X3,12 ) was calculated based on the feature grid number area and land subsidence was relatively low, the hazard prob-
ratio between the number of grid cell with that feature and the ability in this portion of the study area was set to 0.01.
total number of grid cells covering the study area. The con-
ditional probability P {S|X3,12 , from 2003 to 2010}, i.e., the
percentage of grid cells for which land subsidence occurred
in feature X3,12 from 2003 to 2010, was used as input for the
FWBM. P {S} was the sum of P {S|X3,12 , from 2003 to 2010}
https://doi.org/10.5194/nhess-21-823-2021 Nat. Hazards Earth Syst. Sci., 21, 823–835, 2021830 H. Li et al.: Land subsidence due to groundwater pumping: hazard probability assessment
Figure 6. (a) Assessment of the subsidence hazard probability from 2003 to 2010, 2011 to 2014, and 2015 to 2017; (b) subsidence hazard
level (2015–2017); (c) variation of the land subsidence rate (V_LSR) between 2010–2014 and 2015–2017 as obtained by PS-InSAR.
4 Results and discussion Table 1. Comparison of the match ratio (calculated by the ratio be-
tween the sum of the amount of SrI in the high-hazard area and
4.1 Validation of the results SrD in the low-hazard area, and the total number of SrI and SrD)
obtained with FWBM and WBM.
The proposed FWBM was applied to assess the subsidence
hazard probability in the upper and middle part of the FWBM WBM
Chaobai River alluvial fans from 2003 to 2017. The haz- Number Number Number Number
ard assessment distribution was reclassified into seven grades of SrI of SrD of SrI of SrD
(Fig. 6a). A hazard probability less than 0.07 indicates a low- High-hazard area 1473 189 1497 274
hazard area, and a hazard probability greater than 0.15 indi- Low-hazard area 199 766 175 681
cates a high-hazard area (Fig. 6b). Percentage 88 % 80 % 89 % 71 %
The changes in the land subsidence rate (Sr) detected by
Total match ratio 85 % 82 %
InSAR (Fig. 6c) between 2010–2014 and 2015–2017 were
used to validate the assessment results. A positive value
means the subsidence rate decreased (SrD) and a negative
value means the subsidence rate increased (SrI). The total
match ratio is 85 % (Table 2). Notably, Table 1 showed that Table 2. Fuzzy (WFj ) and non-fuzzy-based (Wj ) weights for the
some points with SrD are located in the high-hazard area. hazard factors.
In fact, there are portions of the study plain where, because
Y1 Y2 Y3 Y4
the piezometric level did not recover significantly, land sub-
sidence rates remained larger than 50 mm yr−1 in 2017 (Zhu WFj 0.32 0.12 0.38 0.18
et al. 2020a, b) although smaller than the values observed in Wj 0.33 0.10 0.43 0.14
previous years.
Nat. Hazards Earth Syst. Sci., 21, 823–835, 2021 https://doi.org/10.5194/nhess-21-823-2021H. Li et al.: Land subsidence due to groundwater pumping: hazard probability assessment 831
Figure 7. (a) Variation of the subsidence hazard level between FWBM and WBM. Negative and positive values mean that WBM has a higher
or a smaller hazard level than FWBM, respectively. An amplification of areas (1)–(3) highlighted in panel (a) is provided in panels (b)–(d),
respectively. The colored dots represent the change in the land subsidence rate between 2010–2014 and 2015–2017 (the same as in Fig. 6c),
with the green dots representing a lower hazard probability and the red dots a higher hazard probability.
4.2 Effect of fuzziness on model results of the groundwater levels is, the higher the hazard probabil-
ity is, which is consistent with the general understanding and
The FWBM results were compared with the results from a with the outcome of previous studies revealing that the rapid
WBM that ignored the ambiguity in the hazard assessment groundwater level decline leads to the subsidence of the land
framework. The fuzzy-based weights (WFj ) and non-fuzzy- surface (Tomás et al., 2010; Galloway and Burbey, 2011;
based weights (Wj ) of the four considered factors are shown Zhu et al., 2015). Cumulative thicknesses of the compressible
in Table 2. We found that the stronger the semantic fuzzi- sediments between 160 and 170 m yield a maximum hazard
ness of the factor importance is, the greater the uncertainty probability of 0.32, and the Quaternary thickness between
of factor weights is, which may make the greater difference 400 and 500 m yields a maximum hazard probability of 0.35.
in hazard probability results. This is also consistent with previous studies showing that
The WBM results were also divided into seven levels. land subsidence mainly occurred in the area where the cu-
The degree of difference between WBM and FWBM out- mulative thicknesses of the compressible sediments exceed
comes is shown in Fig. 7a. Negative and positive values 100 m (Lei et al., 2016). Note that an aquifer system with
mean that WBM provides a higher or a lower hazard level thick compressible sediments is more susceptible to causing
than FWBM, respectively. In terms of the subsidence rate large land subsidence, but this takes place only if a certain
change (Fig. 6c), the WBM overestimates the subsidence drawdown of the piezometric head, which is the triggering
hazard level for area 1 (Fig. 7b) and partially the level for factor, occurs in that portion of the subsurface (Zhu et al.,
area 2 (Fig. 7c), where the subsidence rate decreased in re- 2015). This can explain why the hazard probability decreases
cent years. In addition, the WBM underestimates the haz- for the largest values of the compressible sediments and the
ard level for area 3 (Fig. 7d), where the subsidence rate in- Quaternary unit.
creased. The FWBM performs better in regions with SrD and
is characterized by a higher total match ratio than the WBM,
4.4 Temporal change in the subsidence hazard
as shown in Table 1.
4.3 Effect of assessment factors on hazard probability Because land subsidence is negligible in the northern part
of the study area (Zhu et al., 2015), the temporal change in
The hazard probability of factors addressed in the analysis is the hazard probability of land subsidence is investigated only
shown in Fig. 8. Using the period from 2015 to 2017 as an in the southern region, where the confined aquifer system is
example, a rate reduction of the groundwater level in the con- located.
fined aquifer greater than 1 m yr−1 has a maximum hazard As shown in Fig. 6a, the subsidence hazard probability
probability of 0.65. The situation is the same for the ground- in Niulanshan decreased from 2003 to 2017. Conversely,
water change in the unconfined aquifer, with a 0.68 max- the southwestern portion of the study area, especially in
imum hazard probability when the rate reduction exceeds Tianzhu and Nanfaxin where the groundwater level decrease
1 m yr−1 . The results show that the higher the reduction rate exceeded 1 m yr−1 and the thickness of the cumulative com-
https://doi.org/10.5194/nhess-21-823-2021 Nat. Hazards Earth Syst. Sci., 21, 823–835, 2021832 H. Li et al.: Land subsidence due to groundwater pumping: hazard probability assessment
Figure 8. Hazard probability of the selected four factors for the three time periods considered in the analysis.
pressible sediments exceeded 150 m, always maintains a high 29.7 % and 42.1 % of the total area, respectively. As the
hazard probability. thickness of the compressible sediments increases from north
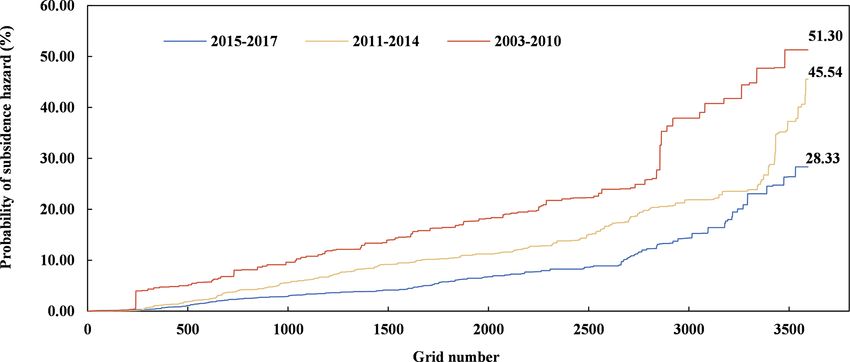
Figure 9 shows that the value of the subsidence haz- to south, the subsidence hazard probability increases accord-
ard probability is between 0.01 % and 51.30 % from 2003 ingly. Tianzhu, Nanfaxin, Gaoliying, and Houshayu in the
to 2010, between 0.01 % and 45.54 % from 2011 to 2014, southwestern region experience medium–high hazards be-
and between 0.01 % and 28.33 % from 2015 to 2017. cause the compressible strata in these areas are thick and the
Overall, the subsidence hazard decreased. This can be groundwater level dropped significantly. The InSAR results
credited to the significant exploitation of groundwater re- also revealed that the maximum subsidence rate in these re-
sources and the following utilization policies. From 2003 gions increased to 84.9 mm yr−1 over the period from 2015
to 2010, the operation of the EGRR led to a rapid drawdown to 2017. Overall, the area of high subsidence hazard de-
of the groundwater levels. Between 2015 and 2017, the op- creases versus time due to the reduction in the rate of ground-
eration of the SNWP-CR conveyed a large amount of water water level change.
to Beijing, reducing the pressure on the aquifer system and,
consequently, slowing the rate of change in the groundwa-
ter level (Zhu et al., 2020b). Similarly, the California State 5 Conclusions
Water Project, which is also a large water-transfer system,
Considering the ambiguity of the importance of various fac-
has been fundamental to controlling land subsidence in the
tors controlling land subsidence due to groundwater pump-
Central Valley, California (Sneed et al., 2018).
ing and the uncertainty in the assessment process, a FWBM
4.5 Spatial distribution of subsidence hazard model was developed to assess the probability of land subsi-
dence hazard at a regional scale. FWBM is based on a com-
Four subsidence hazard levels are classified from the proba- bination of BM and fuzzy set theory. The InSAR method was
bility map (Fig. 6b), consistent with previous studies (Yang used to obtain land subsidence time series to adjust the pos-
et al., 2013; Zhu et al., 2015). The high hazard covers 10.7 % terior probability of the FWBM, thus reducing the model un-
of the total area, and the medium hazard accounts for 17.5 % certainty.
of the total area. The low and very low hazards represent
Nat. Hazards Earth Syst. Sci., 21, 823–835, 2021 https://doi.org/10.5194/nhess-21-823-2021H. Li et al.: Land subsidence due to groundwater pumping: hazard probability assessment 833
Figure 9. Probability distribution of subsidence hazard for the three time periods from 2003 to 2017.
The implementation of the FWBM in the Beijing area Code availability. The calculations involved in this study are done
demonstrated the potentiality of this modeling approach and using ArcGIS software.
showed that it is superior when the ambiguity of the rela-
tionship between the factors and land subsidence is consid-
ered. The study is a first analysis of the hazard probabil- Data availability. The data used in this study are available from the
ity of land subsidence and the related hazard factors. From corresponding author on reasonable request.
the case study, we found that subsidence probability de-
creased over time due to a change in water utilization, such
as the operation of the SNWP-CR. A rate of groundwater Author contributions. HL completed the experiment and paper,
LZ and ZD provided rigorous guidance on the thesis and revised
level decline greater than 1 m yr−1 in the unconfined and
the manuscript, GG provided part of data and discussed the con-
confined aquifers yields the maximum hazard probabilities
tents, YZ and LC revised the manuscript, and XL and PT provided
equal to 0.68 and 0.65, respectively. A compressible sedi- guidance on the research conclusions and revised the manuscript.
ment thickness between 160 and 170 m yields a maximum
hazard probability of 0.32. A Quaternary strata thickness be-
tween 400 and 500 m yields a maximum hazard probabil- Competing interests. The authors declare that they have no conflict
ity of 0.35. The overall subsidence hazard probability in the of interest.
study area decreased from 51.3 % to 28.3 % between 2003
and 2017 due to the decrease in the rate of groundwater level
reduction. Acknowledgements. The authors are thankful to Tingbao Xu at the
The results of this study suggest that the proposed subsi- Australian National University and Yun Chen at CSIRO for their
dence hazard assessment method significantly represents the valuable comments and suggestions.
uncertainty and ambiguity compared to traditional qualitative
methods (Huang et al., 2012; Park et al., 2012; Yang et al.,
2013; Chen et al., 2014; Tafreshi et al., 2019; Sundell et al., Financial support. This research has been supported by the Na-
2019). The hazard probability map of different time periods tional Natural Science Foundation of China (grant nos. 41130744
with different groundwater level conditions can offer scien- and 41201420), the Natural Science Foundation of Beijing Mu-
nicipality (grant no. 8202008), and the Capacity Building for
tific support for land subsidence prediction and help stake-
Sci-Tech Innovation-Fundamental Scientific Research Funds (grant
holders and decision makers to develop more reliable water
no. 025195305000/191).
utilization strategies accounting for land subsidence hazard.
Improvements to the proposed methodology will be in-
vestigated in the future. The prior probability in this model Review statement. This paper was edited by Olga Petrucci and re-
is determined by the factor grid number ratio, which may viewed by two anonymous referees.
have deviations. This ratio can be further improved by expert
knowledge. Additionally, the impact of the selected assess-
ment factors on the results will be investigated. Moreover,
the cumulative land subsidence and not only the subsidence
rate will be considered to assess the subsidence hazard with
a more comprehensive perspective.
https://doi.org/10.5194/nhess-21-823-2021 Nat. Hazards Earth Syst. Sci., 21, 823–835, 2021834 H. Li et al.: Land subsidence due to groundwater pumping: hazard probability assessment
References Kiureghiana, A. D. and Ditlevsen, O.: Aleatory or epistemic? Does
it matter?, Struct. Safe., 31, 105–112, 2009.
Bhattarai, R. and Kondoh, A.: Risk Assessment of Land Subsidence Korb, K. B. and Nicholson, A. E.: Bayesian Artificial Intelligence,
in Kathmandu Valley, Nepal, Using Remote Sensing and GIS, CRC Press, Florida, 2003.
Adv. Remote Sens., 6, 132–146, 2017. Lei, K. C., Luo, Y., Chen, B. B., and Guo, G. X., Zhou, Y.: Distri-
Bonì, R., Meisina, C., Teatini, P., Zucca, F., Zoccarato, C., bution characteristics and influence factors of land subsidence in
Franceschini, A., Ezquerro, P., Bejar, M., Fernandez-Merofo, Beijing area, Geol. China, 43, 2216–2225, 2016.
J. A., Guardiola-Albert, C., Pastor Navarro, J., Tomás, Li, Y. Y., Gong, H. L., Zhu, L., Li, X., Wang, R., and Guo, G.: Char-
R., and Herrera, G.: 3D groundwater flow and deforma- acterizing land displacement in complex hydrogeological and ge-
tion modelling of Madrid aquifer, J. Hydrol., 585, 124773, ological settings: a case study in the Beijing Plain, China, Nat.
https://doi.org/10.1016/j.jhydrol.2020.124773, 2020. Hazards, 87, 323–343, 2017.
Chaussard, E., Wdowinski, S., Cabral-Cano, E., and Amelung, F.: Liu, R., Chen, Y., Wu, J., Gao, L., Barrett, D., Xu, T., Li, X., Li, L.,
Land subsidence in central Mexico detected by ALOS InSAR Huang, C., and Yu, J.: Integrating Entropy-Based Naïve Bayes
time-series, Remote Sens. Environ., 140, 94–106, 2014. and GIS for Spatial Evaluation of Flood Hazard, Risk Anal., 37,
Chen, M., Tomás, R., Li, Z. H., Motagh, M., Li, T., Hu, L., Gong, 756–773, 2017.
H., Li, X., Yu, J., and Gong, X.: Imaging land subsidence induced Matthies, H. G.: Quantifying uncertainty: modern computational
by groundwater extraction in Beijing (China) using satellite radar representation of probability and applications, Extreme Man-
interferometry, Remote Sens., 8, 468–489, 2016. Made and Natural Hazards in Dynamics of Structures, in: NATO
Chen, Y., Shu, L. C., and Burbey, T.: An Integrated Risk Assessment Security through Science Series, Springer, Dordrecht, 105–135,
Model of Township-Scaled Land Subsidence Based on an Evi- 2007.
dential Reasoning Algorithm and Fuzzy Set Theory, Risk Anal., Mentes, A. and Helvacioglu, I. H.: An application of fuzzy fault tree
34, 656–669, 2014. analysis for spread mooring systems, Ocean Eng., 38, 285–294,
Dai, G., Pan, Q., Zhang, S., and Zhang, H.: The developments and 2011.
problems in evidence reasoning, Contr. Theor. Appl., 16, 465– Mohebbi Tafreshi, G., Nakhaei, M., and Lak, R.: Land
469, 1999. subsidence risk assessment using GIS fuzzy logic spa-
Dai, Z., Viswanathan, H., Middleton, R., Middleton, R., Pan, F., tial modeling in Varamin aquifer, Iran, Geo J., 38,
Ampomah, W., Yang, C., Jia, W., Xiao, T., Lee, S. Y., Mcpherson, https://doi.org/10.1007/s10708-019-10129-8, 2019.
B., Balch, R., Grigg, R., and White, M.: CO2 Accounting and Motagh, M., Shamshiri, R., and Haghighi, M. H.: Quantifying
Risk Analysis for CO2 Sequestration at Enhanced Oil Recovery groundwater exploitation induced subsidence in the Rafsanjan
Sites, Environ. Sci. Technol., 50, 7546–7554, 2016. plain, southeastern Iran, using InSAR time-series and in situ
Ferretti, A., Fumagalli, A., Novali, F., Prati, C., Rocca, F., and measurements, Eng. Geol., 218, 134–151, 2017.
Rucci, A.: A New Algorithm for Processing Interferometric Park, I., Choi, J., Lee, M. J., and Lee, S.: Application of an adap-
Data-Stacks: SqueeSAR, IEEE T. Geosci. Remote, 49, 3460– tive neuro-fuzzy inference system to ground subsidence hazard
3470, 2011. mapping, Comput. Geosci., 48, 228–238, 2012.
Galloway, D. L. and Burbey, T. J.: Review: Regional land subsi- Peduto, D., Nicodemo, G., Maccabiani, J., and Ferlisi, S.: Multi-
dence accompanying groundwater extraction, Hydrogeol. J., 19, scale analysis of settlement-induced building damage using dam-
1459–1486, 2011. age surveys and DInSAR data: A case study in The Netherlands,
Gambolati, G. and Teatini, P.: Geomechanics of subsurface water Eng. Geol., 218, 117–133, 2017.
withdrawal and injection, Water Resour. Res., 51, 3922–3955, Pradhan, B., Abokharima, M. H., Jebur, M. N., and Tehrany,
2015. M. S.: Land subsidence susceptibility mapping at Kinta Valley
Gao, M. L., Gong, H. L., Chen, B. B., Li, X., Zhou, C., Shi, M., Si, (Malaysia) using the evidential belief function model in GIS,
Y., Chen, Z., and Duan, G.: Regional Land Subsidence Analy- Nat. Hazards, 73, 1019–1042, 2014.
sis in Eastern Beijing Plain by InSAR Time Series and Wavelet Ren, J., Jenkinson, I., Wang, J., Xu, D. L., and Yang, J. B.: An off-
Transforms, Remote Sens., 10, 365–382, 2018. shore risk analysis method using fuzzy Bayesian network, J. Off-
Huang, B., Shu, L., and Yang, Y. S.: Groundwater overexploita- shore Mech. Arct. Eng., 131, 1–12, 2009.
tion causing land subsidence: hazard risk assessment using field Saaty, T. L.: The Analytic Hierarchy Process, McGraw-Hill Press,
observation and spatial modelling, Water Resour. Manage., 26, New York, 1980.
4225–4239, 2012. Smith, R. and Knight, R.: Modeling Land Subsidence Using In-
Jia, W., McPherson, B., Pan, F., Dai, Z., and Xiao, T.: Uncertainty SAR and Airborne Electromagnetic Data, Water Resour. Res.,
quantification of CO2 storage using Bayesian model averaging 55, 2801–2819, 2019.
and polynomial chaos expansion, Int. J. Greenhouse Gas Contr., Sneed, M., Brandt, J., and Solt, M.: Land subsidence along the
71, 104–115, 2018. California aqueduct inWest-Central San Joaquin Valley, Cali-
Jiang, Y., Jia, S. M., and Wang, H. G.: Risk assessment and manage- fornia, 2003–10, in: US Geological Survey Scientific Investi-
ment of land subsidence in Beijing Plain, Chin. J. Geol. Hazard gations Report 2018-5144, US Geological Survey, Reston, VA,
Contr., 23, 55–60, 2012. https://doi.org/10.3133/sir20185144, 2018.
Julio-Miranda, P., Ortíz-Rodríguez, A. J., Palacio-Aponte, A. G., Suh, J., Choi, Y., and Park, H. D.: GIS-based evaluation of mining-
López-Doncel, R., and Barboza-Gudiño, R.: Damage assessment induced subsidence susceptibility considering 3D multiple mine
associated with land subsidence in the San Luis Potosi-Soledad drifts and estimated mined panels, Environ. Earth Sci., 75, 1–19,
de Graciano Sanchez metropolitan area, Mexico, elements for 2016.
risk management, Nat. Hazards, 64, 751–765, 2012.
Nat. Hazards Earth Syst. Sci., 21, 823–835, 2021 https://doi.org/10.5194/nhess-21-823-2021H. Li et al.: Land subsidence due to groundwater pumping: hazard probability assessment 835 Sun, H., Zhang, Q., Zhao, C., Yang, C., Sun, Q., and Chen, W.: Weise, K. and Woger, W.: A Bayesian theory of measurement un- Monitoring land subsidence in the southern part of the lower certainty, Meas. Sci. Technol., 4, 1–11, 1993. Liaohe plain, China with a multi-track PS-InSAR technique, Re- Wu, H. N., Shen, S. L., and Yang, J.: Identification of Tun- mote Sens. Environ., 188, 73–84, 2017. nel Settlement Caused by Land Subsidence in Soft Deposit Sundell, J., Haaf, E., Tornborg, J., and Rosén, L.: Comprehensive of Shanghai, J. Perform. Construct. Facil., 31, 04017092, risk assessment of groundwater drawdown induced subsidence, https://doi.org/10.1061/(ASCE)CF.1943-5509.0001082, 2017. Stoch. Environ. Res. Risk A., 1, 427–449, 2019. Xu, Y. S., Yuan, Y., Shen, S. L., Yin, Z. Y., Wu, H. N., and Ma, L.: Tang, X., Shu, Y., Lian, Y., Zhao, Y., and Fu, Y.: A spatial as- Investigation into subsidence hazards due to groundwater pump- sessment of urban waterlogging risk based on a Weighted Naive ing from Aquifer II in Changzhou, China, Nat. Hazards, 78, 281– Bayes classifier, Sci. Total Environ., 630, 264–274, 2018. 296, 2015. Teatini, P., Ferronato, M., Gambolati, G., Bertoni, W., and Gonella, Xue, Y. Q., Zhang, Y., Ye, S. J., Wu, J. C., and Li, Q. F.: Land M.: A century of land subsidence in Ravenna, Italy, Environ. subsidence in China, Environ. Geol., 48, 713–720, 2005. Geol., 47, 831–846, https://doi.org/10.1007/s00254-004-1215-9, Yang, Y., Zhang, F. D., Liu, L. C., Dou, Y. B., and Jia, S. M.: Suscep- 2005. tibility zoning and control measures on land subsidence caused Teatini, P., Tosi, L., Strozzi, T., Carbognin, L., Cecconi, G., Rosselli, by groundwater exploitation, Geol. China, 40, 653–658, 2013. R., and Libardo, S.: Resolving land subsidence within the Venice Yi, Y., Liu, H., Zhang, Y., Liu, X., and Qi, J.: Analysis of urban Lagoon by persistent scatterer SAR interferometry, Phys. Chem. ground subsidence hazard induced by building load combined Earth., 40–41, 72–79, 2012. with weights of evidence model and deep learning, J. Catas- Teatini, P., Strozzi, T., Tosi, L., Wegmüller, U., Werner, C., and trophol., 32, 50–59, 2017. Carbognin, L.: Assessing short and long-time displacements Zhang, J. H., Fan, J. D., and Li, S. J.: Research on the Groundwater in the Venice coastland by synthetic aperture radar interfero- Resources Conservation of Huairou Emergency Water Source af- metric point target analysis, J. Geophys. Res., 112, F01012, ter the South-to-north Water Transfer into Beijing, Urban Geol., https://doi.org/10.1029/2006JF000656, 2007. 10, 17–20, 2015. Tomás, R., Herrera, G., Lopez-Sanchez, J. M., Vicente, F., Cuenca, Zhang, L., Wu, X., Qin, Y., Skibniewski, M. J., and Liu, W.: To- A., and Mallorquí, J. J.: Study of the land subsidence in Orihuela wards a Fuzzy Bayesian Network Based Approach for Safety City (SE Spain) using PSI data: Distribution, evolution and corre- Risk Analysis of Tunnel-Induced Pipeline Damage, Risk Anal., lation with conditioning and triggering factors, Eng. Geol., 115, 36, 278–301, 2016. 105–121, 2010. Zhu, L., Gong, H. L., Li, X. J., Wang, R., Chen, B., Dai, Z., and Tea- Tomás, R., García-Barba, J., Cano, M., Sanabria, M. P., Ivorra, S., tini, P.: Land subsidence due to groundwater withdrawal in the Duro, J., and Herrera, G.: Subsidence damage assessment of a northern Beijing plain, China, Eng. Geol., 193, 243–255, 2015. gothic church using Differential Interferometry and field data, Zhu, L., Dai, Z. X., Gong, H., Gable, C., and Teatini, P.: Statistic Struct. Health Monit., 11, 751–762, 2012. inversion of multi-zone transition probability models for aquifer Van Laarhoven, P. J. M. and Pedrycs, W.: A fuzzy extension characterization in alluvial fans, Stoch. Environ. Res. Risk A., of Saaty’s priority theory, Fuzzy Set. Syst., 11, 229–241, 30, 1005–1016, 2016. https://doi.org/10.1016/S0165-0114(83)80082-7, 1983. Zhu, L., Gong, H., Dai, Z., Guo, G., and Teatini, P.: Modeling 3- Verdin, A., Rajagopalan, B., Kleiber, W., Podesta, G. P., and Bert, D permeability distribution in alluvial fans using facies architec- F.: BayGEN: A Bayesian Space-Time Stochastic Weather Gen- ture and geophysical acquisitions, Hydrol. Earth Syst. Sci., 21, erator, Water Resour. Res., 55, 2900–2915, 2019. 721–733, https://doi.org/10.5194/hess-21-721-2017, 2017. Vilares, I. and Kording, K.: Bayesian models: the structure of the Zhu, L., Franceschini, A., Gong, H. L., Ferronato, M., Dai, Z., world, uncertainty, behavior, and the brain, Ann. NY. Acad. Sci., Ke, Y., Pan, Y., Li, X., Wang, R., and Teatini, P.: 3D facies 1224, 22–39, 2011. and geomechanical modelling of land subsidence in the Chaobai Wang, J., Yi, S., Li, M., Wang, L., and Song, C.: Effects of sea level plain, Beijing, Water Resour. Res., 54, e2019WR027026, rise, land subsidence, bathymetric change and typhoon tracks on https://doi.org/10.1029/2019WR027026, 2020a. storm flooding in the coastal areas of Shanghai, Sci. Total Envi- Zhu, L., Gong, H. L., Chen, Y., Wang, S., Ke, Y., Guo, G., ron., 621, 228–234, 2018. Li, X., Chen, B., Wang, H., and Teatini, P.: Effects of Webb, G. I. and Pazzan, J.: Adjusted probability Naive Bayesian Water Diversion Project on groundwater system and land induction, in: Proceedings of the 11th Australian Joint Confer- subsidence in Beijing, China, Eng. Geol., 276, 105763, ence on Artificial Intelligence, Springer Verlag, Berlin, 285–295, https://doi.org/10.1016/j.enggeo.2020.105763, 2020b. 1998. https://doi.org/10.5194/nhess-21-823-2021 Nat. Hazards Earth Syst. Sci., 21, 823–835, 2021
You can also read