Navigating between Tea and Rubber in Xishuangbanna, China: When New Crops Fail and Old Ones Work - MDPI
←
→
Page content transcription
If your browser does not render page correctly, please read the page content below
land
Article
Navigating between Tea and Rubber in
Xishuangbanna, China: When New Crops Fail and
Old Ones Work
Charlotte Filt Slothuus 1,2, * , Dietrich Schmidt-Vogt 3,4 and Ole Mertz 1
 1    Department of Geosciences and Natural Resource Management, University of Copenhagen,
      Øster Voldgade 10, 1350 Copenhagen K, Denmark; om@ign.ku.dk
 2    East and Central Asia Regional Office, World Agroforestry Centre (ICRAF), Kunming 650201, China
 3    Kunming Institute of Botany, Chinese Academy of Sciences, 132# Lanhei Road, Kunming 650201, China;
      dsvogt1@gmail.com
 4    Chair of Silviculture, Faculty of Environment and Natural Resources, Freiburg University, Tennenbacherstr.
      4, 79106 Freiburg, Germany
 *    Correspondence: cfm@ign.ku.dk; Tel.: +45-26362024

 Received: 19 December 2019; Accepted: 10 January 2020; Published: 15 January 2020

 Abstract: Following the massive expansion of rubber plantations in China, considerable research
 has been conducted on the impact of these landscape changes. The general consensus is that there
 have been negative impacts on the environment and positive impacts on local economies. However,
 since rubber prices dropped after 2011, the economic benefit to the local people is challenged and
 the impact on the local people and communities remains unclear. Using a mix of qualitative and
 quantitative methods, this longitudinal study investigates how the drop in rubber prices has affected
 a local community and the local people in Manlin, Xishuangbanna, China. It investigates local coping
 strategies and the importance of alternative income sources and shows how differentiated access
 to alternative lands creates increased economic inequality within the village when prices fluctuate.
 Three general coping strategies were identified amongst local rubber farmers: doing business as usual,
 changing rubber management practices, and stopping- or decreasing tapping frequency. Differences
 in coping strategies are linked to factors including access to alternative income sources and rubber
 perceptions. Moreover, households with access to tea land were found to have experienced negligible
 impacts of decreasing rubber prices as income from tea has increased more than income from rubber
 has decreased, leading to increasing intra-village economic inequality. We conclude that while this is
 a clear case of how income diversification is important for reducing livelihood vulnerability, it also
 shows that the large focus on rubber farming has created benefits in terms of improved infrastructure
 and connectivity that has helped expand the market for tea as well.

 Keywords: rubber; tea; price drop; land use; livelihoods; coping strategies; Xishuangbanna; China

1. Introduction
    The commodification of smallholder agriculture has for long been associated with regional
growth in Asia, where subsistence-based farming practices are undergoing a transition towards
more commercially oriented production systems [1–5]. In the Xishuangbanna prefecture in southern
China, rubber trees (Hevea brasiliensis) have become one of the most important cash crops and
a dominant land use. After being introduced to China during the 1950s [6], the area of rubber
plantations has expanded rapidly, replacing previous areas of forests and swidden-fallow systems
with predominantly monoculture plantations [3,7] The positive local economic impacts from rubber

Land 2020, 9, 22; doi:10.3390/land9010022                                            www.mdpi.com/journal/land
Land 2020, 9, 22                                                                                     2 of 15

farming in Xishuangbanna are in many cases visible, and rubber farming has also been recognized for
its poverty-alleviating properties in earlier studies [8–11].
     However, previous studies have also warned how an increasing focus on commodity crops may
increase livelihood vulnerability as local households have become more exposed to risks, including
price shocks [2,12,13], making them dependent on the global market and commodity prices, over
which they have no control [14]. The rubber market is no exception to this as the sharp increase
in producer prices of natural rubber in mainland China from 2007 to 2011, that spurred the rubber
boom [7], was followed by a drop in prices by more than 22% from 2011 to 2013 [15]. In the following
years, the price continued to drop confronting local producers with a new reality after a number of
highly profitable years. This has generated adverse consequences for the local people in communities
specializing in rubber farming. Liu et al. [3] and Min et al. [16], using a quantitative approach with data
from 2012, showed how rubber farming have increased household income risk by reducing income
differentiation, and how the economic performance of rubber varies at different elevations, suggesting
that geographical location is an important factor when looking at benefits, risks, and vulnerability. For
example, rubber plots spreading into marginal areas of production above 900 m.a.s.l. have been found
to have a negative net present value [17,18].
     Concurrent with the fluctuating rubber prices, producer prices for tea in China more than tripled
between 2003 and 2013—though with a slump in 2007—and cultivation of tea has also expanded
rapidly in the country [19]. Tea is also a highly traditional crop in Yunnan and has been grown and
maintained for centuries in forests, agroforestry systems, and other farming systems [20]. Yunnan
is particularly known for the Pu’er tea, which had been grown and traded for centuries and, after
some years in oblivion during the 1950s to 1980s, was rediscovered in the 1990s [9]. Its maintenance as
an understory crop in forests, requiring very limited crop husbandry and care, ensured its survival
during the “market-free” years of Maoist China [9] and for the same reason, the production of forest
tea has a very high net present value that even competed with rubber production during peak rubber
prices in 2011 [21].
     This is the point of departure for the present case study on how the rubber price bust has affected
Manlin, a local Yi rubber village in Xishuangbanna, and the importance of income diversification, here
in the form of tea as a back-up resource. This paper builds on previous research by quantifying how
the local people of Manlin have been economically affected by the drop in rubber prices and helps
generate an in-depth understanding of how local rubber farmers deal with fluctuating commodity
prices by looking into local coping, management strategies, and risk perceptions.

2. Study Area and Methodology
     The research was conducted in the Xishuangbanna autonomous prefecture in the southernmost
part of Yunnan province. It is a mountainous and historically highly forested area with elevations
ranging between 477 and 2429 m, annual mean temperatures ranging between 15.1 and 21.7 ◦ C,
and a monsoonal climate [22–24]. Xishuangbanna is an ethnically diverse region and home to more
than 11 minority peoples [3,16,24–26]. The major ethnic group is Dai (27.9%), followed by Han
(24.3%), and Hani (19.0%). Other ethnic groups include Yi, Lahu, and Bulang [27]. Traditionally, land
management practices and crops have been diverse [27]. However, following an increased market
economy integration and the introduction of a number of land-use policies [3,9,24,28], Xishuangbanna
has experienced a rapid expansion of commercial agriculture. Rubber as a crop was originally
introduced to Xishuangbanna in the 1950s on state farms when local households were still organized
under communes [6,25,28]. It was not until after the land reforms in the early 1980s, when land plots
were allotted to local households, that rubber spread beyond the state farms, promoted by state agents
to spur economic development and meet domestic demand [10]. Since then, rubber has become one
of the main land uses in Xishuangbanna, covering approximately 22.2% of the total land cover in
2010 [18]. Being predominantly managed by smallholder farmers [16,29], rubber is an important source
of income for the local people [26]. Today, rubber and tea are the primary main livelihoods of most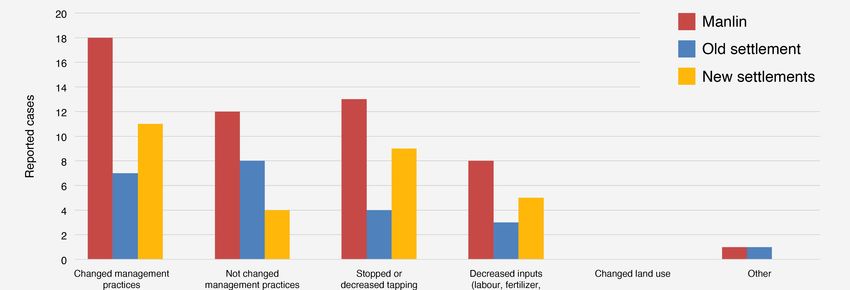
Land 2020,
Land 2020, 9,
9, 22
x FOR PEER REVIEW 33 of
of 16
15
livelihoods of most people in Xishuangbanna, with rubber dominating livelihoods at low and
people
medium in elevations
Xishuangbanna, with
and tea rubber elevations
at higher dominating[27]
livelihoods at low andare
where conditions medium elevations
suboptimal and tea
for growing
at higher
rubber. elevations [27] where conditions are suboptimal for growing rubber.
2.1. The
2.1. The Case
Case Site:
Site: MANLIN,
MANLIN, Xishuangbanna
Xishuangbanna
The case
The case study
study was was conducted
conducted in in Manlin
Manlin administrative village in
administrative village in Mengla
Mengla CountyCounty in in
Xishuangbanna (Figure 1). Manlin was chosen as a case site based on
Xishuangbanna (Figure 1). Manlin was chosen as a case site based on the local involvement withthe local involvement with
rubber farming,
rubber farming, and and because
because previous
previous research
research had
had been
been carried
carried out
out in
in the
the village
village in in 2013
2013 [21,30],
[21,30],
enabling a temporal investigation into the impact of fluctuating rubber prices. Manlin is located in
enabling a temporal investigation into the impact of fluctuating rubber prices. Manlin is located in
Xiangming Township and consists of eight settlements of varying sizes and
Xiangming Township and consists of eight settlements of varying sizes and altitudes. The respectivealtitudes. The respective
settlements are
settlements are also
also largely
largely separated
separated by by the
the households’
households’ different
different registration,
registration, or or hukou,
hukou, statuses
statuses
indicating whether the households are officially listed in the village or not
indicating whether the households are officially listed in the village or not and thus entitled toand thus entitled to local
local
benefits or not. Of the eight settlements, three are comprised of predominantly
benefits or not. Of the eight settlements, three are comprised of predominantly locally registered locally registered
households. These
households. These are
are the
the settlements
settlements andand households
households that that have
have been
beentargeted
targetedin inthe
thepresent
presentresearch.
research.
Households with non-local hukou statuses have been excluded as they differ
Households with non-local hukou statuses have been excluded as they differ from the households from the households with
local hukou
with statuses
local hukou in terms
statuses in of (amongst
terms other) composition,
of (amongst tenure and
other) composition, tenureethnicity [21,30], making
and ethnicity [21,30],
them difficult to compare. We expect that these households would
making them difficult to compare. We expect that these households would be amongst be amongst the most vulnerable
the most to
a drop in rubber
vulnerable prices,
to a drop but additional
in rubber prices, butresearch would
additional be needed
research would inbe
order to get
needed in the
orderfulltoinsight
get theinto
full
how these unregistered households are affected by fluctuating commodity
insight into how these unregistered households are affected by fluctuating commodity prices. prices.
Figure 1. Importance
Figure 1. Importance of
of different
different income
income sources
sources measured
measured by
by their
their share
share of
of total
total income
income in
in Manlin,
Manlin,
Xishuangbanna, in
Xishuangbanna, in 2013
2013 and
and 2015.
2015.
In the following,
following, weweuseusethetheterm
term“main
“mainsettlement”
settlement”totoreferrefertotothe
theoldest
oldest and
and largest
largest settlement
settlement in
in Manlin
Manlin located
located at an
at an altitude
altitude of approximately
of approximately 11001100 m.a.s.l.,
m.a.s.l., andand“new “new settlements”
settlements” to refer
to refer totwo
to the the
two newest
newest settlements
settlements in Manlin
in Manlin located
located at approximately
at approximately 590 783
590 and andm.a.s.l.
783 m.a.s.l.
Manlin isisa apredominantly
predominantly Yi ethnic
Yi ethnic village.
village. In 2011,
In 2011, 108 households
108 households were recorded
were recorded [31];
[31]; however,
however, in 2013,
in 2013, only only 97 households
97 households wereliving
were actually actuallyin living in the The
the village. village.
threeThe three settlements
settlements are locatedare
located
betweenbetween
560–1100 560–1100
m.a.s.l.,m.a.s.l.,
with thewithtwothe two settlements
largest largest settlements at, respectively,
at, respectively, the highest
the highest and lowestand
lowest elevations
elevations of the The
of the village. village. Thesettlement
oldest oldest settlement
is locatedisatlocated at the
the highest highestwhere
altitude, altitude, where the
the residences
residences of the
of the current current
elected elected
village villageand
headman headman
former and former party
communist communist
leaderparty leader The
are located. are located.
current
The current
elected elected
village vice village
headman vicelives
headman
in thelives in the
second second
largest largest settlement
settlement at the
at the lowest lowest altitude.
altitude. Despite
Despite the distance
the distance of only of only approximately
approximately 11 km, 11thekm, the transportation
transportation between between
the two thesettlements
two settlementstakes
takes
aboutabout
1–1.51–1.5
h by hcar,
by due
car, due to the
to the mountain
mountain roads
roads andand their
their condition.From
condition. Fromthethe lowest
lowest settlement,
settlement,
3
Land 2020, 9, 22                                                                                    4 of 15

Manlin is connected to a wider infrastructure network via a paved road that was built in 2000 in joint
collaboration between the government and rubber concession holders, the local “lao bans” with large
rubber plantations. In spring 2015, the process of improving the dirt road connecting the villages
internally was commenced.
     Traditionally, people have practiced shifting cultivation, growing mainly upland rice and maize in
separate rotations while also engaging in animal husbandry including cattle, pigs, and poultry. Today,
the two dominating land uses are rubber- and tea plantations. Since the 1980s, after smallholders in
Manlin started to grow rubber themselves, rubber has been planted on nearly all suitable areas in the
village, including on some marginal and less suitable areas above 1000 m.a.s.l. At higher altitudes, there
are areas of state- and community forests, tea forests, and tea plantations. Most of the tea in Manlin
is ancient forest tea, which comes from the fact that some of the trees can become several hundreds
of years old. In Manlin, the oldest trees are more than 300 years old. Tea was originally grown for
own consumption in the village, but due to significant increases in tea prices, it has become a cash
commodity and an important source of income for local households. According to earlier research in
the village [31], tea prices in Manlin had increased from 2.6 CNY/kg in 1990 to 200 CNY/kg in 2011.
     The differentiation of crops according to altitude is reflected in the local households’ livelihood
activities, as almost all households have rubber plots while larger tea plots are mainly held by
households residing at the main, higher altitude settlement.

2.2. Methodology
     Previous research conducted in 2013 by Mertens et al. [30] in Manlin allowed us to do a temporal
investigation into how rubber price changes have affected local management practices and rubber
perceptions amongst the local people by conducting a household resurvey. The original survey was
conducted with 30 percent of the local households, weighted for each settlement by size and using
convenience sampling within the settlements. We were able to get a 100 percent response rate as all of
the original 30 local households from the first survey participated in the resurvey. The resurvey was
designed with a mix of open- and closed questions, and questions on rubber perceptions and price
fluctuations were added to the original survey. This allowed the respondents to elaborate on their
experiences with rubber farming and livelihood impacts. Data from the household resurvey were
analyzed with the data from the 2013 survey using IBM SPSS Statistics 25 and Excel. The approach
followed that from 2013 by Mertens et al. [30], where Levene’s test was used to assess the equality of
variances before running independent t-tests on the significance between the means of the 2013 and
2015 data. When variances between the groups were significantly different, the parametric t-test was
discarded and the SPSS t-test for cases when equal variances were not assumed were used. Before
running paired-samples t-tests, the data were tested for normal distribution. When normal distribution
was not found, the non-parametric Wilcoxon test was used to estimate significance. For all tests,
significance was tested at a 5 percent level (p < 0.05).
     Qualitative data collection was conducted using the approach adapted from a 2014 version of the
Gennovate methodology [32]. The guide features a qualitative approach to address issues related to,
amongst others, rural innovation, agricultural practices, and gender norms by using interviews and
focus group discussions as the main tools for collecting data. This provided contextual and qualitative
data to support the household re-survey. An overview of the adapted Gennovate methodology applied
is provided in Table 1.
     Semi-structured interviews with male and female key informants in the village were used to
draw a community profile and investigate local farming and community practices. In addition to
the community profiling interviews, interviews were also used to investigate topics related to rubber
farming, livelihood issues, local agencies, and changes in rubber income. Eight semi-structured
interviews were conducted in Manlin: four with male respondents and four with female respondents.
Local connections helped us identify male and female farmers from different socioeconomic strata
and with different rubber farming experiences in order to capture local variation. Interviews were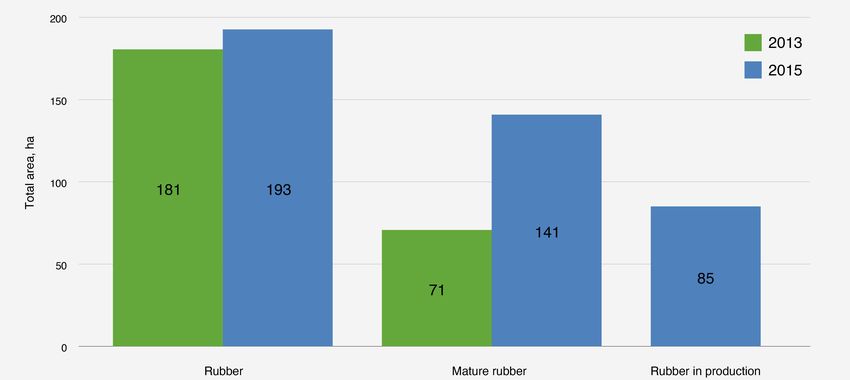
Land 2020, 9, 22                                                                                                    5 of 15

conducted in Mandarin with the assistance of an interpreter. Results from the focus group discussions
were not used in this paper due to our focus on economic inequality.

      Table 1. Overview of the adapted Gennovate methodology, including activity names and
      target respondents.

                    Adapted Gennovate Methodology                                      Target Respondents
                                            Community profiling                 Male and female respondents
          Semi-structured interviews        Innovation pathways              Two male and two female respondents
                                            Individual life stories          Two male and two female respondents
                                               Ladder of life                 Two groups, one male and one female
            Focus group discussions       Capacities for innovation           Two groups, one male and one female
                                            Aspirations of youth              Two groups, one male and one female

3. Results
     By 2015, local households in Manlin had transitioned from traditional subsistence-based to
predominantly commodity-based agriculture, with rubber accounting for more than 80 percent of the
land used in Manlin (HH survey). Between 2013 and 2015, the rubber sales price received by local
producers was about halved, from approximately 16 to 8 CNY per kilo (mode-values, self-reported
value from survey, Manlin; in 2015, 1 USD = 6.227 CNY, OECD (2019)). At the same time, tea prices
had almost doubled from approximately 500 to 1000 CNY per kilo for spring tea and 200 to 400 CNY
per kilo for autumn tea (interview data, Manlin).
     The next sections investigate how the changes in rubber prices have affected local livelihoods
and livelihood strategies in Manlin, including what impacts the price drop had on income, land use,
and land use management decisions in Manlin.

3.1. Changes in Incomes
     Rubber and tea were the two dominant income sources for households in Manlin in both 2013
and 2015, but the share from rubber income to total income had decreased: In 2013, rubber income
made up approximately 60 percent of total income compared to about 30 percent in 2015 (Figure 1).
Although there was no significant difference in the average total household income from 2013 to 2015,
the average income from rubber and tea had changed significantly (Table 2). Besides rubber and tea
income, there were no significant changes in other income sources at a village level.

      Table 2. Mean changes in income from 2013 to 2015 computed in SPSS. The Wilcoxon signed rank test
      was used separately to calculate whether the changes in income were significant. Measured in 100 CNY.

                                                 2013–2015                  Manlin
                                                                              52.3
                                               Total income
                                                                            (655.8)
                                                                            −263.5
                                              Rubber income *
                                                                            (337.5)
                                                                             358.3
                                                Tea income *
                                                                            (534.2)
                                                                              −8.3
                                                 Livestock
                                                                             (36.4)
                                                                              2.3
                                                Remittances
                                                                             (8.9)
                                                                              −4.9
                                                  Pension
                                                                             (31.8)
                                                                             −6.6
                                               Other income
                                                                            (112.2)
                                                                            −122.3
                                                   Debt
                                                                            (572.1)
                                      * Indicates a significant difference at the 0.05 level.
(36.4)
2.3
Remittances
(8.9)
−4.9
Pension
(31.8)
Land 2020, 9, 22
−6.6 6 of 15
Other income
(112.2)
−122.3
Debt
3.2. Land Use Changes (572.1)
* Indicates a significant difference at the 0.05 level.
Between 2013 and 2015, there was little change in overall or individual land use types (Figures 2
3.2. Land
and 3). The areaUse Changes
under rubber was by far the most dominant land use and had increased slightly from
181 to 193 ha, corresponding
Between 2013 to about
and 2015, 7 percent
there was in twoinyears
little change overall(Figure 2). This
or individual landindicates
use typesthat the decline
(Figures
in rubber prices had not affected local land use decisions so far. Because rubber trees are slightly
2 and 3). The area under rubber was by far the most dominant land use and had increased not taken into
from 181 to 193 ha, corresponding to about 7 percent in two years (Figure 2). This indicates that the
production until they are approximately 7–8 years, the total area of rubber does not reflect the current
decline in rubber prices had not affected local land use decisions so far. Because rubber trees are not
economic potential as it includes trees of all ages. Dividing the area under rubber plots into mature
taken into production until they are approximately 7–8 years, the total area of rubber does not reflect
and immature
the current trees showed
economic that the
potential as itarea of mature
includes trees of rubber
all ages. plots hadtheincreased
Dividing area underalmost
rubber 100
plotspercent
from 2013
into mature and immature trees showed that the area of mature rubber plots had increased almostBy 2015,
to 2015, increasing the potential rubber income for local households (Figure 3).
the area100
of percent
rubberfrom 2013 to 2015, had
in production increasing the potential
increased rubberdespite
since 2013, income for local
that households
only about 60 (Figure 3). of the
percent
mature By 2015, the
rubber area
trees of rubber
were in production
actually had increased
in production sinceleaving
by 2015, 2013, despite that only about
the potential 60 percent
income from rubber
of the mature rubber trees were actually in production by 2015, leaving the potential income from
unrealized (Figure 3).
rubber unrealized (Figure 3).
Figure
Figure 2. Changes2. Changes in household
in household land
land useuseallocation
allocation in
inManlin
Manlin village from
village 20132013
from to 2015, measured
to 2015, in
measured in
ha. The category “Forest” refers to areas of forests without rubber or tea.
ha.Land
The2020,
category
9, x FOR“Forest” refers to areas of forests without rubber or tea.
PEER REVIEW 7 of 16
6
Figure
Figure 3. 3. Changes
Changes in, respectively,total
in, respectively, totalrubber
rubber and
andmature
maturerubber areas
rubber between
areas 2013 and
between 2015,
2013 and 2015,
measured in ha.
measured in ha.
3.3. Intra-Village Differences
In the previous sections, we have shown how the drop in rubber prices has had little impact on
the overall local income in Manlin, mainly due to increased income from tea. But this is not the case
when analyzing the village according to its settlements as different ages and locations are reflected
in the current land use patterns: Households in the main settlement hold significantly more areas of
tea and maize than the new settlements, which in turn are much more specialized in rubber farmingLand 2020, 9, 22 7 of 15
3.3. Intra-Village Differences
In the previous sections, we have shown how the drop in rubber prices has had little impact
on the overall local income in Manlin, mainly due to increased income from tea. But this is not
the case when analyzing the village according to its settlements as different ages and locations are
reflected in the current land use patterns: Households in the main settlement hold significantly more
areas of tea and maize than the new settlements, which in turn are much more specialized in rubber
farming (Table 3, Figure 4). There are two main reasons for this difference: Firstly, when rubber gained
popularity, the local people were moving to new areas where they could plant rubber. This explains
why the age of the settlements correlate with the time when rubber was first introduced to the area and
why rubber is the main crop. Rubber plots have also to a higher degree replaced previous areas of
forest in the new settlements than in the main settlement, where rubber often replaced previous areas
of shifting cultivation or other crops. Secondly, most of the tea in the village is very old and grown at
altitudes above 1000 m.a.s.l. where rubber is not deemed suitable and thus is not a competitive crop.
All households in the adjoining and older main settlement have plots of tea compared to 80 percent of
households in the new settlements (HH survey) who are likely to have tea plots through relatives in
the main settlement. The size of tea plots held by households in the main settlement is on average
approximately five times larger than plots held by households in the new settlements (Table 3).
Table 3. Average total and crop-specific land use areas in 2015 for households within the main- and
new settlements. Measured in ha. Standard deviation is shown in brackets. The differences between
settlements were tested using independent samples t-tests.
2015 Main Settlement New Settlements
9.35 6.62
Total area
(6.57) (3.41)
6.84 6.00
Rubber area
(4.80) (3.30)
2.47 3.20
Rubber area, in production
(2.58) (1.51)
1.58 0.28
Tea area *
(1.88) (0.31)
0.91 0.29
Maize *
(0.81) (0.43)
0.01 0.04
Self-owned forest
(0.03) (0.09)
* Indicates that the difference between settlements for this crop is significant at the 0.05 level.
The differences in land holdings and land uses reflect how income is divided among households
in the main and the new settlements: while households in the main settlement made significantly
more money from tea than households in the new settlements in both 2013 and 2015, the households
in the new settlements made significantly more money from rubber (Table 4). For households in
the main settlement, this means that while rubber income significantly decreased between 2013 and
2015, tea income significantly increased and so did the total income (Table 5). For households in the
new settlements, rubber-, and tea income also changed significantly, while total income appeared to
be smaller but not significantly (Table 5). Looking at the standard deviations in Table 5, there are
big intra-settlement variations (CV ≥ 1) in the average changes in total-, rubber-, and tea income for
households in both the main and new settlements, indicating that some households were more affected
by the price increase in tea and price decrease in rubber than others. This variation is also visible
in Table 4, where there are large variations in rubber income for households in the main settlement in
2015 and in tea income for households in the new settlements in both 2013 and 2015.Tea area *
(1.88) (0.31)
0.91 0.29
Maize *
(0.81) (0.43)
0.01 0.04
Self-owned forest
Land 2020, 9, 22 (0.03) (0.09) 8 of 15
* Indicates that the difference between settlements for this crop is significant at the 0.05 level.
Figure 4. Allocation
Figure 4. Allocation of
of land use in
land use in Manlin
Manlin byby settlements
settlements measured
measured in in ha.
ha. The pie charts
The pie charts show
show that
that
rubber is the dominant land use (measured by area for all cases), followed by tea and maize in
rubber is the dominant land use (measured by area for all cases), followed by tea and maize in the mainthe
main settlement, and maize and tea in the new settlements.
settlement, and maize and tea in the new settlements.
Between
The 2013 and
differences 2015,holdings
in land average and totalland
incomeuseschanged
reflect how by 41 percent
income for households
is divided in the main
among households
settlements
in the main and and −27 the newpercent in the new
settlements: settlements.
while households So inalthough
the main the overall picture
settlement is that there
made significantly
has
more been
moneyno financial
from tea impact on local households
than households from the drop
in the new settlements in rubber
in both 2013 andprices (Table
2015, 2), it seems
the households
that
in thethe more
new specialized
settlements madefarmers in the new
significantly moresettlements
money from haverubber
experienced
(Table negative impacts onintheir
4). For households the
income that havethis
main settlement, notmeans
been feltthatby households
while in the main
rubber income settlement.
significantly Instead,
decreased tea has2013
between beenand a buffer
2015,
crop for both
tea income the main and
significantly the newand
increased settlements,
so did the buttotal
most successful
income (Tablein 5).
theFormain settlementinwhere
households the newthe
increased
settlements, income
rubber-,from teatea
and exceeds
income thealsodecreased
changed income from rubber.
significantly, whileFrom total no significant
income appeareddifference
to be
in total household
smaller income between
but not significantly (Tablesettlements
5). Lookinginat2013, households
the standard in the main
deviations settlement
in Table 5, there now areearn
big
aintra-settlement
significantly larger income(CV
variations than≥households
1) in the averagein the new settlements
changes in total-, (Table 4). and tea income for
rubber-,
Table 4 shows
households in boththat thebesides
main and totalnew
income and income
settlements, from rubber
indicating thatand some tea,households
there are nowere significant
more
affected in
changes byincome
the price from increase in tea and
the remaining price
income decrease
sources in rubber
between the twothan others. This
settlement types,variation
indicating is also
that
visible
the localinhouseholds
Table 4, where have notthere are large their
diversified variations
incomes in as
rubber
a result income
of thefor lowhouseholds
rubber prices. in the main
Working
settlement
as hired labor in 2015 andcommon
is not in tea income amongst for households
the households in theinnew settlements one
Manlin—only in both 2013 andreported
household 2015.
income Between
from this 2013source.
and 2015, Still,average
although total
notincome changed
significant, theby 41 percent
numbers for households
in Table 5 suggest that in the main
income
settlements
from “Other” and −27 percent
sources in the new
has increased in settlements. So although
the main settlement andthe overall picture
decreased in the newis that there has
settlements
been no
where financial
a need impact on local income
for supplementary households sourcesfromis the
moredrop in rubber
acute. The incomepricesfrom
(Table 2), it seems
“Other” that
is a small
the more specialized
contributor farmers inincome
to total household the new settlements
(Figure 1, Tables have2 andexperienced
5) and only negative impacts on have
a few households their
that have not
income belonging to thisbeen felt by(8households
category in 2013 andin9 the main In
in 2015). settlement. Instead, teaahas
the new settlements, largebeen
sharea buffer
of the
crop forincome
‘Other’ both the mainfrom
comes and land
the new rentsettlements,
or from selling but most successful
use rights to their in land
the main
for a settlement
number ofwhere years.
the increased
These households income havefrom tea exceeds
typically rented out therubber
decreased
land inincome
exchange fromfor rubber.
a shareFromof theno significant
profit. When
difference
rubber in total
prices went household
down, soincome did thisbetween
type of settlements
“Other” income. in 2013, It households
is quite common in the that
mainhouseholds
settlement
now
in theearn a significantly
village have rented larger income
out land butthan households
if they in the new
are not included in settlements
this list, it is(Table
because4). they either
have received a different kind of payment—a onetime payment–or because their tenants are not yet
tapping rubber, generating no income to share. In the main settlement, a much larger share of income 8
belonging to the “Other” category is generated from small shops. In one case, the “Other” income is
generated from a tea business. From 2013 to 2015, the reported income from this activity has increased
from 8.000 CNY to 35.000 CNY, driven by the increasing tea prices. These causes help explain the
development in income from “Other” sources, and why households seem to have been more affected
in the new and rubber specialized settlements than in the main settlement.Land 2020, 9, 22 9 of 15
Table 4. Average total- and source-specific incomes for 2013 and 2015 for households in Manlin,
according to settlements. Measured in 100 CNY. Standard deviations are shown in brackets. Significant
differences between groups were measured using independent samples t-tests.
Main Settlement New Settlements
Total income
842.5 882.9
2013
(438.9) (515.1)
1.187.7 642.4
* 2015
(812.5) (328.8)
Rubber income
388.3 706.7
* 2013
(350.1) (484.0)
170.0 398.0
* 2015
(201.7) (249.3)
Tea income
410.0 126.7
* 2013
(156.1) (129.4)
1.010.0 243.3
* 2015
(734.5) (244.1)
Livestock
7.0 18.3
2013
(15.3) (46.9)
7.7 1.1
2015
(18.2) (4.1)
Remittances
0.0 0.0
2013
- -
4.7 0.0
2015
(12.3) -
Pension
15.5 1.6
2013
(45.8) (4.5)
4.8 2.5
2015
(5.2) (5.3)
Other income
8.1 88.3
2013
(21.5) (231.9)
32.3 51.0
2015
(92.8) (122.8)
Debt
456.7 320.0
2013
(738.9) (386.7)
273.3 258.7
2015
(345.3) (302.3)
* Indicates a significant difference at the 0.05 level.Land 2020, 9, 22 10 of 15
Table 5. Using paired-samples t-tests to investigate the changes in income from 2013 to 2015 and
whether they have been significant for the main settlement and the new settlements. Measured in
100 CNY.
2013–2015 Main Settlement New Settlements
345.2 * −240.5
Total income
(587.1) (602.0)
−218.3 * −308.7 *
Rubber income
(322.9) (356.8)
600.0 * 358.3 *
Tea income
(649.5) (534.2)
0.7 −17.3
Livestock
(26.1) (43.5)
4.7 0
Remittances
(12.3) -
−10.7 0.9
Pension
(44.8) (3.6)
24.2 −37.3
Other income
(71.7) (137.6)
−183.3 −61.3
Debt
(708.5) (409.9)
* Indicates a significant difference at the 0.05 level.
3.4. Rubber Price Drop: Coping Strategies, Impacts, and Perceptions
As a result of the drop in rubber price, 60 percent of the households in Manlin have changed their
rubber farming practices in some way (Figure 5). The overall most common response has been to
stop or reduce the rubber tapping area or frequency (43 percent), followed by decreasing the amount
of farming inputs such as fertilizers and hired workers (27 percent). The reasoning behind these
adjustments is that the income cannot justify the time spent or previous levels of inputs. Furthermore,
many households have lost the motivation for tapping their plantations even if they have not changed
their practices (HH survey). So far, there have not been problems selling the latex despite lower
demand. The principal buyer remains the nearby rubber factory, which sends someone to pick up the
rubber on a regular basis.
Land 2020, 9, x FOR PEER REVIEW 12 of 16
Figure 5.Figure
The 5.share
The share of households
of households whowho havechanged
have changed management
management practices due to
practices duetheto
drop
theindrop
rubber
in rubber
prices, shown for Manlin overall and the main and new settlements.
prices, shown for Manlin overall and the main and new settlements.
3.5. The Increased Importance of Tea: Readjusting Focus
Despite that rubber plots dominate the landscape and land allocations for all settlements in
Manlin (Table 2), the case from Manlin shows how important tea production is for the local
community. Since tea prices have increased, more buyers come to Manlin to buy the tea. Even when
prices are competitive, the production of tea and rubber complement each other as they grow at
different altitudes, with small or no competition of land, and have different peak seasons andLand 2020, 9, 22 11 of 15
Zooming in, we see that there are differences between how farmers respond at a settlement
level. 73 percent of households in the new settlements changed management practices compared to
47 percent of households in the main settlement. In the new settlements, 60 percent of households
decreased or stopped tapping activities and 33 percent decreased inputs (Figure 5). Decreasing inputs
minimizes costs and explains why this is the most common practice amongst households from the more
rubber-specialized settlements which are more vulnerable to price drops. Surprisingly, households in
the new settlements are also more likely to decrease tapping activities, causing a double impact on their
incomes. This could be an attempt to save tapping the trees for times when prices are higher, as a few
households have mentioned, hoping or expecting better prices in the following years (HH survey).
14 of the 15 households in the new settlements felt an impact of the lower rubber prices (HH
survey) and the majority of households also reported that the drop in rubber prices affected their
everyday lives. Examples include reducing spending on clothes, food, transportation, and education.
In some cases, households have also obtained loans to pay for daily expenses and are afraid of becoming
ill in case they will need to pay a hospital bill. Larger investments, such as the building of a house,
have also been postponed (HH survey). In the main settlement, only one of the 15 households felt
an impact from the drop in rubber prices.
Looking at local risk perceptions, the main concerns are related to how rubber trees are prone
to damage from wind and pests rather than prices. Local households reported no change in their
perceptions of price risks between 2013 and 2015 (HH survey). This could be due to recall bias, or
it can be an indication of local awareness of price fluctuations. By 2015, some households expected
rubber prices to rise again in the coming season, which can explain the strategy to decrease tapping
activities and wait. The local people have already experienced a great increase in income due to rubber,
allowing them to improve their education and standard of living. For the past decades, rubber has
been at the center of local livelihoods and the land use transition towards rubber plots has already
been completed: "No rubber, no life" (Informant, Manlin). However, the local peoples’ satisfaction
with their rubber plots dropped between 2013 and 2015, to the point where 30 percent of households
were not generally satisfied with their plantations. Still, no households in Manlin changed land use as
a result of low rubber prices by 2015 (Figure 5), and only few households (7 percent, HH survey) had
considered a change in land use, in part due to identifying as rubber farmers but also due to a lack of
know how: “I will never change to another crop other than rubber. I never think about it. It would also be
impossible without government support—the provision of knowhow” (Informant, new settlement, Manlin).
Changing land use was thus not strongly considered by local households as a solution to the price
shock, showing some robustness in the current land use to fluctuating prices.
3.5. The Increased Importance of Tea: Readjusting Focus
Despite that rubber plots dominate the landscape and land allocations for all settlements in
Manlin (Table 2), the case from Manlin shows how important tea production is for the local community.
Since tea prices have increased, more buyers come to Manlin to buy the tea. Even when prices are
competitive, the production of tea and rubber complement each other as they grow at different altitudes,
with small or no competition of land, and have different peak seasons and workhours. Activities in the
rubber plots are primarily in the wet season where tapping is done after dark and the latex is collected
in the morning. On the other hand, tea harvesting and processing is done during the day and is the
most valuable in spring, when there is little activity in the rubber plots. Traditionally, the workforce
is also split, with more women and elders taking part in tea production. Table 2 shows how rubber
in Manlin was the most important livelihood activity in monetary terms in 2013, but for households
in the main settlement, tea income was already higher than rubber income by 5 percent. In 2015, the
income from tea was 2.5 times the income from rubber (Table 4). In contrast, tea has neither in the
years 2013 or 2015 been more important than rubber in the new settlements, making only about 1/5
of rubber income in 2013 and 3/5 in 2015 (Table 4). This is due to both decreasing rubber prices and
increasing tea prices. The drop in rubber prices made local households invest less in rubber productionLand 2020, 9, 22 12 of 15
while rising tea prices increased the importance of tea for households with tea land. “After the rubber
prices went down, we now put more time into tea picking.” (Informant, main settlement, Manlin). Between
2013 and 2015, income from tea has increased by 134 percent at the village level while the area of tea
has increased by 7 percent (Figure 3), showing that the increase in income from tea has been from
increasing prices and from refocusing on the existing tea production by increasing labor hours.
4. Discussion
The case of Manlin exemplifies how the commodification of agriculture, a widely occurring
phenomenon at the global scale, often entails economic growth for the local people and communities,
but also comes with elements of social disruption as access to development opportunities is seldom
equal [2], such as in the case of access to tea land in Manlin.
In Xishuangbanna, the commodification of agriculture has been closely linked to the changing
policies from the 1950s and onward, with local land use strategies being shaped by tenure reforms
along with governmental promotion and economic incentives from a protected market to adopt rubber
farming. As such, the Chinese government has played a very active part in the commodification of
agriculture and in the expansion of rubber in Xishuangbanna. The initial interest in state production
of rubber in Xishuangbanna also affected the commodification process indirectly by entailing large
investments in infrastructure development [33], helping to develop the area in general, and especially
the areas suited for rubber farming. In Manlin village, the influence of rubber on local infrastructure
and development is clearly felt: The road network has improved greatly over the past ten years
with help from both the local government and rubber companies, allowing easier transportation and
opening up the area for economic development and business (SSI, village informants) [21]. In this
sense, rubber farming in Xishuangbanna has affected local farmers not only directly through increasing
income but through improved infrastructure and related benefits such as market access, connectivity,
and mobility thus paving the way for increasing the trade of tea, which, according to local respondents,
would otherwise not have reached its current volume. This shows how the household economies
benefiting from tea in Manlin today are in part enabled by the rubber production.
Our finding that rubber-specialized households in Manlin are highly affected by fluctuating
commodity prices also corroborates findings that rubber farming has generally reduced income
diversification in Xishuangbanna [8,16,33,34]. How the local people respond to the drop in rubber
prices may be contingent on a number of aspects. The nature of rubber as a perennial crop with
potentially high costs in start-up investments makes it difficult for producers to respond quickly to
price fluctuations. Producers may also be restricted by limited market information, or local policies
leading to what Brown and Gibson [34] call the planning problem: trying to decide how to manage
their lands without knowing the timing and scale of future market trends. Min et al. [16] describe how
perceived risks are expected to influence land use decisions of local smallholders, as people will make
decisions based on their perceptions. Since the study by Min et al. [16], rubber prices have dropped,
leaving the authors to expect that the risk perception has changed since then: “If risk perceptions have
a significant impact on the land use of smallholder rubber farmers, this relationship will provide an interesting
perspective from which to better understand the possible land use situations of small holder rubber farmers in the
context of declining rubber prices” [16] (p. 197).
When local people in Manlin adopted rubber, it was after seeing how profitable it was in other
places, and seeing that it was a product sought after and promoted by the local government. As such, it
is likely that local farmers have considered risks related to rubber as very small, focusing on optimizing
profits rather than risk mitigation. This translates into the highly specialized rubber landscapes we
see today. Since the price drop, we see that even though some specialized rubber farmers respond
to the declining rubber prices by decreasing tapping activity and that the drop in rubber prices has
affected their income, it generally has not done so to a point where it has become a push factor for new
income-generating activities such as off-farm work. The unavailability of land is also a constraint for
crop diversification as local farmers are not willing to cut down some of their rubber. The completeLand 2020, 9, 22 13 of 15
lack of using land use change as a coping strategy was a surprising find, as replacing rubber with other
crops has been observed elsewhere in Xishuangbanna (Slothuus, C.F, unpublished from observations
and interviews of smallholders). While tea may have acted as a buffer crop to counteract the economic
push for land use change, we expected to see a difference between the settlements and households
with or without access to tea land and alternative income sources. Instead, the reluctance to convert to
other land uses in Manlin could be explained by a persisting expectation in 2015 that rubber prices will
increase again and/or a hesitation to lose the initial investment in plantation establishment after only
4 years of low rubber prices.
Min et al. [16] showed that people at different altitudes are at different risks. Firstly, geographic
location determines the vulnerability of rubber farming as rubber plots at unsuitable elevations
and marginal areas are more exposed to risks than plantations at lower altitudes [18]. Secondly,
the geographic location also influences access to alternative income opportunities. This would suggest
that households in the new settlements in Manlin should be less vulnerable than households in the
old settlement, as they live at lower altitudes and are in closer proximity to infrastructure easing
access to alternative income sources. However, in Manlin, non-farm incomes are rare in all settlements.
Instead the geographical location of settlements is largely an indicator for whether the local households
have access to tea plots and tea as an alternative income source or not, favoring the most remote
and high-altitude settlement. In this case, the characteristics of tea and rubber farming, and the fact
that they are not competing for land, may coincidentally have led to more diversified incomes in the
main settlement and buffered the impact of the drop in rubber prices. As a consequence, intra-village
economic inequality has increased due to the drop in rubber prices and simultaneous rise in tea prices,
with households from the new settlements earning significantly less than households in the main
settlement in 2015.
5. Conclusions
Similar to how other farmers in Xishuangbanna have adopted rubber beyond expectation [9,26]
and improved their livelihoods, many households in Manlin have benefitted greatly from rubber
farming. Rubber production has become so incorporated into the local peoples’ livelihoods that they
identify as “rubber farmers” rather than just “farmers”, which translates into land use decisions that
are not yet challenged by the drop in rubber prices. It also shows how local rubber farmers are not
completely free from the notion of needing government guidance to adapt to the new market situation
and how risky the transition to becoming specialized rubber farmers has been. The importance of
having a crop to fall back on when new crops fail is well known in traditional shifting cultivation
systems, where smallholders scale up or down on rice cultivation and rubber when rubber prices
fluctuate [35] and similar crop flexibilities are shown for other cash crop-rice systems such as pepper [36]
and maize [37]. However, the way that tea is being used as a buffer cash crop by local people engaged
heavily in the rubber rush has not been analyzed in detail previously. In Manlin, households in the
main settlement have been lucky to have tea as a buffer as they have not been as affected by the drop in
rubber prices as their neighbors in the new settlements. As a non-competing land use, tea lands have
not been directly impacted by the massive focus on rubber in the region. Instead, households with
tea have benefitted indirectly from infrastructure improvements that were in part made to support
rubber production, which, together with the timing of high tea prices, has created an effective buffer to
the low rubber prices. Going forward, the increased focus on tea could be a way for local farmers to
reframe themselves, except for those without tea land who risk losing status in the identity of being
successful rubber farmers.
Author Contributions: Conceptualization, C.F.S., D.S.-V. and O.M.; Formal analysis, C.F.S.; Funding acquisition,
D.S.-V. and O.M.; Investigation, C.F.S.; Methodology, C.F.S.; Project administration, C.F.S.; Supervision, D.S.-V.
and O.M; Visualization, C.F.S.; Writing—original draft, C.F.S.; Writing—review & editing, D.S.-V. and O.M. All
authors have read and agreed to the published version of the manuscript.Land 2020, 9, 22 14 of 15
Funding: The research was partly funded by the by the European Community’s Seventh Framework Research
Programme as part of a project entitled Impacts of Reducing Emissions from Deforestation and Forest Degradation
and Enhancing Carbon Stocks (I-REDD+), grant No. 265286, and by the ICRAF Green Rubber project: Green
Rubber: Alleviating poverty and enhancing environmental integrity through restoring ecosystem services in a tropical
plantation crop in the Upper Mekong Region in collaboration with the Kunming Institute of Botany (KIB), which was
funded by the German Federal Ministry for Economic Cooperation and Development (BMZ) and implemented
through Deutsche Gesellschaft fuer Internationale Zusammenarbeit (GIZ).
Acknowledgments: The authors acknowledge the researchers from CGIAR who have developed the Gennovate
methodology on which this research is based.
Conflicts of Interest: The authors declare no conflict of interest.
References
1. Douangsavanh, L.; Thammavong, B.; Noble, A.D. Meeting Regional and Global Demands for Rubber: A Key to
Proverty Alleviation in Lao PDR; Sustainable Mekong Research Network: Bangkok, Thailand, 2008.
2. Van Vliet, N.; Mertz, O.; Heinimann, A.; Langanke, T.; Pascual, U.; Schmook, B.; Adams, C.; Schmidt-Vogt, D.;
Messerli, P.; Leisz, S. Trends, drivers and impacts of changes in swidden cultivation in tropical
forest-agriculture frontiers: A global assessment. Glob. Environ. Chang. 2012, 22, 418–429. [CrossRef]
3. Liu, W.; Hu, H.; Ma, Y.; Li, H. Environmental and socioeconomic impacts of increasing rubber plantations in
Menglun township, southwest China. Mt. Res. Dev. 2006, 26, 245–254. [CrossRef]
4. Müller, D.; Sun, Z.; Vongvisouk, T.; Pflugmacher, D.; Xu, J.; Mertz, O. Regime shifts limit the predictability of
land-system change. Glob. Environ. Chang. 2014, 28, 75–83. [CrossRef]
5. Junquera, V.; Grêt-Regamey, A. Crop booms at the forest frontier: Triggers, reinforcing dynamics, and the
diffusion of knowledge and norms. Glob. Environ. Chang. 2019, 57, 101929. [CrossRef]
6. Xu, J. The political, social, and ecological transformation of a landscape. Mt. Res. Dev. 2006, 26, 254–263.
7. Ziegler, A.D.; Fox, J.M.; Xu, J. The rubber juggernaut. Science 2009, 324, 1024–1025. [CrossRef]
8. Nath, T.K.; Inoue, M.; De Zoysa, M. Small-scale rubber planting for enhancement of people’s livelihoods:
A comparative study in three South Asian countries. Soc. Nat. Resour. 2013, 26, 1066–1081. [CrossRef]
9. Sturgeon, J.C. The Cultural Politics of Ethnic Identity in Xishuangbanna, China: Tea and Rubber as “Cash
Crops” and “Commodities”. J. Curr. Chin. Aff. 2012, 41, 109–131. [CrossRef]
10. Sturgeon, J.C.; Menzies, N. Ideological landscapes: Rubber in Xishuangbanna, Yunnan, 1950 to 2007.
Asian Geogr. 2006, 25, 21–37. [CrossRef]
11. Fox, J.; Castella, J.-C. Expansion of rubber (Hevea brasiliensis) in Mainland Southeast Asia: What are the
prospects for smallholders? J. Peasant Stud. 2013, 40, 155–170. [CrossRef]
12. Fox, J.; Castella, J.; Ziegler, A.; Westley, S. Rubber Plantations Expand in Mountainous Southeast Asia: What
Are the Consequences for the Environment? Asia Pacific Issues, No. 114; East-West Center: Honolulu, HI,
USA, 2014.
13. Ahrends, A.; Hollingsworth, P.M.; Ziegler, A.D.; Fox, J.M.; Chen, H.; Su, Y.; Xu, J. Current trends of rubber
plantation expansion may threaten biodiversity and livelihoods. Glob. Environ. Chang. 2015, 34, 48–58.
[CrossRef]
14. Cramb, R.A.; Colfer, C.J.P.; Dressler, W.; Laungaramsri, P.; Le, Q.T.; Mulyoutami, E.; Peluso, N.L.; Wadley, R.L.
Swidden transformations and rural livelihoods in Southeast Asia. Hum. Ecol. 2009, 37, 323–346. [CrossRef]
15. FAOstat. FAOstat, Data, Crops, Natural Rubber, China. Available online: http://www.fao.org/faostat/en/#data
(accessed on 24 May 2018).
16. Min, S.; Huang, J.; Waibel, H. Rubber specialization vs crop diversification: The roles of perceived risks.
China Agric. Econ. Rev. 2017, 9, 188–210. [CrossRef]
17. Yi, Z.-F.; Cannon, C.H.; Chen, J.; Ye, C.-X.; Swetnam, R.D. Developing indicators of economic value and
biodiversity loss for rubber plantations in Xishuangbanna, southwest China: A case study from Menglun
township. Ecol. Indic. 2014, 36, 788–797. [CrossRef]
18. Chen, H.; Yi, Z.-F.; Schmidt-Vogt, D.; Ahrends, A.; Beckschäfer, P.; Kleinn, C.; Ranjitkar, S.; Xu, J. Pushing the
limits: The pattern and dynamics of rubber monoculture expansion in Xishuangbanna, SW China. PLoS ONE
2016, 11, e0150062. [CrossRef]Land 2020, 9, 22 15 of 15
19. Su, S.; Wan, C.; Li, J.; Jin, X.; Pi, J.; Zhang, Q.; Weng, M. Economic benefit and ecological cost of enlarging tea
cultivation in subtropical China: Characterizing the trade-off for policy implications. Land Use Policy 2017,
66, 183–195. [CrossRef]
20. Ahmed, S.; Stepp, J.R.; Toleno, R.A.; Peters, C.M. Increased Market Integration, Value, and Ecological
Knowledge of Tea Agro-forests in the Akha Highlands of Southwest China. Ecol. Soc. 2010, 15, 27. [CrossRef]
21. Lestrelin, G.; Castella, J.-C.; Li, Q.; Vongvisouk, T.; Tien, N.D.; Mertz, O. A nested land
uses–landscapes–livelihoods approach to assess the real costs of land-use transitions: Insights from southeast
Asia. Land 2019, 8, 11. [CrossRef]
22. Cao, M.; Zou, X.; Warren, M.; Zhu, H. Tropical forests of xishuangbanna, China 1. Biotrop. J. Biol. Conserv.
2006, 38, 306–309.
23. Hu, H.; Liu, W.; Cao, M. Impact of land use and land cover changes on ecosystem services in Menglun,
Xishuangbanna, Southwest China. Environ. Monit. Assess. 2008, 146, 147–156. [CrossRef]
24. Xu, J.; Fox, J.; Vogler, J.B.; Yongshou, Z.P.F.; Lixin, Y.; Jie, Q.; Leisz, S. Land-use and land-cover change and
farmer vulnerability in Xishuangbanna prefecture in southwestern China. Environ. Manag. 2005, 36, 404–413.
25. Huijun, G.; Padoch, C.; Coffey, K.; Aiguo, C.; Yongneng, F. Economic development, land use and biodiversity
change in the tropical mountains of Xishuangbanna, Yunnan, Southwest China. Environ. Sci. Policy 2002, 5,
471–479. [CrossRef]
26. Sturgeon, J.C. Governing minorities and development in Xishuangbanna, China: Akha and Dai rubber
farmers as entrepreneurs. Geoforum 2010, 41, 318–328. [CrossRef]
27. Hammond, J.; Yi, Z.; McLellan, T.; Zhao, J. Situational analysis report: Xishuangbanna autonomous dai
prefecture yunnan, China. World Agrofor. Cent. Work. Pap. 2015, 194, 1–67.
28. Chapman, E.C. The expansion of rubber in southern Yunnan, China. Geogr. J. 1991, 157, 36–44. [CrossRef]
29. Zhang, L.; Kono, Y.; Kobayashi, S.; Hu, H.; Zhou, R.; Qin, Y. The expansion of smallholder rubber farming in
Xishuangbanna, China: A case study of two Dai villages. Land Use Policy 2015, 42, 628–634. [CrossRef]
30. Mertens, C.F.; Bruun, T.B.; Schmidt-Vogt, D.; He, J.; de Neergaard, A. Rural wood consumption patterns of
local and immigrant households with differentiated access to resources in Xishuangbanna, Yunnan, China.
Energy Policy 2015, 80, 112–121. [CrossRef]
31. Zhanli, S.; Müller, D.; Ngo, T.; Nguyen, D.; Kustini, S.; Budiman, A.; Vongvisouk, T. Impacts of Reducing
Emissions from Deforestation and Forest Degradation and Enhancement of Forest Carbon Stocks; I-REDD+:
Copenhagen, Denmark, 2012.
32. Petesch, P.; Badstue, L.; Prain, G. Gender Norms, Agency, and Innovation in Agriculture and Natural Resource
Management: The Gennovate Methodology; CIMMYT: Mexico, 2018.
33. Wu, Z.-L.; Liu, H.-M.; Liu, L.-Y. Rubber cultivation and sustainable development in Xishuangbanna, China.
Int. J. Sustain. Dev. World Ecol. 2001, 8, 337–345. [CrossRef]
34. Brown, O.; Gibson, J. Boom or Bust: Developing Countries’ Rough Ride on the Commodity Price Rollercoaster; IISD:
Winnipeg, MB, Canada, 2006.
35. Dove, M.R. Smallholder rubber and swidden agriculture in Borneo: A sustainable adaptation to the ecology
and economy of the tropical forest. Econ. Bot. 1993, 47, 136–147. [CrossRef]
36. Wadley, R.L.; Mertz, O. Pepper in a time of crisis: Smallholder buffering strategies in Sarawak, Malaysia and
West Kalimantan, Indonesia. Agric. Syst. 2005, 85, 289–305. [CrossRef]
37. Vongvisouk, T.; Mertz, O.; Thongmanivong, S.; Heinimann, A.; Phanvilay, K. Shifting cultivation stability
and change: Contrasting pathways of land use and livelihood change in Laos. Appl. Geogr. 2014, 46, 1–10.
[CrossRef]
© 2020 by the authors. Licensee MDPI, Basel, Switzerland. This article is an open access
article distributed under the terms and conditions of the Creative Commons Attribution
(CC BY) license (http://creativecommons.org/licenses/by/4.0/).You can also read