HOUSING NEEDS ASSESSMENT & MARKET DEMAND STUDY - WENATCHEE URBAN AREA
←
→
Page content transcription
If your browser does not render page correctly, please read the page content below
WENATCHEE URBAN AREA

HOUSING NEEDS ASSESSMENT &
MARKET DEMAND STUDY
September 2016

Table of Contents
Executive Summary............................................................................................................................................... 2
Introduction .......................................................................................................................................................... 4
Study Area............................................................................................................................................................. 4
Population and Household Characteristics ........................................................................................................... 6
Employment.......................................................................................................................................................... 8
Housing Supply ................................................................................................................................................... 10
Housing Affordability .......................................................................................................................................... 17
Comparison of Housing Availability to Housing Need ........................................................................................ 28
Housing Market Demand .................................................................................................................................... 33
Recommendations .............................................................................................................................................. 33
Appendix A. Employment Projections by Wage Level ........................................................................................ 36
Appendix B. Estimated Sales Tax Generated From a Multi-Family Project ........................................................ 37
Appendix C. Inventory of Subsidized Housing .................................................................................................... 39

September 12, 2016                                                                                                                                                     1
EXECUTIVE SUMMARY
Rising housing costs in the Wenatchee region are creating affordability challenges for many households. This
housing needs assessment and housing market demand study is intended to shed light on these challenges.
The Wenatchee region is growing. Demographic and employment projections for the area indicate continued
growth in years to come.
Housing prices are rising. The Wenatchee area housing market has recovered strongly from the downturn in
the housing market during the last economic recession. Since 2012, single family median home sales prices
have risen by 5.7% in the cities of Wenatchee and East Wenatchee. The current single family home median
sales price of $264,550 is affordable to approximately 58% of households, provided the household can afford
a 20% down payment. While condominiums in the City of Wenatchee are more affordable (median sales price:
$171,450), prices are also rising rapidly and increased 6.6% annually during the same period. One key reason
for rising housing prices is a low vacancy rate among for sale housing (1.4%). An additional 675 for sale units
are needed to increase the current vacancy rate to a healthy 5% level.
Rents are rising and vacancy rates are low. Zillow estimates median rents have risen by 6.5% annually since
2012. Multifamily survey data indicates rents may be rising as much as 15% annually in recent years. As of June
2016 the median multifamily rent is estimated to be nearly $1,300. This rent is considered affordable to a
household earning approximately 90% of area median income. However multifamily vacancy rates are very low
at only 1%. Additionally, 10% of rental units are estimated to be overcrowded. This indicates supply is not
keeping up with demand and there may continue to be upward pressure on rents in years to come. Production
of 252 additional multi-family units is needed to increase the current vacancy rate to a healthy 5% level. More
production will be necessary to accommodate continued population and employment growth.
Many households are cost burdened. 31% of Wenatchee area households spent more than 30% of their
income towards housing costs between 2010 and 2014. 12% spent more than 50% of their income on housing.
These numbers are considerably higher for renter households and those earning less than area median income.
One explanation for cost burden among low and moderate income rental households is a lack of market rate
rental housing affordable to higher income earners. Estimates for 2014 indicate there was a surplus of rental
units affordable to households in the 30 – 50%, 50-80%, and 80- 100% of median household income ranges.
However, there was also a deficit of units priced for higher income households. This can result in “down
renting” whereby higher income households occupy units that are less expensive than they can afford,
effectively reducing the supply of units affordable to lower income households.
There is a mismatch between household size and housing stock. Two thirds of housing units in the Wenatchee
area have three or more bedrooms, yet nearly 60% of Wenatchee households have only one or two members.
One bedroom and studio units are in particularly short supply; they account for only 11% of the current housing
supply combined. This finding indicates a significant need for additional smaller housing units.
Subsidized units and vouchers are in high demand. There are currently up to 1,715 households receiving some
kind of subsidy in order to keep housing costs affordable. Yet, as of 2014 there were an estimated 2,855
households earning 50% of the median household income or less. According to the Housing Authority of Chelan
County and the City of Wenatchee, income-restricted housing and Section 8 housing choice vouchers are both
in very high demand with long waitlists.
More senior households are expected. Demographic projections indicate there will be rapid growth in the
number of senior households in coming years as baby boomers enter their 60s, 70s, and 80s. Senior households
have unique housing needs that will shape market demand in years to come.

September 12, 2016                                                                                           2
Recommendations
The findings of this study indicate there is and will continue to be strong demand for smaller housing units.
Encouraging the development of more multifamily and “missing middle” housing types (such as duplexes,
triplexes, townhomes, cottages, and accessory dwelling units) will help to meet this demand and also increase
the supply of workforce housing. This study recommends exploring a number of strategies including:
Expand outreach and marketing to housing developers and trades to expand access to builders and subs
Expand and Leverage the Multifamily Tax Exemption (MFTE) program
Review parking standards
Review barriers to developing “missing middle” housing types
Review the Washington State Housing Finance Commission’s Low Income Housing Tax Credit (4%
credit/bond program scoring (Form 10) with local developers to understand how the City could
contribute to a competitive project. For example, through a land contribution, designating property at-
risk, or financial contribution.
Consider appropriate opportunities for additional residential density
Provide new opportunities to add affordable units through land contributions or other incentives
Maintain awareness of baseline development costs
September 12, 2016 3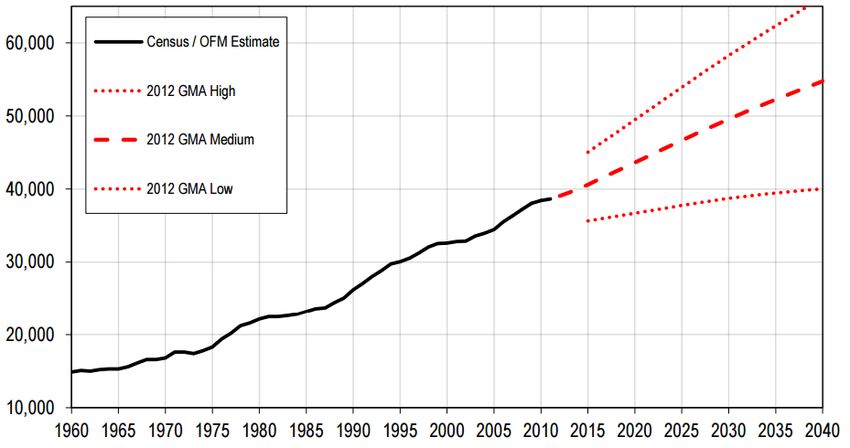
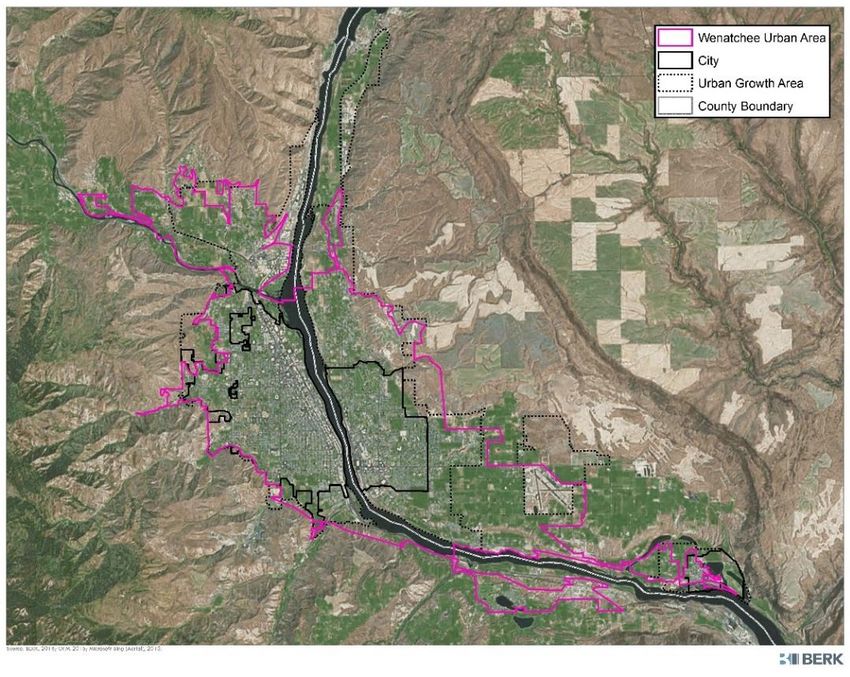
INTRODUCTION
The City of Wenatchee, working in collaboration with the City of East Wenatchee, Housing Authority of Chelan
County and the City of Wenatchee (CCWHA), Chelan County, Douglas County, The Women’s Resource Center,
and Build NCW, has requested an assessment of housing needs and housing market demand. This report
presents an analysis of trends with regards to population and household characteristics, employment growth,
housing supply and market production, and housing affordability in Wenatchee and surrounding communities.
It also assesses the extent to which current housing needs and demands are being met, with an emphasis on
four priority household types: Senior/disabled, workforce, farmworker, and those in need of permanent
supportive housing. Finally, the report offers recommendations for next steps in developing a strategy to
address identified housing challenges.

STUDY AREA
This study assesses housing needs and market demand within the Wenatchee Urban Area, which includes the
Cities of Wenatchee and East Wenatchee as well as parts of Rock Island and surrounding unincorporated lands.
Exhibit 1 shows the Wenatchee Urban Area boundary as well as city and urban growth area boundaries. In
many cases urban growth areas extend beyond the Wenatchee Urban Area boundary. Household
characteristics and growth trends described in this report describe activity inside the Wenatchee Urban Area
unless otherwise specified. Likewise, "Wenatchee" refers to the entire urban area unless otherwise specified.

September 12, 2016                                                                                         4
Exhibit 1. Wenatchee Urban Area

        Source: BERK, 2016; Washington State Office of Financial Management, 2015; Microsoft Bing (Aerial), 2013.

September 12, 2016                                                                                                  5
POPULATION AND HOUSEHOLD CHARACTERISTICS
As of 2015, 69,448 people live in the Wenatchee urban region. Between 2000 and 2015, the population grew
by nearly 12,000 or a rate of 1.3% per year on average. Since 2012, the region has been growing at a rate of
0.8%, or about 560 new residents per year. The Washington State Office of Financial Management (OFM) most
likely growth projection for Chelan and Douglas Counties combined assumes 1.1% annual growth rate over the
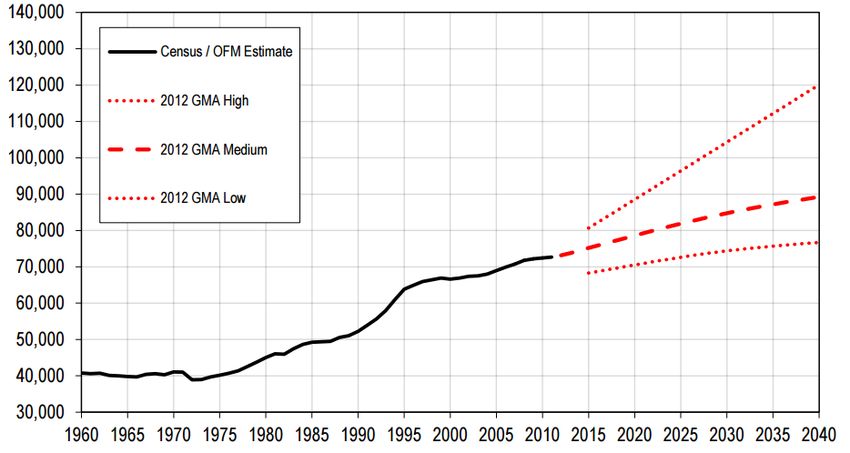
next 10 years. Exhibit 2 and
Exhibit 3 show historic population growth and OFM projections for Chelan and Douglas counties. The 2012
GMA Medium projection is considered most likely.
Exhibit 2. OFM Population Growth Projections, Chelan County
Source: Washington State Office of Financial Management, 2012.
Exhibit 3. OFM Population Growth Projections, Douglas County
Source: Washington State Office of Financial Management, 2012.
September 12, 2016 6The City of Wenatchee and its surrounding urban growth areas are expected to grow by 6,093 in population
(2,497 households) between 2017 and 2037.1 The City of East Wenatchee and its urban growth areas are
expecting population growth of 7,963 between 2015 and 2035.2
Aging Population
Today Wenatchee has a relatively young population with just 14.8% of the population age 65 or older and a
median age of 35.9.3 However, the area is expecting rapid growth in its elderly population during the next 10-
20 years. Exhibit 4 shows the population distribution by age group, including a large number of people age 50-
64 who are approaching retirement age.
Exhibit 4. Age Distribution
Source: U.S. Census, American Community Survey 5-year estimates, 2014.
Demographers at the Washington State Office of Financial Management (OFM) develop population projections
by age for counties across Washington State. In 2015, 17% of the combined population in Chelan and Douglas
counties was estimated to be age 65 or older. This percentage is projected to rise rapidly in coming years, as
shown in Exhibit 5.
1
City of Wenatchee Residential Land Capacity Analysis, May 31, 2016.
2
Greater East Wenatchee Are Comprehensive Plan, 2015.
3
U.S. Census, American Community Survey 2010-2015 5-Year Estimates.
September 12, 2016 7Exhibit 5. Projected Percentage of Population Age 65 or older, Chelan and Douglas Counties
Source: Washington State Office of Financial Management, 2012.
Individuals age 65 and older are more likely to have one or more disabilities than the population at large. Exhibit
6 shows that 36% of all people age 65 and older have one or more disabilities, compared to only 9% of the
population under age 65.
Exhibit 6. Population with a Disability by Age Group
Total Population with Percentage of Population
Population Disability with Disability
All Age Groups 67,719 8,949 13%
Population under 5 years 5,233 16 0%
Population 5 to 17 years old 12,620 755 6%
Population 18 to 64 years old 39,947 4,565 11%
Population 65 years and older 9,919 3,613 36%
Source: U.S. Census, American Community Survey, 2010-2014 5-Year Estimates; BERK 2016.
Disabilities within each age group are broken down by disability characteristics that include: hearing difficulty,
vision difficulty, cognitive difficulty, ambulatory difficulty, self- care difficulty, and independent-living difficulty.
For the population 65 years and older, the breakdown was as follows: 21.9% are living with an ambulatory
difficulty, 17.8% are living with a hearing difficulty, 14.0% are living with a cognitive difficulty, 11.3% are living
with an independent living difficulty, 9.8% are living with a vision difficulty, and 9.1% are living with a self-care
difficulty.
September 12, 2016 8Population Diversity
Within the Wenatchee Urbanized Area 85% identifies as White, 9% identifies as some other race, and 4%
identifies as two or more races. More than one quarter (27%) of Wenatchee residents are Hispanic or Latino.
Exhibit 7. Racial Composition
Source: U.S. Census, American Community Survey 1-year estimates, 2014.
Exhibit 8. Ethnic Composition
Source: U.S. Census, American Community Survey 1-year estimates, 2014.
September 12, 2016 9Household Formation
The Wenatchee area added 798 households between 2010 and 2015, or about 0.63% per year. The greatest
share of household growth has been within cities.4 Within the cities of Wenatchee, East Wenatchee, and Rock
Island 685 new households were added, or about 0.76% per year. Exhibit 9 shows recent household growth
broken down by cities and unincorporated areas.
Exhibit 9. Households Growth, Cities and Unincorporated Areas
Source: Washington State Office of Financial Management, 2016, BERK 2016.
Nearly 60% of households in Wenatchee have only one or two members. Exhibit 10 shows the percentage
share of households by household size.
4
Note that this analysis does not consider growth in nearby unincorporated areas outside of the Wenatchee Urban Area
boundaries.
September 12, 2016 1Exhibit 10. Household Size, Percent of Total Households
Source: U.S. Census, American Community Survey 1-year estimates, 2014; BERK 2016.
One third (33%) of all households in Wenatchee are renter-occupied.5 Exhibit 11 shows persons per household
by tenure. Households with two, three, four, or five members are much more likely to be owner-occupied.
36%, over one-third, of renter households have only one member, 21% of renter households have two
members, and 43% have three or more members.
Exhibit 11. Renter and Owner-Occupied Households by Household Size
Source: U.S. Census, American Community Survey 1-year estimates, 2014; BERK 2016.
5
Source: U.S. Census, American Community Survey 1-year estimates, 2014.
September 12, 2016 2Exhibit 12 compares housing tenure among senior households 65 and older and households under 65.
65% of the population under 65 own their own homes while 76% of the population 65 and older own their
own homes.
Exhibit 12. Household Tenure for Overall Population and Seniors
Note: The number of owner-occupied senior householders is 4,984 and renter-occupied senior householders is 1,571.
Source: U.S. Census, American Community Survey 1-year estimates, 2014; BERK 2016.
Household Income
In 2016, the median household income for the Wenatchee Urban Area is estimated at $53,700.6 Among renter
households,
The U.S. Department of Housing and Urban Development (HUD) defines income categories relative to AMI, or
area median income. For the Wenatchee Metropolitan Area (including Chelan and Douglas counties), AMI for
a family of four is estimated to be $63,100. HUD’s income categories are as follows:
Very Low Income – Under 30% of AMI
Low Income – 30-50% of AMI
Moderate Income – 50-80% of AMI
Lower Middle Income – 80-100% of AMI
Above Median Income – Above 100% of AMI
6
U.S. Census, American Community Survey 5-year estimates (2010-2014), inflation adjusted for 2016.
September 12, 2016 3Exhibit 13 shows incomes for owner and renter households in the Wenatchee area for the period between 2009 and 2013.7 In general, income levels for owner-occupied households are higher -- 29% of owner households had incomes less than the AMI, compared to 62% of renter households during this period. There are significantly more owner households earning above the AMI (70%) than renter households (38%). 7 These income estimates are for the two census defined county subdivisions (CCDs) that encompass the Wenatchee Urban Area. The CCDs include additional rural land outside of the urban area. However, they are not inclusive of the entire two-county metropolitan area. September 12, 2016 4
Exhibit 13. Owner and Renter Households by Income Category

        Source: U.S. Department of Housing and Urban Development, Consolidated Housing Affordability Strategy (based on
        2009–2013 U.S. Census, American Community Survey 5-year estimates); BERK 2016

                     Exhibit 14. Households with Senior Householder by Income Category

        Source: U.S. Census, American Community Survey 5-year estimates, 2010 - 2014; BERK, 2016.

Households with seniors tend to have lower incomes. Over one third (35%) of seniors are in the low or very
low income categories, and only 36% have incomes above median income (see Exhibit 14).

Farmworker Population
As of 2014, there were 9,962 agricultural jobs in Chelan and Douglas counties, a count that includes
farmworkers and other agricultural industry jobs combined.8 Statewide, about 75% of farmworkers are year-
round residents in their communities and 25% are migrant farmworkers, who move away from their primary

8
 Meseck, D. (2016). Wenatchee MSA (Chelan and Douglas Counties) Labor Area Summary May 2016. Washington State
Employment Security Department.

September 12, 2016                                                                                                        5
residence to do their jobs.9 According to Marty Miller, Executive Director of the Office of Rural & Farmworker Housing (ORFH), the percentage of farmworkers that are year-round residents in their communities is increasing.10 Based on findings from a 2008 survey, the statewide average household size for farmworkers was 4.3.11 Of those surveyed 77% lived with family.12 The statewide average annual household income in 2008 was $17,596 for farmworkers who are year-round residents in their communities and $14,000 annually for migrant farmworkers.13 2016 farmworker wage estimates for the Wenatchee MSA indicate the average wage is $13.80 per hour and $28,713 annually for year-round farmworkers.14 This is slightly less than 50% of Wenatchee AMI ($63,100 in 2016). However, the yearly income estimate is likely to be high since farmworkers are typically paid by the hour and are typically not employed for the full year.15 Therefore, based on the 2008 survey findings it is probably more accurate to assume the typical farmworker household with one worker earns closer to 30% AMI. A typical farmworker household with two wage earners could earn up to 60% AMI. Homeless Population Extensive data on homeless individuals and total counts is often difficult to obtain. The City is the lead entity in overseeing the development and administration of the counties’ shared homeless plan.16 Homelessness data for Chelan and Douglas counties comes from the yearly Point-in-Time (PIT) count. According to HUD, this methodology is an annual count of sheltered and unsheltered homeless persons on a single night in January. Both sheltered and unsheltered homeless individuals and families are considered in need of permanent housing. Exhibit 15 shows trends in the annual PIT count of homeless individuals both sheltered and unsheltered in Chelan and Douglas counties combined. 9 Washington State Farmworker Housing Trust, "A Sustainable Bounty: Investing in our Agricultural Future, The Washington State Farmworker Survey," July 2008. 10 Personal Communication with Marty Miller, Executive Director of Office of Rural & Farmworker Housing, August 9, 2016. 11 Washington State Farmworker Housing Trust, "A Sustainable Bounty: Investing in our Agricultural Future, The Washington State Farmworker Survey," July 2008. 12 Ibid. 13 Ibid. 14 Washington State Employment Security Department, “2016 Occupational Employment and Wage Estimates.” 15 Personal Communication with Marty Miller, Executive Director of Office of Rural & Farmworker Housing, August 10, 2016. 16 City of Wenatchee, 2015. Ten-Year Plan to Reduce Homelessness in Chelan and Douglas Counties: 2015 Action Plan Update. September 12, 2016 6
Exhibit 15. Point-in-Time Count, Chelan and Douglas County

        Source: 2015 Action Plan Update: Ten-Year Plan to Reduce Homelessness in Chelan and Douglas Counties, 2015;
        BERK, 2016.

The total number of homeless individuals and families (sheltered and unsheltered) counted in Chelan and
Douglas counties in 2016 was 390. This is a small decrease from the total in 2015, and is also a halfway point
between the highest recorded annual count in 2010 at 542, and the lowest annual count recorded in 2012 at
198. The number of chronically homeless individuals, defined as a person or family that has been homeless
continually for over a year or at least four times in the past three years with a disabling condition, has remained
fairly constant over the past ten years.
The unsheltered homeless population is also of particular concern. Exhibit 16 provides information on the
characteristics of unsheltered individuals and households.

                                   Exhibit 16. Unsheltered Homeless Count

                                     2006 2007 2008 2009 2010 2011 2012 2013 2014 2015 2016
Households without minors              83   60   30   28   59   55   25   62   46   63   74
Households with minors                 75   35   12    3    4    4   12    4    5   48   31
Households with minors only           NR   NR NR     NR     4    0    3    0    0    1    0
Total                                 158   95   42   31   67   59   40   66   51 112 105
        Note: NR indicates Not Reported
        Source: 2015 Action Plan Update: Ten-Year Plan to Reduce Homelessness in Chelan and Douglas Counties, 2015.

The number of unsheltered homeless individuals has increased over the past two years in 2015 and 2016. The
unsheltered homeless population more than doubled from 51 individuals in 2014 to 112 unsheltered
individuals in 2016. In 2016, approximately two-thirds of unsheltered homeless individuals are in households
without minors.

September 12, 2016                                                                                                    7
The Washington State Office of the Superintendent of Public Instruction (OSPI) collects annual data on the
number of homeless students both sheltered and unsheltered. The table below shows the annual homeless
student count for the Wenatchee and Eastmont School Districts combined.
Exhibit 17. Homeless Student Count, Wenatchee and Eastmont School Districts
900
800
700
600
500
400
300
200
100
0
Sheltered Unsheltered Total
Source: Washington State Office of the Superintendent.
The number of homeless students in the two school districts has decreased over past years from a high
point of 810 in 2010-2011 to its current total of 561 homeless students in 2014-2015.
The vast majority of homeless students were sheltered (shelters, doubled-up, hotels/motels).
The number of unsheltered homeless students has remained fairly steady in recent years.
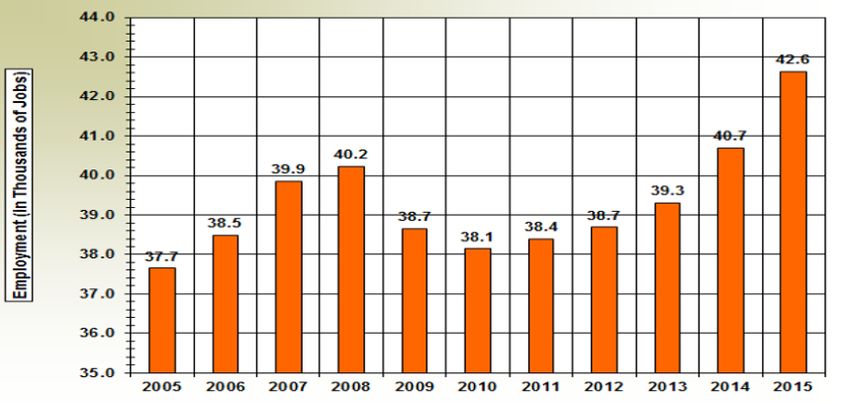
EMPLOYMENT
Employment in the Wenatchee MSA (Chelan and Douglas counties) had been steadily rising between 2010 and
2015, with 4.7% employment growth between 2014 and 2015. In January 2016, the Alcoa aluminum smelter
in Malaga closed, resulting in an estimated loss of 400 jobs in the local manufacturing sector. Consequently,
May 2016 employment is slightly lower than May 2015.17
17
Meseck, D. (2016). Wenatchee MSA (Chelan and Douglas Counties) Labor Area Summary May 2016. Washington State
Employment Security Department.
September 12, 2016 8Exhibit 18. Employment, Wenatchee MSA
Source: Washington State Employment Security Department 2016; Current Employment Statistics (CES), Labor Market
and Performance Analysis; 2005-2015.
Looking forward, the Washington State Employment Security Department’s (ESD) short-term employment
projections for North Central region of Washington (including Wenatchee) show 1.1% average annual growth
between 2015 and 2017. The long term projections indicate 1.79% annual growth between 2014 and 2019,
and 0.87% between 2019 and 2024. These projections indicate the Wenatchee area could benefit from
continued job growth in coming years. Appendix A provides additional information about growth projections
by wage level.
Agricultural Employment
Until April 2014, ESD conducted a monthly Agricultural Employment and Wage Survey to help estimate
agricultural workforce across Washington State. However, this survey has been discontinued. Within the
Wenatchee MSA (Chelan and Douglas Counties), between 2004 and 2014 the number of agricultural jobs
increased from 8,291 to 9,962. This is an increase of 1,671 jobs and an average annual growth rate of 1.85%.18
During this period agricultural jobs also increased as a percentage of the total MSA employment. In 2004
agricultural jobs accounted for 22.8%. In 2014, they accounted for 24.1%.19 Between 2013 and 2014 Chelan
and Douglas Counties added nearly 1,000 new agricultural jobs, an 8% increase.
Many agricultural jobs are in rural areas outside of the Wenatchee urban area. However, according to the
Census, in 2014 there were 3,667 people working in the Agriculture, Forestry, Fishing, and Hunting industry
sector living inside the Wenatchee Urban Area. At the same time there were 3,375 jobs in this sector located
inside the urban area. This indicates there are at least 292 workers who live in the urban area and commute to
jobs outside of the urban area.20
A significant portion of agricultural jobs in the Wenatchee MSA are seasonal. In 2013, the time of the latest
Agricultural Workforce Report from the Washington State Employment Security Department, there were
nearly twice as many estimated agricultural workers in the peak summer months compared to the winter
18
Ibid.
19
Ibid.
20
U.S. Census Bureau. 2016. LODES Data. Longitudinal-Employer Household Dynamics Program.
http://lehd.ces.census.gov/data/lodes/
September 12, 2016 9months.21 Donald Meseck, Regional Labor Economist at ESD, expects central Washington agricultural job
growth to remain high in coming years.22
HOUSING SUPPLY
As of 2015, OFM estimates there are 27,704 housing units in the Wenatchee Urban Area. Approximately 34%
of the units are for rent.23 The vast majority of all housing units are used for full time occupancy. The Census
estimates that only 0.3% of the housing stock is used for “seasonal, recreational, or occasional use.”24 This
indicates there is not a large market for vacation homes within the urban area.
Exhibit 19 shows the breakdown of Wenatchee housing units by type in the year 2015. Exhibit 20 shows the
breakdown of all housing units by number of bedrooms.
Exhibit 19. Housing Supply
Source: Washington State Office of Financial Management, 2015; Chelan County, 2016; BERK, 2016.
As shown in Exhibit 20, 66% of housing units have three or more bedrooms. Yet nearly 60% of Wenatchee
households have only one or two members. This indicates a potential mismatch between the size of homes
available in Wenatchee and the size of households in need of housing.
21
ESD 2015. 2013 Agricultural Workforce. Washington State Employment Security Department.
https://fortress.wa.gov/esd/employmentdata/docs/industry-reports/agricultural-workforce-report-2013.pdf
22
Meseck, D. (2016). Central Washington Economic Update. Presentation to Washington State Adult Education Advisory
Council (AEAC) June 8, 2016.
23
BERK analysis of occupied and vacant units by status. U.S. Census, American Community Survey 5-year estimates, 2010 -
2014.
24
U.S. Census, American Community Survey 5-year estimates, 2010 - 2014.
September 12, 2016 10Exhibit 20. Percentage of Total Housing Units by Number of Bedrooms
50%
45%
40%
35%
30%
25%
45%
20%
15%
24%
10%
16%
5%
8% 5%
3%
0%
Studio 1 bedroom 2 bedrooms 3 bedrooms 4 bedrooms 5 or more
bedrooms
Source: U.S. Census, American Community Survey 1-year estimates, 2014; BERK, 2016.
While the housing supply overall appears to emphasize housing stock with more bedrooms, overcrowding still
exists among some households. Exhibit 21 shows occupancy per room among all Wenatchee households. HUD
defines overcrowding as greater than one occupant per room. Based on this definition, 10% of renter occupied
households are estimated to be overcrowded, while only 2% of owner-occupied households are overcrowded.
Overcrowding can result from a lack of affordable housing in the rental market, leading to situations of
“doubling-up” where one or more adults lives together in addition to the head of household and partner.
Exhibit 21. Percentage of Housing Units that are Overcrowded
Renter Occupied Owner Occupied
Occupants per room
0.50 or less occupants per room 3,491 13,225
0.51 to 1.00 occupants per room 3,699 3,469
1.01 to 1.50 occupants per room 397 317
1.51 to 2.00 occupants per room 440 0
2.01 or more occupants per room 0 67
Number of Overcrowded Units (>1) 837 384
Percentage of Units that are Overcrowded (>1) 10% 2%
Source: U.S. Census, American Community Survey 1-year estimates, 2014; BERK, 2016.
New Home Production
The rate of new housing production has varied in recent years. Exhibit 22 shows net new housing production
by year from 2011 to 2016. During this period, the Wenatchee area added an average of 203 units per year, or
about 0.75% percent annual growth in housing units. This is a slightly faster rate of production than the rate of
household growth during the same period.
September 12, 2016 11Exhibit 22. Net New Units
Notes: OFM records each year of data from April 2 of the previous year to April 1 of the current year. So, 2016 reflects
net new units between April 2, 2015 through April 1, 2016. 2016 data was not available for unincorporated areas.
Source: Washington State Office of Financial Management, 2015 and 2016.
Chelan County planners estimate that the county issues around 23 to 33 residential building permits per year
in the unincorporated area of Malaga, which overlays the southern end of the Wenatchee Urban Area.25 The
County has also received inquiries from developers about higher density residential development in Monitor,
which may result in a request for a zoning change.26
Exhibit 22 shows recent home production by housing type in the cities of Wenatchee, East Wenatchee, and
Rock Island. Of new frame units built during this period, 51% were single family homes while 49% were
multifamily. A large portion of the multi-family units were in a single project built in 2014, Riverside9 (312
units). This swing towards multi-family housing production in cities was offset by development in
unincorporated areas which continues to emphasize single family. From 2010-2016, in unincorporated areas
87% of new housing permits were for single-family units, less than 1% of permits were for multifamily
structures, and 13% of new permits were for other housing types (accessory dwelling units or manufactured
housing and mobile homes). Across the entire urban area about 34% of new units developed were multifamily
during this period.
In 2010, the frame housing stock consisted of 69% single family homes and 31% multifamily homes. So new
production has only slightly tilted towards multi-family in recent years. In 2016 68% of all homes in the urban
area are single-family housing while 32% are multifamily housing
25
Personal Communication with Lilith Yanagimachi, Planner II of Chelan County, August 3, 2016.
26
Ibid.
September 12, 2016 12Exhibit 23. New Housing Unit Production by Type, Incorporated Areas Only
Note: OFM records each year of data from April 2 of the previous year to April 1 of the current year. So, 2016 reflects
production between April 2, 2015 through April 1, 2016.
Source: Washington State Office of Financial Management, 2016; BERK, 2016.
Unfortunately, data about unit size (number of bedrooms) is not available for all new home production.
However, such data is available for the large Riverside9 apartment complex in Wenatchee. 8% of these units
are studios, 52% of units are 1-bedroom, 31% are 2-bedroom, and 10% are live/work. Similar multi-family
projects would help increase the supply of smaller units and help address the large mismatch between
household sizes and unit sizes found in the current housing stock.
September 12, 2016 13Rental Housing Vacancy Rates
Renters make up 33% of all households in the Wenatchee Urban Area and 44% of households in the City of
Wenatchee.27 Exhibit 24 shows the vacancy rate for multifamily housing in the Wenatchee market area. As of
2015, the rate was 2%, down from a rate of 5% in 2013.28 The latest multifamily rental vacancy data available
indicates vacancies are continuing to drop and are now close to 1%.29 This declining vacancy rates indicates
that supply of multifamily housing is not keeping up with demand and this puts upward pressure on housing
costs. A 5% vacancy rate is generally considered to indicate a “healthy” market. There are currently nearly
6,000 multi-family units in the urban area30. In order to achieve a 5% vacancy rate, 252 new multi-family units
are needed. Additional units (beyond the 252) will be needed to accommodate expected population growth in
coming years as well as expand the range of housing choices available to the current population.
Exhibit 24. Multifamily Vacancy Rate, Wenatchee Market Area
Source: Pacific Appraisal Associates, 2016.
For Sale Housing Vacancy Rates
According to data from the 2010-2014 American Community Survey, only 1.4% of all housing units that were
not available for rent were both vacant and for sale. In June 2016, there were 202 active listings of homes for
sale, down 8% from the previous year.31 In order to achieve a 5% vacancy rate among for sale homes, 675 new
units are needed.
Subsidized Housing
There are a total of 549 vouchers and 1,166 subsidized units in Wenatchee and East Wenatchee. Some of the
subsidized units prioritize target populations, such as farmworkers and seniors, as shown in Exhibit 25. Also
targeted in the general low income populations served are single women, households with children, individuals
exiting jail with mental health and chemical dependency issues, and single males. Included in the general low
27
U.S. Census, American Community Survey 5-year estimates, 2010 - 2014.
28
This rate is consistent with findings published in the Spring 2016 Washington Apartment Market Report from Washington
Center for Real Estate Research:
http://realestate.washington.edu/wp-content/uploads/2016/04/spring-2016.pdf
29
Pacific Appraisals Associates, 2016. Wenatchee Area Real Estate Snapshot: June 2016.
http://www.pacapp.com/images/Snapshot%20June2016.pdf. A total of 1,421 multifamily units were surveyed in June 2016.
30
This includes duplexes as well as buildings with 3 or more units.
31
Pacific Appraisals Associates, Wenatchee Area Real Estate Snapshot, June 2016.
September 12, 2016 14income housing summary is transitional housing. In general, to be eligible for general low income multifamily
housing assistance, a household may only have an income of up to 60% of the AMI, although many households
earn far less and some programs have lower AMI cutoffs.
Farmworker housing identifies two priority groups, seasonal and year-round farmworkers. The majority of the
seasonal farmworker housing was developed in 2008 and 2009 with the use of state and USDA funding. The
continuation of State funding for seasonal farmworker housing is uncertain. According to the Chelan County
Housing Authority, demand for housing among farmworkers appears to be well-matched with supply, with
waitlists remaining short and USDA subsidies typically refinancing ahead of expiration. However, there is
concern that changes in federal priorities could impact future funding for this program. Some year-round
farmworkers also benefit from general low income multifamily subsidized housing.32 According to the Chelan
County Housing Authority, there is high demand for senior housing and the ability to keep up with this demand
is a growing concern.33
Exhibit 25 shows the number of vouchers and subsidized units provided on the market in Wenatchee and East
Wenatchee. A more detailed listing of the subsidized housing inventory for Wenatchee and East Wenatchee
is available in Appendix C.
Exhibit 25. Vouchers and Assisted Households and Units, Wenatchee Urban Area
Source: National Housing Preservation Database, 2016; HUD Low Income Tax Credit Database, 2016; Multifamily
Assistance and Section 8 Contracts Database, 2016; Chelan-Douglas County Community Action Council, 2016; Housing
Authority of Chelan County and the City of Wenatchee, 2016; BERK, 2016.
Exhibit 26 shows the number of units with rental assistance funding and tax credits that are expiring within the
next 5 years. In addition, the table shows that all of the 75 Low Income Housing Tax Credit units expiring in the
next five years are privately held. While non-profit owners are more likely to assume ownership of LIHTC units
after tax credit expiration and manage the units as affordable in perpetuity (as the Housing Authority has
identified as a policy), it is less likely that a profit-driven private owner will follow this model. The Chelan County
Housing Authority indicated that when tax credits expire on a privately owned property, the Authority generally
tries to maintain the affordable stock through evaluating whether it makes sense try and purchase the
32
Personal Communication with Alicia McRae, Housing Authority of Chelan County and the City of Wenatchee (CCWHA), August
3, 2016.
33
Ibid.
September 12, 2016 15property. The Authority has often been successful in coming up with funding to purchase privately owned tax
credit properties whenever there is an opportunity to preserve existing affordable housing.34
Exhibit 26. Number of Subsidized Units Expiring in the Next 5 Years
Privately-owned* LIHTC
Expiring in the next 5
Tax Credits and Subsidies Category units expiring in the
years (2021)
next 5 years (2021)
Farmworker Tax Credits 25
Low Income Housing Tax Credits (LIHTC) 75 75
Low Income Rental Assistance Funding 102
TOTAL 202
*Privately held LIHTC units with expirations in the next 5 years include developments owned by Bonaventure Senior Living,
Cascadian Apartments LLC, and Vaugh Bay Construction.
Source: National Housing Preservation Database, 2016; HUD Low Income Tax Credit Database, 2016; Multifamily Assistance
and Section 8 Contracts Database, 2016; Chelan-Douglas County Community Action Council, 2016; Housing Authority of
Chelan County and the City of Wenatchee, 2016
The Chelan County Housing Authority indicated that 549 families are receiving vouchers in 2016 (see Exhibit
25). Demand is very high for vouchers in the Wenatchee/East Wenatchee area. The wait list is open for two
weeks, every three years and there are many applications when the wait list opens.35 The majority of vouchers
are provided by Section 8 funding. Section 8 is HUD program that provides low income families assistance in
the form of vouchers or certificates when they cannot afford market rents or homeownership costs. Depending
on family size, HUD sets income limits for Section 8 voucher eligibility.
Eligibility for Section 8 Vouchers is determined by the local public housing agencies based on annual gross
income and family size. Generally, household incomes cannot exceed 50% of AMI and 75% of a local public
housing agency’s vouchers must go to applicants with incomes below 30% of AMI.
Exhibit 27 lists the 2016 HUD Section 8 Income Limits for the Wenatchee MSA. In 2016, the HUD Section 8
income limits for a low income family of four in the Wenatchee MSA was $48,550.
34
Ibid.
35
Personal Communication with Alicia McRae, Housing Authority of Chelan County and the City of Wenatchee (CCWHA),
August 3, 2016.
September 12, 2016 16Exhibit 27. Section 8 Income Limits, Wenatchee MSA
Extremely Low
Family Size Income Very Low Income Low-Income
1 (70% of 4- person) $12,750 $21,250 $34,000
2 (80% of 4-person) $16,020 $24,300 $38,850
3 (90% 0f 4-person) $20,160 $27,350 $43,700
4 $24,300 $30,350 $48,550
5 (108% of 4- person) $28,440 $32,800 $52,450
6 (116% of 4 (person) $32,580 $35,250 $56,350
7 (124% of 4-person) $36,730 $37,650 $60,250
8 (132% of 4-person) $40,100 $40,100 $64,100
Notes: The Very Low Income Limit is established by setting the 4-person family limit at around 50% of AMI. The Low
Income Limit is established by setting the 4-person family limit at 1.6 times that of the Very Low Income limit for a 4-
person family. The Extremely Low Income Limit for a 4-person family is set at 60% of the 4-person family limit for Very
Low Income. The Extremely Low Income Limits for other family sizes are set at a percentage of the 4-person limit.
Source: U.S. Department of Housing and Urban Development, Section 8 Income Limits, 2016.
HOUSING AFFORDABILITY
Affordability Goals and Policies
The City of Wenatchee’s Comprehensive Plan Housing Affordability Goal states:
Encourage the availability of affordable housing to all segments of the population.
The goal is supported by policies, including implementing regulations that encourage a diversity of housing
types and choice, incentives, residential development of infill sites, and partnership with private and nonprofit
developers to provide new rental and ownership units.36
The City of East Wenatchee’s Comprehensive Plan has a Land Use and Housing goal that states:
To provide for a variety of housing types and densities to ensure a range of affordable housing
options for all segments of the community.
This goal is supported by policies, including the promotion of affordable housing that meets the needs of all
segments through the use of development incentives.37
36
City of Wenatchee. Planning to Blossom 2025: Wenatchee Urban Area Comprehensive Plan. December 2014.
37
City of East Wenatchee. Greater East Wenatchee Area Comprehensive Plan. 2014.
September 12, 2016 17Housing Costs
Rental Housing
Exhibit 28, Exhibit 29, and Exhibit 30 show changes in median rental housing costs between 2012/2013 and
2016. The first two charts are based on data from Zillow.38 The last is based on survey findings from the
Washington Center for Real Estate Research (WCRER). While there are some inconsistencies between the
Zillow and WCRER data – most notably Zillow showing higher median rents for multifamily—each shows rents
rising rapidly in recent years. According to WCRER survey findings, average rents have risen annually by 15.1%
while Zillow shows 5.8% growth. Among all unit types, Zillow shows rents rising at a rate of 6.5% annually.
Exhibit 28. Median Monthly Rent, All Unit Types, Zillow Estimates
$1,600
$1,500
$1,400
$1,300
$1,200
$1,100
$1,000
$900
$800
2012-04 2012-10 2013-04 2013-10 2014-04 2014-10 2015-04 2015-10 2016-04
Wenatchee East Wenatchee
Linear (Wenatchee) Linear (East Wenatchee)
Source: Zillow, Rent Index data, 2016; BERK, 2016.
38
Zillow provides accuracy ratings for median rent by county. Both Chelan and Douglas receive the lowest rating of one star,
presumably due to a low sample size on which their estimate is based. See
http://www.zillow.com/howto/DataCoverageRentZestimateAccuracyWA.htm
September 12, 2016 18Exhibit 29. Median Monthly Rent for Multifamily Units, Zillow Estimates, City of Wenatchee
$1,400
$1,300
$1,200
$1,100
$1,000
$900
$800
2012-04 2012-10 2013-04 2013-10 2014-04 2014-10 2015-04 2015-10 2016-04
Source: Zillow, Rent Index Data, 2016; BERK, 2016.
Exhibit 30. Median Monthly Rent for Multifamily Units, WCRER Survey, City of Wenatchee
$1,200
$1,100
$1,000
$900
$800
$700
$600
$500
2013-09 2014-03 2014-09 2015-03 2015-09 2016-03
Source: Washington Center for Real Estate Research, 2016; BERK, 2016.
As a point of comparison, BERK analyzed all Wenatchee Urban Area rental listings available on Craigslist on
August 9, 2016.39 The results are shown in Exhibit 31. The findings provide a snapshot of how housing prices
vary by unit size. The median rent among just apartment listings (regardless of size) is $1,100. This is just slightly
higher than WCRER’s survey findings and 17% lower than Zillow’s median monthly rent for multifamily units.
39
BERK used some discretion to remove postings that appeared to be scams in order to improve data reliability.
September 12, 2016 19Exhibit 31. Median Monthly Rent for Units Listed on Craigslist, August 9, 2016
Compared to HUD Fair Market Rents
HUD Fair Median % Number of Listed
Number of Median
Market Above/Below Fair Units Under HUD Fair
Listings Rent/Month
Rent Market Rent Market Rent
Studio 1 $990 $529 87% 0
1 Bedroom 12 $1,155 $591 95% 0
All Housing 2 Bedroom, 1 Bath 9 $875 $791 11% 2
Types 2 Bedroom, 1.5 or 2 Bath 11 $1,250 $791 58% 0
3 Bedroom 12 $1,425 $1,052 35% 0
4+ Bedroom 3 $2,250 $1,260 79% 1
Total Listings 48 3
Apartments Only 25 $1,100
Source: Craigslist, 2016; U.S. Department of Housing and Urban Development, 2014; BERK, 2016.
HUD Fair Market Rents for the Wenatchee-East Wenatchee Area are also shown in Exhibit 31. All median rents
by unit type are higher than HUD Fair Market Rents. In the case of one bedroom rentals, the median rent is
nearly double HUD’s Fair Market rent. Only three units out of 48 listings (6%) were listed at a price below HUD
Fair Market Rent.
Ownership Housing
Exhibit 32 shows Zillow’s estimated median home values by housing type for August 2009 through June 2016.
Values for all housing types dipped between 2009 and 2013, reflecting the general downturn in the housing
market following the economic recession of 2008-2009. Housing prices in all categories have steadily risen
since 2013, with the steepest gains shown in East Wenatchee (nearly 21% average annual growth between
June 2014 and June 2016). The most affordable category of home is condominium units in the City of
Wenatchee, which are roughly on par with Zillow’s estimate for the “Bottom Tier” median home values in City
of Wenatchee.40 The estimated cost differential between condos and single family homes is much lower in East
Wenatchee.
40
Zillow defines the “Bottom Tier” as the bottom one third of housing stock in terms of value. Therefore, roughly one sixth of
the total housing stock would be expected to be priced lower than the median of the “Bottom Tier.”
September 12, 2016 20Exhibit 32. Median Home Value, Zillow Estimates
$350,000
$300,000
$250,000
$200,000
$150,000
$100,000
Wenatchee Single Family ZHVI East Wenatchee All Homes ZHVI
Wenatchee Condo ZHVI East Wenatchee Condo ZHVI
Wenatchee Bottom Tier ZHVI East Wenatchee Bottom Tier ZHVI
Source: Zillow, Home Value Index Data, 2016; BERK, 2016.
Exhibit 33 shows median home sales prices for City of Wenatchee and East Wenatchee between 2005 and 2016
year to date. The values and trends are similar to those shown in Zillow data, with one main exception. The
rapid increase in value that Zillow shows for East Wenatchee during the past year is not evident in home sales
prices. Instead single family sales prices have been fairly consistent with those in Wenatchee.
Exhibit 33. Median Home Sales Price
$350,000
$300,000
$250,000
$200,000
$150,000
$100,000
$50,000
$0
2005 2006 2007 2008 2009 2010 2011 2012 2013 2014 2015 2016
(YTD)
Wenatchee SF Wenatchee Condo
East Wenatchee SF East Wenatchee Condo
Source: Pacific Appraisal Associates, 2016; BERK, 2016.
September 12, 2016 21Exhibit 34 shows average annual growth rates from 2012 to 2016 year to date.
Exhibit 34. Median Home Value Average Annual Growth Rate, 2012 – 2016 YTD
Wenatchee East Wenatchee
Single-Family 5.73% 5.72%
Condo 6.56% 1.63%
Source: Pacific Appraisal Associates, 2016; BERK, 2016.
Exhibit 35 shows the annual income needed to purchase a single family home in Wenatchee. Assuming
the household can handle a 20% down payment, a household requires at least $55,273 in yearly income
to afford a home at the 2016 median selling price. This is slightly more than area median income of
about $53,700 (2009-2014 estimated median household income, inflation adjusted for 2016).
Approximately 58% of households earn this much income, although it is possible that not all could afford
the 20% down payment assumed in this calculation.
Exhibit 35. Annual Income Needed to Purchase a Single Family Home at Median Listing Price
Monthly Mortgage
Median Selling Price (June 2016 for Wenatchee Area) $264,550
Down Payment (20%) $52,910
Mortgage Amount $211,640
Interest Rate 4%
Payments over 30 years 360
Monthly Mortgage Payment $1,007
Annual Housing Expenses
Mortgage Payments $12,085
Taxes (1.2%) $3,175
Insurance ($5.00 per $1,000) $1,323
Total Annual Costs $16,582
Total Monthly Costs $1,382
Annual Income Needed (30% housing costs) $55,273
Monthly Income Needed (30% housing costs) $4,606
Households
Number of households with income > $55,273 14,751
Total households 25,360
Estimate of households that can afford median home price 58%
Notes: Median selling price is for June of 2016. The median household income used to determine how many
households make enough to afford a mortgage was for the Wenatchee Urbanized Area.The 2010 – 2014 ACS 5-year
estimate was inflation adjusted to 2016 using the Bureau of Labor Statistics CPI Inflation Calculator.
This homebuyer calculation assumes a 20% down payment, annual property taxes of 1.2% of sales value, and annual
insurance of $5.00 per $1,000 of sales value.
Source: Pacific Appraisal Associates, 2016; U.S. Census, American Community Survey 5-year estimates, 2014; Bureau
of Labor Statistics, CPI Inflation Calculator, 2016; BERK, 2016.
September 12, 2016 22Comparison to Eastern Washington Jurisdictions
Housing prices in the Wenatchee metropolitan area (Chelan and Douglas Counties combined) are
significantly higher than other Eastern Washington metro areas. Exhibit 36 compares home values in
Wenatchee MSA to Yakima, Spokane, and the Tri-Cities. Median value per square foot in Wenatchee is 72%
higher than Yakima, 49% higher than Spokane, and 39% higher than the Tri-Cities. Exhibit 37 through Exhibit
39 show historic changes in median home values for all single family residences, the bottom third of all
homes, and median value per sq ft.
Exhibit 36. Comparison of Median Home Values as of June 2016
Single Family Bottom Third of Median Value per
Metro Area
Residences Home Values S.F.
Wenatchee $275,600 $181,900 $196
Yakima $156,500 $100,200 $114
Spokane $183,300 $119,800 $132
Tri-Cities $216,300 $144,500 $141
Source: BERK, 2016; Zillow, 2016.
Exhibit 37. Median Home Value for Single Family Residences, 2010-2016
Source: BERK, 2016; Zillow, 2016.
September 12, 2016 23Exhibit 38. Median Home Value Among Bottom Tier of Home Inventory, 2010-2016
Source: BERK, 2016; Zillow, 2016.
Exhibit 39. Median Value per Square Foot, 2010-2016
Source: BERK, 2016; Zillow, 2016.
Cost Burden
HUD deems housing to be affordable if a household spends no more than 30% of their income on housing costs
(rent plus basic utilities or gross monthly owner costs). Households are considered to be cost burdened if they
pay more than 30% of their income towards housing costs. Households paying more than 50% of their incomes
towards housing costs are considered severely cost burdened.
HUD publishes cost burden estimates based on data from the U.S. Census American Community Survey 5-year
estimates. The latest survey period for which data is available is 2009-2013. This means that cost burden
estimates reflect income and housing costs as reported by a sample of Wenatchee are residents during a rolling
monthly survey between January 2009 and December 2013. This period includes the downturn in the housing
September 12, 2016 24market during and following the last economic recession. As shown above, housing costs have rapidly increased
during the past few years, a fact that should be considered when interpreting cost burden data from HUD.
Exhibit 40 shows estimates of cost burden for Wenatchee area renter and owner occupied households for the
years 2009 through 2013.41 Nearly 32% of all households were estimated to be either cost burdened or severely
cost burdened during this period of analysis. A greater percentage of renter households were cost burdened
(42%) than owner households (26%).
Exhibit 40. Cost Burdens Estimate, Wenatchee and East Wenatchee CCDs
Note: * “Not Calculated” refers to households with no or negative income.
Source: U.S. Department of Housing and Urban Development, Consolidated Housing Affordability Strategy (based on
U.S. Census American Community Survey 2009–2013 5-Year Estimates); BERK, 2016.
Renter Cost Burden
Exhibit 41 breaks down renter cost burden by income level. Not surprisingly, the greatest share of severely cost
burdened households and burdened households are in the Very Low Income (82%) and Low Income (91%)
categories. Only 8% of renter households with incomes above AMI experience a housing burden.
41
Estimates are for all households in the Wenatchee and East Wenatchee census defined county subdivisions (CCDs), which
collectively are larger than the Wenatchee Urban Area.
September 12, 2016 25Exhibit 41. Renter Burdens by Income Category Estimate, Wenatchee and East Wenatchee CCDs
Source: U.S. Department of Housing and Urban Development, Consolidated Housing Affordability Strategy (based on
U.S. Census American Community Survey 2009–2013 5-Year Estimates); BERK, 2016.
Owner-Occupied Household Cost Burden
Exhibit 42 breaks down all owner-occupied households by income level based on 2014 AMI. The majority of
owner-occupied households (61%) have incomes above AMI and there are less owner households in
Wenatchee that fall under the low income categories than there are renters.
Exhibit 42. Owner Households by Income Category, Wenatchee and East Wenatchee CCDs
Ratio to 2014 Median
Household Income for the Rounded (1,000s) Income Ranges
Wenatchee Urbanized Area Estimated Owner HHs
$52,824 Low High Estimated HHs Percent
Under 30% $0 $16,000 1,046 6%
30 - 50% $16,000 $26,000 1,441 9%
50 - 80% $26,000 $42,000 2,338 14%
80 - 100% $42,000 $53,000 1,760 11%
100 - 120% $53,000 $63,000 3,510 21%
120% or Over $63,000 6,661 40%
Total 16,757 100%
Note: Given the estimates and margins of error associated with the American Community Survey data on owner households by
income level, this data is meant to represent an overall picture of conditions in 2014 and not provide a precise count of rental
units on the market.
Source: U.S. Census, American Community Survey 2010 - 2014 5-year estimates, 2014; BERK, 2016.
September 12, 2016 26Exhibit 43 breaks down owner-occupied housing cost burden by income level. The majority of owner-occupied households have incomes above AMI, and only 16% of these household experience housing cost burden or severe cost burden. This percentage goes up considerably for households with incomes below AMI. Only 17% of owner households with very low income (
COMPARISON OF HOUSING AVAILABILITY TO HOUSING NEED
Rental Housing and Low Income Households
Exhibit 45 compares estimated renter household counts by income range to the estimated number of housing
units offered on the market at those income levels. As with the cost burden data shown above, this data
summarizes conditions during a 5-year period: in this case 2010 to 2014. This period includes the downturn in
the housing market following the last economic recession and only partially overlaps the more recent period
of rapidly rising housing costs. These facts should be considered when interpreting the findings.
During the period for which data is available (2010-2014), there was a surplus of rental units available to those
in the Low (30 – 50% AMI), Moderate (50 – 80% AMI), and Lower Middle (80 – 100% AMI) income categories.
There was also a deficit of units available for those in the Very Low (Under 30%) and above median household
income categories. Overall, it is estimated that there was a surplus of units available.
Exhibit 45. Rental Unit Income and Gap, 2010 – 2014, Wenatchee CCD and East Wenatchee CCD
Ratio to 2014 Median
Household Income for Rounded (1,000s) Monthly Housing H
the Wenatchee Income Ranges* (ACS) Budget* Estimated Renter
Urbanized Area Estimated Gap
HHs* (ACS)
Units
$52,824 Low High Low High Count Percent over/(under)
Offered
Under 30% $0 $16,000 $0 $400 1,589 19% 501 (1,088)
30 - 50% $16,000 $26,000 $400 $650 1,266 15% 1,834 567
50 - 80% $26,000 $42,000 $650 $1,050 1,847 22% 4,915 3,067
80 - 100% $42,000 $53,000 $1,050 $1,325 997 12% 1,061 64
100 - 120% $53,000 $63,000 $1,325 $1,575 572 7% 383 (189)
120% or Over $63,000 $1,575 2,052 25% 452 (1,601)
Total 8,324 100% 9,145 821
*Based on 30% of income.
Note: Rental rates reflect estimated conditions from 2010 – 2014 by the American Community Survey. Rents have been
increasing rapidly since this period and the current situation may reflect greater gaps in housing available to lower and
moderate income households. In addition, American Community Survey data represent estimates of renter household counts
by income level and units available at specific rent levels. Each estimate is associated with a margin of error. So this data is
meant to represent an overall picture of conditions during the 2010 - 2014 period and is not meant to provide a precise
count of current rental units on the market.
Source: U.S. Census, American Community Survey, 2010 - 2014 5-Year Estimates; BERK, 2016.
There is an apparent inconsistency between these findings and the high levels of cost burden experienced by
renters in the Low, Moderate, and Lower Middle Income categories. However, there are a number of possible
explanations. First, since there is a deficit of units priced for those with incomes above the AMI, these middle-
and higher income households are likely occupying some share of the units that would otherwise be affordable
to those with lower incomes. Often referred to as “down renting,” this can reduce the supply of units affordable
to those with lower incomes. These findings also do not consider the alignment between household size and
affordable units at an appropriate size. While there may be affordable one bedroom units available, those units
would likely not meet the needs of a 5-person family earning 50% AMI. Finally, the cost of utilities is not
September 12, 2016 28You can also read