Microplanning for Immunization Service Delivery Using the Reaching Every District (RED) Strategy A WHO-UNICEF document
←
→
Page content transcription
If your browser does not render page correctly, please read the page content below
Microplanning for Immunization Service Delivery
Using the Reaching Every District (RED) Strategy

                       A WHO-UNICEF document

                       i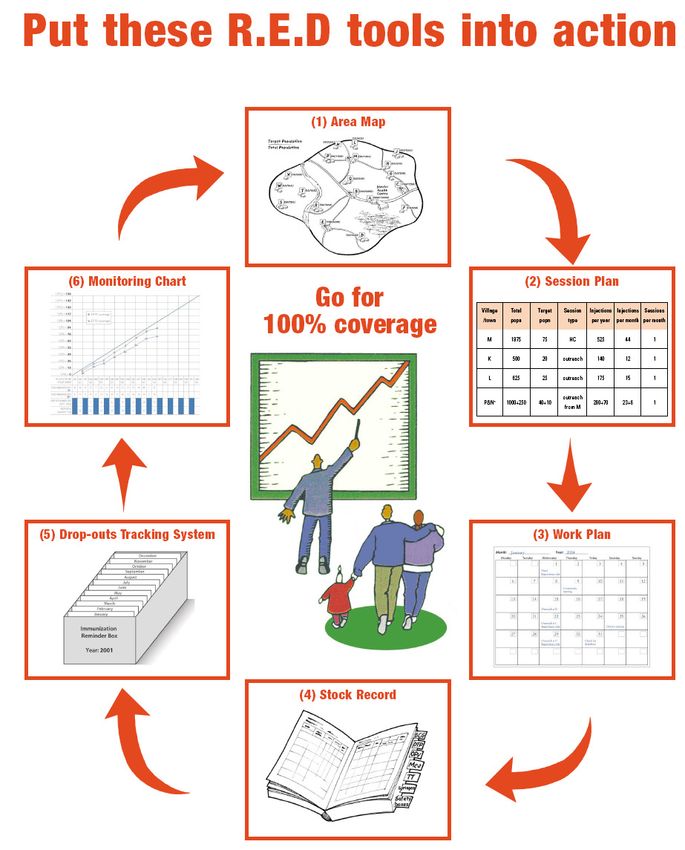
The Department of Immunization, Vaccines and Biologicals
                          thanks the donors whose unspecified financial support
                           has made the production of this publication possible.

                                        This publication was produced by the
                                      Expanded Programme on Immunization
                            of the Department of Immunization, Vaccines and Biologicals

                                            Ordering code: WHO/IVB/09.11
                                                Printed: October 2009

                                   This publication is available on the Internet at:
                                          www.who.int/vaccines-documents/

                                          Copies may be requested from:
                                             World Health Organization
                                Department of Immunization, Vaccines and Biologicals
                                          CH-1211 Geneva 27, Switzerland
                                • Fax: + 41 22 791 4227 • Email: vaccines@who.int •

                                           © World Health Organization 2009

All rights reserved. Publications of the World Health Organization can be obtained from WHO Press, World Health
Organization, 20 Avenue Appia, 1211 Geneva 27, Switzerland (tel: +41 22 791 3264; fax: +41 22 791 4857; email:
bookorders@who.int). Requests for permission to reproduce or translate WHO publications – whether for sale or for non-
commercial distribution – should be addressed to WHO Press, at the above address (fax: +41 22 791 4806; email:
permissions@who.int).

The designations employed and the presentation of the material in this publication do not imply the expression of any
opinion whatsoever on the part of the World Health Organization concerning the legal status of any country, territory, city or
area or of its authorities, or concerning the delimitation of its frontiers or boundaries. Dotted lines on maps represent
approximate border lines for which there may not yet be full agreement.

The mention of specific companies or of certain manufacturers’ products does not imply that they are endorsed or
recommended by the World Health Organization in preference to others of a similar nature that are not mentioned. Errors and
omissions excepted, the names of proprietary products are distinguished by initial capital letters.

All reasonable precautions have been taken by the World Health Organization to verify the information contained in this
publication. However, the published material is being distributed without warranty of any kind, either expressed or implied.
The responsibility for the interpretation and use of the material lies with the reader. In no event shall the World Health
Organization be liable for damages arising from its use.

                                                              ii
Table of contents Abbreviations and acronyms .......................................................................................................... iv Introduction ....................................................................................................................................... 1 Purpose of this guide ...................................................................................................................................... 1 INTRODUCTION TO THE REACHING EVERY DISTRICT (RED) STRATEGY ................ 3 Part 1: Health facility microplanning ............................................................................................. 5 Step 1: Quantitative analysis of local immunization data ............................................................................... 6 Step 2: Preparing and reviewing an operational map.....................................................................................11 Step 3: Identifying special activities for the hard-to-reach and problem areas...............................................13 Step 4: Preparing a health facility session plan..............................................................................................16 Step 5: Problem solving using the RED strategy ...........................................................................................20 Step 6: Making a workplan for one quarter....................................................................................................23 Step 7: Using the monitoring charts...............................................................................................................26 Step 8: Working with the community and tracking defaulters .......................................................................29 Step 9: Managing supplies.............................................................................................................................31 Step 10: Making use of the monthly report ....................................................................................................34 Annex 1: Simple questionnaire to investigate reasons for low coverage and dropouts ........... 36 Annex 2: Worked examples............................................................................................................ 39 Annex 3: Special considerations for health facilities serving the hard-to-reach....................... 42 Annex 4: Planning to reach high-risk urban areas ...................................................................... 44 Preparing a map for urban immunization.......................................................................................................44 Special planning issues for reaching the urban poor ......................................................................................46 Part 2: District microplanning....................................................................................................... 48 Step 1: Analyses of district level data to identify priority areas .....................................................................49 Step 2: Making a map to show all health facilities and outreach sites ...........................................................50 Step 3: Making a district workplan ................................................................................................................52 Step 4: Making an estimate of resource requirements....................................................................................56 Step 5: Conducting regular monitoring and review of progress .....................................................................59 Step 6: Taking action based on a review of progress .....................................................................................61 Part 3: Microplanning FAQs ......................................................................................................... 63 FAQs: Conducting a data analysis .................................................................................................................64 FAQs: Preparing a map .................................................................................................................................64 FAQs: Preparing a session plan ....................................................................................................................65 FAQs: Using the RED strategy......................................................................................................................66 FAQs: Preparing a workplan. .......................................................................................................................67
Microplanning for Immunization Service Delivery Using the Reaching Every District (RED) Strategy

                 Abbreviations and acronyms
AD                           auto-disable (syringe)
AEFI                         adverse events following immunization
AFP                          acute flaccid paralysis
BCG                          bacille Calmette-Guérin (vaccine)
DO                           drop-out number
DTP                          diphtheria-tetanus-pertussis (vaccine)
DTP-HepB                     A combination vaccine containing DTP and hepatitis B vaccines
DTP-HepB+Hib                 A combination vaccine containing DTP, HepB and Haemophilus influenzae
                             type b vaccines
FAQs                         frequently asked questions
HepB                         hepatitis B (vaccine)
Hib                          Haemophilus influenzae type b (vaccine)
HF                           health facility
MNT                          maternal and neonatal tetanus
NGO                          Non-Governmental Organization
NIDs                         national immunization days
OPV                          oral polio vaccine
Penta                        pentavalent vaccine (DTP-HepB+Hib)
RED                          Reaching Every District
SIA                          supplementary immunization activity/activities
Td                           tetanus-diphtheria toxoids
TT                           tetanus toxoid
UNICEF                       United Nations Children's Fund
VPD                          vaccine-preventable disease
VVM                          vaccine vial monitor
WHO                          World Health Organization
YF                           yellow fever
Microplanning for Immunization Service Delivery Using the Reaching Every District (RED) Strategy
Introduction
Purpose of this guide
The purpose of this guide is to strengthen district and health facility capacity to:
• produce high quality microplans;
• increase immunization coverage and reduce drop-outs for infants and pregnant women;
• identify and target the unreached;
• regularly use data to monitor and follow up at all levels.
The guide is based on successful country experiences in microplanning, using the Reaching Every
District (RED) strategy. The guide uses a 'bottom-up' approach: it starts with health facility (service
delivery) microplans which will then be put together to make the district microplan.
There are three parts to this guide.
Part 1: Health facility microplanning
Part 2: District level microplanning
Part 3: Microplanning FAQs
Summary of Contents
Part 1: Health facility microplanning
Part I describes how to make a microplan at the health facility level. The guide is interactive and
describes how health facility staff can analyse their own data and identify problems, and find
solutions, using the RED strategy as a framework. We recommend that the guide be used during
workshops, facilitated by staff from the district and other levels. Various tables and worked examples
are provided.
Output: At the end of the workshop, health facility staff will have made a workplan for three months,
and will understand how to use the six RED tools: the map, session plan, workplan, stock record,
drop-out tracking system, and monitoring chart.
There are 10 steps to making a health facility microplan:
Step 1: Quantitative analysis of local immunization data
Step 2: Preparing and reviewing an operational map
Step 3: Identifying special activities for the hard-to-reach and problem areas
1Microplanning for Immunization Service Delivery Using the Reaching Every District (RED) Strategy
Step 4: Preparing a health facility session plan
Step 5: Using the RED strategy for problem solving
Step 6: Making a workplan for one quarter
Step 7: Using a monitoring chart
Step 8: Working with the community and tracking defaulters
Step 9: Managing supplies
Step 10: Making use of the monthly report
Annex 1, 2, 3 and 4
Part 2: District level microplanning
Part 2 uses the ‘bottom-up’ approach by describing how a district can put together all the health
facility microplans to make a district microplan. It also describes how the district can help to do the
following:
• solve service delivery problems
• make a budget
• add a system to monitor and follow up on progress.
This guide is interactive and requires district staff to analyse and use their own current immunization
data to set priorities.
Output: A district microplan that includes a district map, a calendar of sessions and events, an
activity plan, and budget.
There are six steps to making a district microplan by putting together all the health facility
microplans:
Step 1: Analyses of district level data to identify priority areas
Step 2: Making a map to show all health facilities and outreach sites
Step 3: Making a district workplan
Step 4: Making an estimate of resource requirements
Step 5: Conducting regular monitoring and review of progress
Step 6: Taking action based on a review of progress
Part 3: Microplanning FAQs
Part 3 contains FAQs on the various aspects of microplanning.Microplanning for Immunization Service Delivery Using the Reaching Every District (RED) Strategy
INTRODUCTION TO THE REACHING EVERY DISTRICT (RED)
STRATEGY
History of the RED strategy
The RED strategy was developed and introduced in 2002 by WHO, UNICEF and other partners to
help improve immunization systems. The RED strategy encourages districts and health facilitiesa to
make microplans to identify local problems and find corrective solutions, using their own data. Since
2002, several countries worldwide have started implementing RED strategies to varying degrees, and
country evaluations in 2005 and 2007 have shown that implementation of the RED strategy results in
significantly more infants being reached. An important finding of these evaluations was that service
delivery works best when health facilities make their own microplans. In some countries, the RED
strategy has been used as the basis for delivering other interventions beyond immunization, to
strengthen the health system.
References related to the RED strategy:
Reaching Every District Strategy Implementation in the Africa Region: Evaluation Report. World
Health Organization Regional Office for Africa, June 2005.
http://www.who.int/immunization_delivery/systems_policy/AFRO-REDevaluationreport_2005.pdf
In-Depth Evaluation of the Reaching Every District Approach in the African Region. World Health
Organization Regional Office for Africa, 2007. http://www.afro.who.int/ddc/vpd/routine/red-
2007.pdf
Reaching Every District Approach: A Guide for District Health Management Teams
http://www.who.int/immunization_delivery/systems_policy/AFRO-RED_Aug2008.pdf
a
Definitions: 1st level – national level, 2nd level – province/state, 3rd level – district/county/township/municipality,
4th level – health facility level
3Microplanning for Immunization Service Delivery Using the Reaching Every District (RED) Strategy Description of the five operational components of the RED strategy 1. Re-establishing outreach services In many countries, a large proportion of the population can only have access to immunization services through outreach, therefore regular outreach should be incorporated in all session plans. For some communities, access can only be provided infrequently by mobile teams and may need additional resources. Outreach and mobile team sessions are opportunities to provide other interventions with immunization to people who have difficulty reaching health centres. 2. Supportive supervision Supportive supervision is a means of providing on-site training to health workers at the time of supervisory visits, or at regular meetings. To be supportive, supervisors should make regular visits, help to solve problems locally and follow up regularly with supply and resource issues. Supervisors will themselves need training to adapt their own approaches to supervision. 3. Linking services with communities The best kind of service is one that involves the community in planning and delivery. Making regular contact, or holding regular meetings with the community can help to identify convenient times and places for sessions, roles for community volunteers, such as identifying newborn infants and pregnant women, and defaulter follow-up. 4. Monitoring and use of data for action Monitoring and use of data for action implies not only the timely collection of data at various levels, but also the timely use of the data to solve problems. Some simple monitoring tools, including wall charts, are needed to track monthly progress. In addition, other useful information on logistics, supply, and surveillance is usually collected on a monthly basis. Regular analysis of all these data will help identify problems and find solutions to improve the immunization system. 5. Planning and management of resources An effective plan which includes resource requirements is essential to deliver a service that reaches everyone. The microplan should be based upon a detailed knowledge of the local situation, including a map showing health facilities, population distribution, and the types of session needed to reach them. At the national level, there is a responsibility to ensure that the needed financial and human resources are available to districts and managed correctly, while the district must ensure that sufficient resources are available to health centres to deliver the service.
Part 1: Health facility microplanning

    Part 1: Health facility microplanning
Step 1: Quantitative analysis of local immunization data

Step 2: Preparing and reviewing an operational map

Step 3: Identifying special activities for the hard-to-reach and problem areas

Step 4: Preparing a health facility session plan

Step 5: Using the RED strategy for problem solving

Step 6: Making a workplan for one quarter

Step 7: Using a monitoring chart

Step 8: Working with the community and tracking defaulters

Step 9: Managing supplies

Step 10: Making use of the monthly report

                                              5
Microplanning for Immunization Service Delivery Using the Reaching Every District (RED) Strategy
Step 1: Quantitative analysis of local immunization data
KEY POINT: Use your own local data and prioritize the unimmunized.
The first step for all health facilities is to analyse your own data. Table 1 should be completed as
described below. Follow the instructions for each column. You will need a calculator. Use Table 2 to
help you categorize problems of access and utilization. You should use a full calendar year of data or
data for a full 12-month period.
In this guide we have made certain assumptions which you can change according to the national
situation. For example we use Pentavalent vaccine (DTP-HepB+Hib), calculate drop-outs from
Penta1 to Penta3a and measles vaccine. We also use 80% coverage and 10% drop-out rates as cut-off
levels, which may be too high or too low. All of these assumptions can be changed if needed.
Table 1 is divided into 18 columns (a to r)
• Column a: Area name
− Write a list of names of all the villages and/or urban areas that you serve in your
catchment area.
• Column b: Target populationPart 1: Health facility microplanning
• Column g: Immunization coverage Penta1 (%)
− Divide the doses of Penta1 administered (c) by the target populationMicroplanning for Immunization Service Delivery Using the Reaching Every District (RED) Strategy
• Column m: Drop-out rates Penta1 to Penta3 (%)
− Subtract the doses of Penta3 (d) from the doses of Penta1 (c), divide by the doses of
penta1 (c) and multiply by 100.
m = c−d x 100
c
• Column n: Drop-out rates Penta1 to measles vaccine (%)
− Subtract the doses of measles vaccine (e) from the doses of Penta1 (c), divide by the
doses of Penta1 (c) and multiply by 100.
n = c−e x 100
c
• Column o: Identify problems of access
− Refer to Table 2 (analysis of problems of access and utilization). Write 'good' or 'poor'
according to whether Penta1 is at least 80%∗ or less than 80%.
• Column p: Identify problems of utilization
− Refer to Table 2 (analysis of problems of access and utilization). Write 'good' or 'poor'
according to whether the drop-out rate is 10% or less, or more than 10%.∗
• Column q: Category of problem
− Refer to Table 2 (analysis of problems of access and utilization). In this table problems
are categorized 1, 2, 3, 4 according to the level of problems of access and utilization.
Use the information in columns (o) and (p) to write the number 1, 2, 3 or 4 in column
(q).
• Column r: Prioritize the area.
− Refer to column (m) and (n) which show the unimmunized population for Penta3 or
measles vaccine. Now give a priority number to each area starting at priority number 1
for the highest number of unimmunized, and continue according to the number of
unimmunized infants for either of these vaccines. Each area should have an individual
priority number assigned; no two areas should have the same number.
∗
Remember you can vary the ‘80%’ and ‘10%’ cut off points according to the local situation.Part 1: Health facility microplanning
Table 1: Data analysis
Prioritize
Compile population, immunization coverage data in the previous 12 months Analyse problem
area
Target Categorize
Un-
Area population Doses of vaccine administered Immunization coverage (%) Drop out rates (%) Identify problems the
immunized
name figures problem
Penta1 Priority
Penta Penta TT2+/ Penta Penta TT2+/ Penta Penta1 Utilisa- CategoryMicroplanning for Immunization Service Delivery Using the Reaching Every District (RED) Strategy
Table 2: Analyse problems of access and utilization
What proportion of the children have ACCESS to immunization services?
(What is the DTP1 coverage?)
HIGH coverage with DTP1 (> 80%) LOW coverage with DTP1 (< 80%)
What proportion of children COMPLETE the immunization schedule?
(What are the drop-out rates?)
Drop-out
Drop-out rate Drop-out rate Drop-out rate
rate
> 10% < 10% > 10%
< 10%
Catorgorize the problems
• Drop-out rates are • Drop-out rates are • Drop-out rates are • Drop-out rates are
low = good utilization high = poor utilization low = good utilization high = poor utilization
• Coverage is high • Coverage is high • Coverage is low • Coverage is low
= good access = good access = poor access = poor access
• Category 1 • Problem • Problem • Problem
(no problem) Category 2 Category 3 Category 4Part 1: Health facility microplanning
Step 2: Preparing and reviewing an operational map
KEY POINT: Don't miss anyone! Make sure all groups of population are included on the map.
Making an operational map of your catchment area
Draw a map of the area served by your HF catchment area. The map can be simple and hand-drawn,
you do not need a computer to draw the map. You may be able to use a map already prepared for
polio eradication. The map will show you how the population is situated so that you can decide which
populations will be served by fixed sessions and which ones require outreach and/or other strategies
such as mobile teams from the district level.
1. Draw a simple map of the HF catchment area. It does not have to be to scale, but it should
contain all the important features of the area. Mark the following information on the map:
• each village/area and all other settlements of population;
• the total population and target population of each village/ward;
• the hard-to-reach areas;
• roads and geographical landmarks (rivers, streams, mountains);
• distance between each village and the health facility (if known);
• transport frequently used by the health facility to reach each village and the time taken (if known);
• location of the nomadic populations and their travel/movement plans (if applicable);
• identify the areas that have seasonal accessibility (if applicable).
Refer to Annex 4 for special planning for urban areas.
2. Using the HF catchment area map, decide the type of session suitable for each village/ward in
your HF area (fixed, outreach, mobile teams).
On the map, mark what kind of session will be used to reach each village or area using the letters F
(fixed), O (outreach), M (mobile teams). For outreach and mobile, use arrows to show how they will
be reached. If possible, for each outreach session identify where it will be held.
If you are not sure which kind of session to use, the following table may help.
Fixed session Delivery of services in a HF Serves the community within easy access to the
HF
Outreach Delivery of services in an Area around the HF that the staff can visit in
session 'outreach site' one day
Mobile teams Delivery of services beyond the Areas not possible to cover in one day, requires
'outreach area' overnight stay
11Microplanning for Immunization Service Delivery Using the Reaching Every District (RED) Strategy
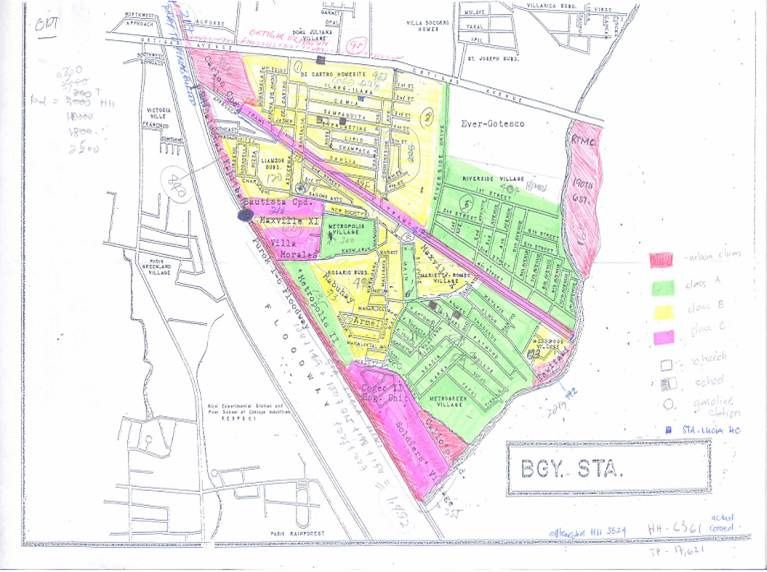
3. Review the operational map of the HF catchment area.
Figure 1 :Sample health facility mapPart 1: Health facility microplanning
Step 3: Identifying special activities for the hard-to-reach and problem
areas
KEY POINT: The hard-to-reach and problem areas can be either urban or rural populations.
Wherever they are, they will need special activities to reach them.
In Step 3 you will review the data in Table 1, and decide whether there are hard-to-reach areas and
other kinds of problem areas that need some special activities to reach them regularly. You will use
Table 3 to do this. Start by listing all the areas in Table 1 in descending order of the number of
unimmunized infants. To complete Table 3 you will need local knowledge of the areas concerned,
because you will have to decide what special activities are needed to reach them. To help the analysis,
areas can be classified as 'hard-to-reach' and 'problem areas'. However, the activities needed to reach
them may be the same. When you have identified these activities you will include them in the
workplan in Step 6.
Who are the hard-to-reach?
1. Rural hard-to-reach: These are the rural populations who have little regular contact
with routine immunization services. They may include:
i. people living in areas too far1 from the health service
ii. seasonally mobile populations (e.g. nomadic populations).
2. Urban hard-to-reach: These are urban populations living in areas not far from services
but who do not make contact with the services for a variety of reasons. This group
includes slum dwellers and squatter settlements. For more information on planning to
reach urban high-risk areas, see Annex 4.
3. Socio-economic hard-to-reach: These are the segments of society that include minority
groups who do not use government health services due to social, economic or political
reasons. For example:
i. Social reasons: Reluctance to access health services due to religious and
traditional beliefs.
ii. Economic reasons: Daily wage earners lose a day's pay whenever they
stand in queues at a health facility.
iii. Areas with conflict: Contact between health staff and the community can
be limited due to poor security.
1
The term ‘too far’ will depend not only on physical distance but also logistic and human resource capacity. For example,
people may live only a few kilometres away, but are separated by a river or mountain.
13Microplanning for Immunization Service Delivery Using the Reaching Every District (RED) Strategy
What are problem areas?
In this module we can say that any area that is listed as category 3 or 4 in Table 1, column "r"
can be considered as a problem area. However, there may be other problem areas that do not
fall into these categories. In Table 3 you will have a chance to decide whether these areas
also need special activities.
How to complete Table 3: Planning special activities for hard-to-reach and problem areas.
− Column (a): List all areas according to priority.
• Refer to Table 1 column (r). List the names of the areas in descending order of priority
beginning with the area that has the most unimmunized infants and is therefore priority
number 1.
− Column (b): Write the category of problem (1 to 4) for each area.
− Column (c): Write ‘yes’ if the area is hard to reach, or has some hard-to-reach populations
living in it.
− Column (d): Write how many times that area was reached in the last calendar year (or 12-
month period).
− Column (e): Decide what activities you can do from your health facility that will help to
improve access and utilization in the hard-to-reach and category 3 and 4 problem areas you
have listed (see Annex 3 of Part 1 for some suggestions).
− Column (f): Decide what activities to improve access and utilization in hard-to-reach and
problem areas will need support by the district or higher levels.
− Column (g): Decide what other interventions can be delivered at the same time as
immunization in hard-to-reach and problem areas.Part 1: Health facility microplanning
Table 3: Planning special activities for hard-to-reach and problem areas
List of areas Category of Hard to How many times Activities that can be conducted Activities that need What other interventions
(according to problem:1, 2, 3, 4 reach (Y/N) were they by the health facility level to support by district and/or can be delivered at the
priority) (refer to Table 1) reached last improve access and utilization higher levels same time as
year? immunization?
a b c d e f g
15Microplanning for Immunization Service Delivery Using the Reaching Every District (RED) Strategy
Step 4: Preparing a health facility session plan
KEY POINT: Every community on the map must be included in the session plan, showing what
type of session they need.
In this guide, we base the session plan on the workload that you can do realistically from the health
facility. The session plan will show the type of session, and how frequently the session will be done.
We use an estimate of the number of injections needed in a session as the basis for measuring the
workload. For example, you may be able to have a higher workload at a fixed site (80 injections) than
an outreach site (40 injections). We use the estimated workload because the estimated number of
infants and pregnant women attending any session is unpredictable. By making a session plan based
on realistic workload you will always know in advance how much vaccine, supplies, staff and
transport to have available for a session. In this way the session plan provides a firm basis for making
a workplan. You can always adjust the frequency and type of session and the quantity of supplies, as
needed.
1. Using Table 4, complete columns I, II, III, IV
Take Table 1, the map and Table 3. Using Table 4, list each area, its population and target population
(columns I, II, III). Against each village/ward, note down the type of session needed according to the
map you have made in Step 2 (column IV).
2. Calculate the workload (number of injections needed) per year (column V)
In this guide, we use number of injections as a measure of the workload during an immunization
session. Referring to the national immunization schedule, count how many injections are needed to
fully immunize an infant in your health facility catchment area. At a minimum, an infant will need
five injections (BCG x1, pentavalent1 x3, measles x1) (plus four doses of oral OPV). In addition, two
tetanus toxoid (TT or Td) doses are needed to immunize pregnant women. This makes a total of five
infant injections, plus two injections of TT or Td for pregnant women2, which makes up seven
injections in all for full immunization of an infant and pregnant woman. However, some countries
may use up to 10 injections (e.g. adding three doses of monodose hepatitis B). Note that this
calculation does not include booster doses for older children. Multiply the number of injections to
fully immunize one infant and pregnant woman by the infant population to calculate the workload per
year (column V).
3. Calculate the workload (number of injections needed) per month (column VI)
To calculate the monthly total workload, divide the yearly total workload (column V) by 12.
4. Calculate the estimated number of sessions needed per month3 at each fixed and outreach site
(column VII)
You now need to decide how many injections can reasonably be given by health staff (the reasonable
workload) during one fixed session and one outreach session. For this module, we assume that a fixed
1
If you are using DTP-HepB or DTP vaccine, the number of injections will still be the same (5) to fully immunize an infant.
2
In most countries pregnant women are targeted for routine TT immunization. While not every pregnant woman will require
two doses of TT, this module assumes that all planning will have to include two doses of TT for each pregnant woman.
3
Some areas may not need a session every month; however, a minimum four sessions per year should be ensured.
16Part 1: Health facility microplanning
session in a health facility can reasonably deliver approximately 80 injections per session, and an
outreach session approximately 40 injections per session. However, this number may vary depending
on your local conditions, i.e. the number and availability of staff, vaccines and other supplies,
distance between the health facility and the outreach post, and the need to provide other health
services at the same time.
To calculate the number of sessions needed per month:
Divide the number of injections needed per month by 80 for a fixed site.
Divide the number of injections needed per month by 40 for an outreach site.
5. Make a realistic judgement and write down the actual number of sessions per month at each
fixed and outreach site (column VIII)
This step involves making some realistic judgement based on the following: availability of
vaccination staff, availability of community volunteers, and distance from outreach.
The calculation you have made for Step 4 may give you an unrealistic number of sessions, for
example less than one session per month or three sessions per month. Now you must make realistic
judgement of the number of sessions per month at each fixed and outreach site, based on local
knowledge. Decide whether an area needs larger less frequent sessions or smaller more frequent
sessions.
6. Include other child survival interventions to be delivered with immunization (column IX)
List other child survival interventions that can be delivered with immunization (e.g. insecticide treated
bednets, deworming tablets, etc.). Refer to Table 3, column (g) and add these to column IX.
7. Identify if the area is hard to reach (column X)
Refer to Table 3 and note the hard-to-reach areas by placing a ‘Yes’ in column X. You may decide
that you can only visit four times per year. You should note this in column VIII.
KEY POINT: Make your session plan efficient!
• Use your judgment and knowledge of the area to plan the number of sessions needed based on:
− number of health workers and other staff available
− time taken to reach the outreach site
− availability of community volunteers at the session site.
17Microplanning for Immunization Service Delivery Using the Reaching Every District (RED) Strategy • avoid very small or very large sessions • decide an appropriate session frequency to make best use of resources. In deciding the session frequency, try to ensure the most efficient use of time, especially for outreach. Less frequent but better attended outreach sessions can improve the use of resources. The actual number of sessions planned for any area will depend on many factors. Use your local knowledge and judgement to make efficient use of your local resources.
Part 1: Health-facility microplanning

                                                                           Table 4: Session plan template

Name of health facility catchment area ________________________                                       Date____________
Area           Total           Target           Session type      Injections per      No. of injections Estimated sessions      Actual sessions       Other child            Hard-to-reach
name           population      population       (Fixed,           year                per month         per month               planned per month     survival               area/population
                                                Outreach,                                                                       (realistic judgement) interventions          (refer to Table 3)
                                                Mobile)           (target          (injections per          (divide by 80 for                         planned?
                                                                                a
                                                                  population x 7 ) year/12)                 Fixed and 40 for
                                                                                                            Outreach)

        I             II              III              IV                  V                     VI                  VII                 VIII                    IX                     X

a
    See Step 4, point 2 to understand the rationale for calculating the number of injections per year

                                                                                            19
Microplanning for Immunization Service Delivery Using the Reaching Every District (RED) Strategy
Step 5: Problem solving using the RED strategy
KEY POINT: Can you list the important problems concerning immunization services in
your area? Can you suggest solutions to these problems? The RED strategy will help you
to identify problems and solutions.
In Steps 1 and 3 you identified problems of access and utilization specific to certain areas. In
Step 5 you will have the opportunity to consider general or qualitative problems and solutions
that may affect the whole or part of your catchment area. The five operational components of the
RED strategy can be used to help structure the problems and solutions. Table 5 is organized
according to the five operational components of the RED strategy. Some examples of questions
are provided in the box below. Use the questions to help you think of real problems and solutions
for your area.
How to use Table 5:
− Write a full list of problems against each of the RED components..
− Write a list of activities that will solve the problems:
• Firstly, those activities that you can do yourself at the health facility (with limited
resources) such as re-arranging the session plan, working with community
volunteers etc.;
• Secondly, activities that need resources and assistance from the next level (district
or higher) for example:
conducting sessions that the HF cannot do;
providing supplies, equipment, access to vehicles needed for certain
sessions;
technical support and information on new aspects of the programme.
− If the activity is specific to a certain area covered by your health facility, name the area,
otherwise, indicate that the activity concerns the whole of your catchment area.
− As far as possible write the name of the person responsible for each problem-solving
activity and the date when the activity will be done.
When you provide a monthly report, refer to this list to report on activities that you have done,
and those that are still outstanding.
20Microplanning for Immunization Service Delivery Using the Reaching Every District (RED) Strategy
Here are some examples of questions to help think about your own problems and solutions
Re-establishment of outreach services
Does your workplan state the time and place of every outreach session that you plan?
Do you monitor outreach sessions planned and completed?
Do some communities receive less than four outreach sessions per year?
Supportive supervision
Do you receive regular supervisory visits, for example how many visits in the last six months?
Do the supervisors take time to provide some needed information and help solve problems?
Is there follow-up on findings from previous supervisory visits?
Community links with service delivery
Are the communities you serve involved in planning the place and time of sessions?
Are communities always informed in advance of sessions?
Are community volunteers available at immunization sessions?
Do you receive information on newborns from the community?
Are pregnant women aware of the need for TT/Td immunization and how to receive it?
Are there rumours and concerns about the safety of vaccines?
Monitoring and use of data for action
Do you have a defaulter tracking system in place?
Does the district hold quarterly meetings to review performance?
Are you able to provide complete and timely monthly reports?
Do you receive feedback on monthly reports?
Is there a big difference between official denominator and immunization denominator?
Planning and management of resources
Do you have a session plan and workplan?
Do you receive the resources needed to conduct outreach?
Are there vacant staff posts in your health facility?
Have you had recent stock-outs of vaccine, safe-injection equipment, fuel and other supplies?
21Part 1: Health facility microplanning
Table 5: Using the RED strategy for problem solving
RED component Problems Activities with limited Activities needing resources and When and Who
resources assistance from district area name (person)
Re-
establishment of
outreach
services
Supportive
supervision
Community
links with
service delivery
Monitoring and
use of data for
action
Planning and
management of
resources
22Microplanning for Immunization Service Delivery Using the Reaching Every District (RED) Strategy
Step 6: Making a workplan for one quarter
KEY POINT: Make a dynamic workplan! Show all the sessions and other activities, monitor
and adapt the plan regularly.
Table 6 shows a workplan for one quarter (three months). To complete the workplan you will
need:
Table 4: the session plan, to list all sessions according to location and date
Table 3, to list all hard-to-reach activities
Table 5, to list other activities that you will carry out at the health facility.
To complete the workplan you will:
• Put a timeframe to the session plan.
Try to schedule:
− fixed sessions on the same day(s) every week;
− outreach sessions on the same day or date every month to make it easier for the
community to remember.
• Identify sessions to be conducted by the district.
• Include other activities from Steps 3 and 5 at the bottom of the workplan.
Assign dates to:
− activities identified in the problem-solving exercise
− other regular activities like training, monitoring etc.
− ensure there is no conflict in dates.
1. List the names of all areas in the health facility catchment area in the same order as in
the session plan.
2. In the next column write the number of sessions and type of session per month, for
example 'village A: 4 outreach', as written in the session plan.
3. In each month column (January, February, March) write the following:
− the date each session is scheduled;
− the date the session was actually held;
− the type of transport needed if outreach or mobile session;
23Microplanning for Immunization Service Delivery Using the Reaching Every District (RED) Strategy
− the person responsible for doing the session;
− whether the district needs to provide support to do the session. For example, for hard-to-
reach areas (Refer to Table 3) is a district vehicle needed? Should district staff conduct the
session?
4. Under each month write extra activities and other regular activities.
− Add activities for hard-to-reach and problem areas (see Table 3).
− Add other activities that need to be carried out on a regular basis, such as monthly
meetings at the district level, special campaigns etc.
− Include periodic interventions to be delivered with immunization (e.g. bednet
distribution).
5. Monitor session implementation.
Under each month note the number of sessions held and the number of sessions planned. If it was
not possible to carry out a session as planned, state the reason why in the monthly report to the
district (Step 10).
Every quarter revise the activities according to the situation: progress and additional needs.
Keep the Health Facility Workplan on the wall of the health facility.Microplanning for Immunization Service Delivery Using the Reaching Every District (RED) Strategy
Table 6: Sample health facility workplan for one quarter (i.e. three months)
Area name No. of January February March
sessions
per
month
Date(s) scheduled Date(s) scheduled Date(s) scheduled
Date(s) held Date(s) held Date(s) held
Transport Transport Transport
Person responsible Person responsible Person responsible
District support (Y/N) District support (Y/N) District support (Y/N)
Date(s) scheduled Date(s) scheduled Date(s) scheduled
Date(s) held Date(s) held Date(s) held
Transport Transport Transport
Person responsible Person responsible Person responsible
District support (Y/N) District support (Y/N) District support (Y/N)
Date(s) scheduled Date(s) scheduled Date(s) scheduled
Date(s) held Date(s) held Date(s) held
Transport Transport Transport
Person responsible Person responsible Person responsible
District support (Y/N) District support (Y/N) District support (Y/N)
Activities for hard-to- Activities Activities Activities
reach & problem areas
Person responsible Person responsible Person responsible
Regular activities Activities Activities Activities
Person responsible Person responsible Person responsible
Monitoring of session Number of sessions held in Jan: Number of sessions held in Feb: Number of sessions held in Mar.
implementation
Number of sessions planned in Jan: Number of sessions planned in Feb: Number of sessions planned in Mar.
25Part 1: Health facility microplanning
Step 7: Using the monitoring charts
KEY POINT: The monitoring chart is the best tool for showing progress. It should always
be displayed on the wall of the health facility next to the workplan.
You can adapt the monitoring chart to show whatever vaccine doses you wish, for example
Penta1-Penta3, BCG-measles, etc.
Using the monitoring chart
The monitoring chart has been developed to track the monthly, and annual, progress towards
immunizing infants under one year of age. It also helps you to determine if the target
population is completing the series of vaccines (e.g. Penta3), or dropping out.
Calculate the annual and monthly target population to receive immunization services
• Annual target population. You should aim to reach every infant in your catchment area,
especially those who are hard to reach. Use existing population figures for infants under
one year of age obtained from official census data or your own community census.
• Monthly target. To get a monthly target population, divide the number of infants under
one year of age by 12. (If, for example, the annual target under one year is 156, the
monthly target will be 156/12 = 13.)
Label the chart
• Complete the information on the top of the chart, i.e. area and year. Label the left and
right side of the chart with the monthly target figures. Label the boxes at the bottom with
the name of the vaccine and dose, e.g. Penta1 and measles, or Penta1 and Penta3.
• Draw a diagonal line from zero to the top right-hand corner to show the ideal rate of
progress if every infant is immunized on time.
Plot immunization data on the chart
The chart can be used to monitor doses given and dropout rates.
a. Locate the row of boxes underneath the graph. Locate the spaces for the month you are
recording. Enter the monthly total of Penta1 immunization given.
b. Add the current month’s total to the previous cumulative total to calculate the current
cumulative total and enter it on the right side of the monthly column you are recording.
1
c. Make a dot on the graph for the cumulative total recorded on the right side of the
monthly column you are recording.
d. Connect the new dot to the previous month’s dot with a straight line.
e. Repeat the above steps (a to d) every month until the end of the year.
1
Cumulative means the total number of doses of vaccines given in the current month, plus the monthly totals for
all the previous months. Use the same time period for each dose and vaccine. For example, the cumulative
number of Penta1 doses given by the end of March is the total number of doses given in January plus the total
number given in February plus the total number given in March.
26Microplanning for Immunization Service Delivery Using the Reaching Every District (RED) Strategy
f. Plot Penta3 immunizations given in the same way as Penta1 (follow steps a to e).
Calculate the total number of drop-outs between Penta1 and Penta3 (DO#).
• Subtract the cumulative total for Penta3 from the cumulative total for Penta1.
• Calculate the cumulative drop-out rate (DO%) as follows:
DO% = Penta1 cumulative total minus Penta3 cumulative total x 100
Penta1 cumulative total
Use the information on the monitoring chart
Follow the line on the monitoring chart. If your performance goes below the line, try to
understand why and, if there is a problem, try to take corrective action. For example, it may be
possible to make an extra effort to regularly follow up and vaccinate defaulters, which will put
your programme back on track.
Here is an example of a monitoring chart in use:
27Part 1: Health facility microplanning 28
Microplanning for Immunization Service Delivery Using the Reaching Every District (RED) Strategy

Step 8: Working with the community and tracking defaulters
KEY POINT: Are you meeting the needs of the community? Working closely with the
community is one of the best ways to improve the service.

Access and utilization depend very much on the relationship with the local community. In
Step 5 you identified problems and solutions for making links with the local community. In
Step 8 you will visit the local communities regularly to ensure they are involved, to find out
how well they are able to use the services, and to follow up on defaulters who need to
complete the immunization series. Here is a brief list of actions to be made with the
community (for a full list see Immunization in Practice,1 module 8).

1.        Meet regularly with community leaders to:

      −     provide information on immunization and the time and place of sessions

      −     record new births or pregnant women needing antenatal care

      −     motivate parents to attend sessions

      −     request the support of volunteers during sessions

      −     request help in finding defaulters or unimmunized infants and pregnant women.

2.        Gather feedback from the community on the quality of the services

A simple questionnaire can be used to investigate reasons for low coverage and drop-outs (See
Part 1, Annex 1).

3.        Use a system to track defaulters

There are many ways to monitor and follow up on defaulters. Here are two tracking systems
that can easily be used.

Using the immunization register

At the end of each month, review immunization to identify infants who may have failed to
receive doses of vaccine when due. For example, if an infant received his/her Penta1 dose in
February, check to see whether he/she received Penta2 in March when the dose was due. The
register can also be used to track women who are TT/Td defaulters.

1
    Immunization in Practice: A practical guide for health staff. Geneva, World Health Organization, 2004.

                                                          29
Microplanning for Immunization Service Delivery Using the Reaching Every District (RED) Strategy “Reminder” cards Another way to identify defaulters is to make “reminder” cards, which are copies of each infant’s immunization card. File the copy of the immunization card in a box behind the divider for the month when the infant’s next vaccination is due. When an infant receives Penta1 in January, place the reminder card in the February section, i.e. the month when Penta2 is due. In February, if the infant attends when due for Penta2, update the reminder card and place it in the March section when Penta3 is due. Every month, review the reminder cards and follow up those who did not attend when due. Ensure that the TT/Td immunization status of pregnant women is included in the antenatal clinic tracking system. When TT immunizations are given to pregnant women outside of antenatal clinics, reminder cards can be Year: 2010 used to ensure that each pregnant woman gets their second dose (assuming it is the first pregnancy). Following up defaulters Whichever system you use, it will only be effective if you then make sure that every infant receives the vaccinations that are overdue. If you track defaulters regularly every month, it will make the task of follow-up easier. To follow up defaulters, you may be able to contact the mothers directly or ask members of the community to help you.
Part 1: Health facility microplanning

Step 9: Managing supplies
KEY POINT: After each receipt or issue, the balance in stock should be recalculated and
recorded.

The method for managing supplies can be very simple. Stock cards can be used, or just
an exercise book. You should include all vaccines and safe-injection equipment in the
stock record. Always check the status of the vaccine: VVM and expiry date.

The balance recorded should be physically checked and verified at periodic intervals.

Method 1: Using a simple exercise book for stock management each year.

•   Divide the book into separate sections of several pages for each type of vaccine (or other
    supplies/equipment) used.

•   Prepare tables for each vaccine and label the columns. Facing pages of the exercise book
    are used to record the details of each vaccine, AD syringes or diluents, or other
    supplies/equipment.

•   For each supply of vaccine received or issued, all details including batch number, date of
    expiry, vaccine vial monitor (VVM) status, quantity, etc., should be recorded. Quantities
    of other supplies should be recorded in the same way.

•   After each receipt or issue, the balance in stock should be calculated and recorded. The
    balance recorded should be physically checked and verified at periodic intervals (e.g. once
    every quarter).

              Simple exercise book to keep records of stock received and issued

                                              31
Microplanning for Immunization Service Delivery Using the Reaching Every District (RED) Strategy
Method 2: Using stock cards.
• Take a box (this should preferably be of a durable material like aluminium sheet or
plastic, but a shoebox can work) and divide it into separate sections that can take several
stock cards for each type of vaccine (or other supplies/equipment) used.
• Prepare a card for each vaccine and label the columns. A separate card is used to record
the details of each type of vaccine or AD syringes (including a different card for different
vial sizes), diluents or other supplies/equipment.
• Between each set of stock cards (for each type of vaccine or other equipment) insert a
separator that is slightly bigger than the stock cards. On each separator, indicate the
vaccine or other material corresponding to the stock cards placed immediately behind it.
For each supply received or issued, all details should be noted – including batch number,
date of expiry, VVM status, quantity, etc.
After each receipt or issue, the balance in stock should be recalculated and recorded. The
balance recorded should be physically checked and verified at periodic intervals (e.g. once
every quarter).Microplanning for Immunization Service Delivery Using the Reaching Every District (RED) Strategy
Sample form used for stock management
Vaccine or safe injection equipment Maximum stock
Minimum stock Quarterly supply
name (minimum + quarterly supply)
Number of vials/units Presentation
Received from (doses /vial or Total # doses Status of Total balance
Date or Issued to Received Issued units/box) or units Batch # Expiry date VVM (doses)/(units) Comments
33Microplanning for Immunization Service Delivery Using the Reaching Every District (RED) Strategy
Step 10: Making use of the monthly report
KEY POINT: The monthly report should be useful both for the sender of the report
(Health Facility) and the receiver of the report (District).
The HF should use the monthly report to remind the district about unsolved problems and
supervisory visits.
Missed sessions are a serious problem and deserve attention and corrective action by the HF
and district.
Every health facility is required to provide a report to the next level every month. In this step
we will suggest some ways of making the monthly report more effective by adding some
important pieces of information.
a) Complete the monthly report form including all coverage data, disease surveillance,
supply and stock levels, and other information that is requested routinely.
b) Supervisory visits: Include the date of the last supervisory visit.
c) Record session completeness. Refer to the session plan and note whether any
sessions (fixed or outreach) were cancelled. For each cancelled session state the
reasons why it was not carried out as planned and any new plan to repeat the session.
d) Problem solving:
i. Refer to your recent list of problems and solutions (Table 5)
1) List any problems that have been solved since the last report.
2) List any outstanding problems to be solved by either the health
facility or the district level.
34Microplanning for Immunization Service Delivery Using the Reaching Every District (RED) Strategy
35Part 1: Health facility microplanning
Annex 1: Simple questionnaire to
investigate reasons for low coverage
and dropouts
This questionnaire will assist you to gather feedback about the status of immunization services in
areas served on a health facility. It investigates the number of infants and their mothers (for TT/Td
immunization) who did not complete their immunization schedule, the number of people who are
never reached, why infants and women do not go or return for immunization, and how women think
services can be improved. You will not need extra resources nor much time to do this. It can be
carried out in a few hours. It is an opportunity to discuss these subjects directly with child
caretakers and find out how services could be improved and why they are not used.
The results of this survey are not representative of any population other than the households you
interview. This survey is intended to supplement, not replace, routine reporting.
The purpose is to investigate at least five infants under two years of age and their mothers of
childbearing age not vaccinated or who did not complete their immunization schedule.
Follow the steps below:
Use the tally sheet and the questionnaire presented on the following page for the interviews and to
compile data. If needed you can modify this questionnaire to fit your needs.
Collect and compile data.
a) Visit the households that can be reached from the health facility without difficulty until
you identify at least five infants under two years of age, and their mothers, who are not
vaccinated or who are overdue for the next vaccine dose (“partially immunized”). The
households do not have to be randomly selected and they may be interviewed in any order.
In each household having any infants under two years of age and their mothers, ask for the
infant’s and mother’s immunization card(s). If the infant or mother is not completely
immunized, each mother should be asked to give one reason why. Enter this information in
Item C of the tally sheet. Each woman should also be asked for her suggestions on how to
improve the health services: enter this in Item D.
b) Add up the number of households visited from Item A and the immunization status of
infants and mothers interviewed in the survey from Item B. Record the totals in the
appropriate space on the form.
Analyse the data.
c) Investigate why the infants and mothers were not, or were only partially, immunized.
d) Make a list of all the reasons given (Item C) and of suggestions for improvement (Item D).
e) Discuss possible solutions with your team given current resources as well as with extra
resources (see Steps 3 and 5).
36You can also read