The National K-12 Foreign Language Enrollment Survey Report
←
→
Page content transcription
If your browser does not render page correctly, please read the page content below
JUNE 2017

 The National K-12
 Foreign Language
 Enrollment Survey
 Report

 A comprehensive study of foreign/world language enrollments
 across the formal U.S. education system, K-12.

 This report is sponsored by The Language Flagship at the Defense Language and National Security Education Office
 (DLNSEO), conducted and published by American Councils for International Education in partnership with the American
 Council on the Teaching of Foreign Languages (ACTFL), the Center for Applied Linguistics (CAL), and the Modern
 Language Association (MLA), and in collaboration with the National Council of State Supervisors for Languages (NCSSFL).
AMERICAN COUNCILS
     RESEARCH CENTER

ARC

This report is sponsored by The Language Flagship at the Defense Language and National Security Education
Office (DLNSEO), conducted and published by American Councils for International Education in partnership with
the American Council on the Teaching of Foreign Languages (ACTFL), the Center for Applied Linguistics (CAL), and
the Modern Language Association (MLA), and in collaboration with the National Council of State Supervisors for
Languages (NCSSFL).

The Institute of International Education (IIE) administered the DLNSEO grant in cooperation with Bryn Mawr College.
The survey data and report do not necessarily reflect the position or policy of IIE or the Government; and no official
IIE or Government endorsement should be inferred.

©2017 by American Councils for International Education
All rights reserved.
This publication available online at www.americancouncils.org.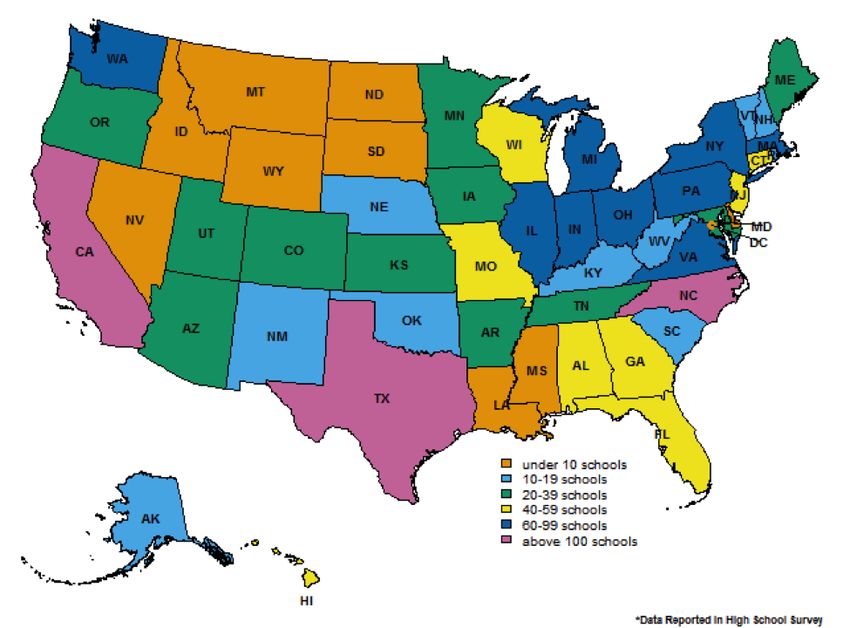
Table of Contents
   5   Description
   5   Background
   5   History
   6   Foreign Language Enrollment
   9   High School Foreign Language Programs by State
  11   Distribution of High School Programs by State
  11   Distribution of High School Programs
  16   Anticipated Change in High School Foreign Language Programs
  16   Distribution of Less Commonly Taught Languages (LCTLs) High School
       Programs by State
  28   Primary Language Education (K-8)
  34   Implications
  36   Appendix 1: Outreach Campaign
  39   Appendix 2: Methodology
  45   Challenges
  45   Limitations of the K-8 Survey
  46   Foreign Languages High School Questionnaire
  50   Foreign Languages State Questionnaire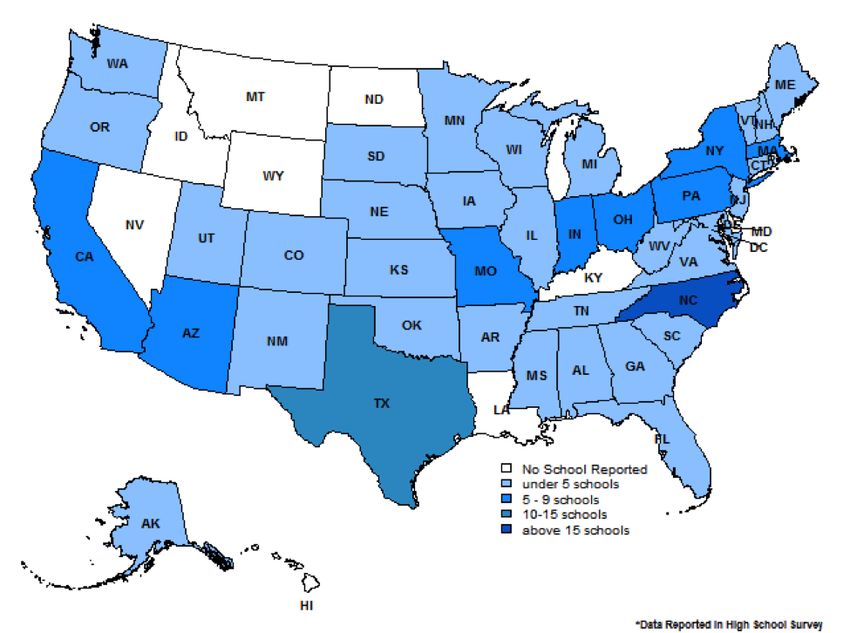
List of Tables
   7    Table 1. State Foreign Language Enrollment (2014-15)
   8    Table 2. Enrollment for Major Languages by State
   9    Table 3. Total Number of High School Language Programs Reported in State
   11   Table 4. Distribution of Foreign Language Programs
   12   Table 5. Type of Class
   13   Table 6. Type of Programs
   14   Table 7. Type of Collaboration With Other Institutions
   15   Table 8. Advanced Placement/International Baccalaureate Courses
   15   Table 9. Instruments Used to Assess Student Proficiency
   16   Table 10. Anticipated Change in Language Courses Offered
  28    Table 11. Schools Offering Language by State; Schools Offering K-8 Instruction
  29    Table 12. Languages Offered by Grade Level
  30    Table 13. Number of Students per Language K-8
   31   Table 14. Type of Instruction Offered by Language Programs Offered at K-8 Level
  32    Table 15. When Classes Are Offered by Language - Programs Offering Grades K-8
        Only
  33    Table 16. Collaborations by Language, Grades K-8
  33    Table 17. Projected Program Changes by Language
  33    Table 18. Assessments Used by Language, Grades K-8
  34    Table 19. IB Offered by Language, All Grade Levels
   41   Table A.1 Frequency of High Schools by State Based on High School Data File:
        Sample List Used for HS Census 2015
  44    Table A.2 Choice of Regression Model by Information Criteria
  44    Table A.3 Demographic Model of Foreign Language Enrollment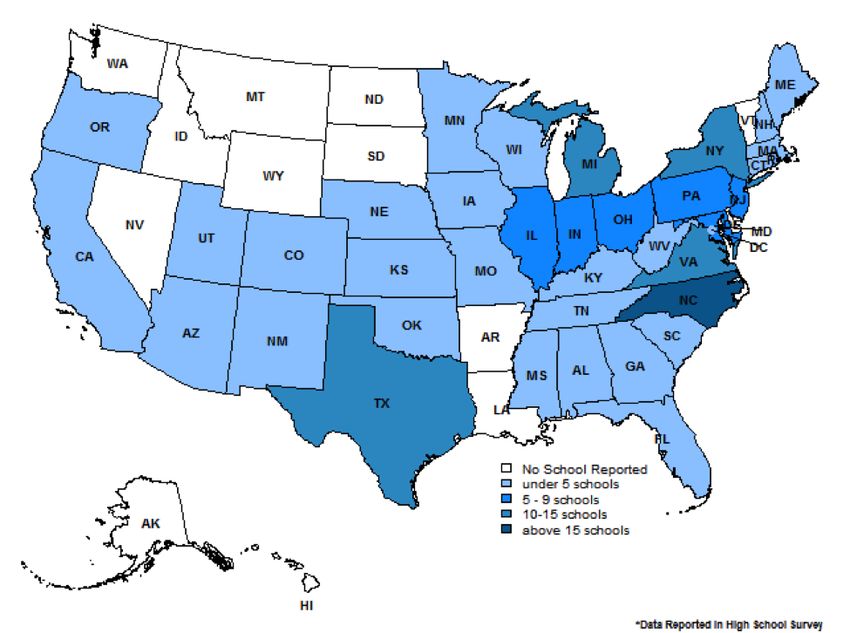
Description
The current study is the result of a partnership among the following organizations: American Councils for International
Education (AC); American Council on the Teaching of Foreign Languages (ACTFL); Center for Applied Linguistics (CAL);
Modern Language Association (MLA); and in collaboration with the National Councils for State Supervisors for Foreign
Languages (NCSSFL).

Each organization had a specific role to play: American Councils coordinated the effort, conducted an outreach effort to
the language education community as well as a census of all U.S. high schools, participated in state level data collection,
developed data dissemination tools, drafted the final report and maintains the Enrollment Survey website; engaged
its member networks and considerable PR systems to publicize the survey, consulted on questionnaire design, and
participated in state level data collection. ACTFL reached out directly to its membership, inviting all members to promote
the enrollment survey within their respective organizations and to submit relevant data on foreign/world language
education. In addition, ACTFL and American Councils have and continue to work collaboratively with NCSSFL to invite
and urge state supervisors to submit enrollment data for their states. The Board of National Council of State Supervisors
for Languages (NCSSFL) endorsed this data collection effort and encouraged its membership to contribute data as
available. CAL conducted the K-8 portion of the study; MLA made their data on language enrollments in higher education
available for incorporation into the study. Accordingly, this effort constitutes the first comprehensive study of foreign/
world language enrollments across the formal U.S. education system, K-16.

The study was commissioned by the NSEP through the Institute of International Education (IIE). One of its purposes was
to provide insight into strategic planning for the Flagship Language Program of the National Security Education Program.

Background
Education in foreign languages in the U.S., particularly at the K-12 level, continues to experience dynamic changes in
terms of numbers and locations of programs and program designs. A number of states are involved in major efforts
to support offerings of K-12 language education while locally, decisions are being taken to eliminate or consolidate
programs in specific languages.

Recent evidence points to a renewed interest in language immersion, particularly dual language immersion, as a way to
more effectively incorporate second language learning into the curriculum for native and non-native speakers of English.
It is therefore important to map and document such developments at the K-12 level on a timely basis in order to ensure
that stakeholders, managers, and policy makers at all levels of the educational system remain well informed about the
need for second language learning and are fully empowered to address issues that may arise.

History
The absence of comprehensive enrollment data on foreign language education in the U.S. seriously impedes systematic
assessment of U.S. national capacity in languages and the development of effective policies and essential planning
for the internationalization of U.S. education more generally. Periodic enrollment studies, particularly those undertaken
since the 1960s by the Modern Language Association (MLA), provide a representative view of language enrollments in
higher education. But the lack of consistent parallel efforts at the K-12 level seriously complicates the analysis of local or
national trends, particularly at a time of significant demographic shifts in the U.S. population and a resurgence of interest
in foreign language instruction in many school districts around the country.

Sponsored by the National Security Education Program/The Language Flagship in 2009, American Councils developed
the first National Survey of Less Commonly Taught Language Instruction in U.S. High Schools (grades 9-12). The survey
identified U.S. high schools offering instruction in Flagship-related languages and collected basic data on language
instruction in order to support ongoing efforts to strengthen critical foreign language education. During 2007-08,
ACTFL conducted a National Foreign Language Enrollment Survey of U.S. K–12 Public Schools to investigate the status
of foreign language enrollment. This was a three-year project, part of a U.S. Department of Education grant, to provide
more detailed and accurate information on K-12 foreign language enrollment and to investigate changes in foreign

                                                               The National K-16 Foreign Language Enrollment Survey Report       5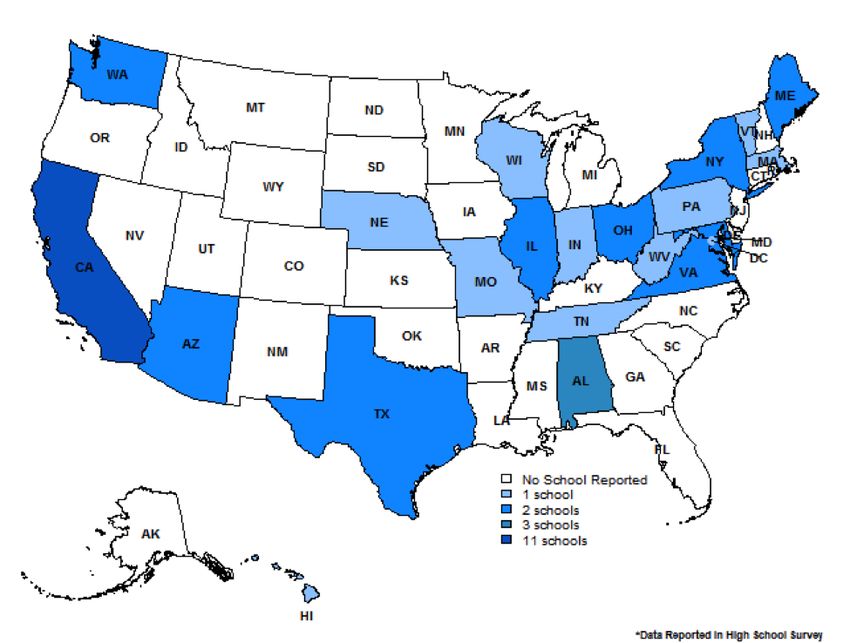
language enrollment since previous data collection efforts over the 2004-05 academic year. In 2008, with funding from
        the Department of Education’s International Research and Studies Program, CAL conducted a Nationwide Survey of
        Elementary and Secondary Schools to collect detailed information on foreign language education in the United States.
        The goal of the survey was to identify current patterns and shifts over time in five key areas: amount of foreign language
        instruction in schools, languages and types of programs offered, foreign language curriculum, teacher certification and
        professional development, and effects of education reform on language instruction.

        Foreign Language Enrollment1
        The current study is limited to an analysis of foreign/world language enrollments in the formal education system (K-16).
        Limits of time and resources have made it impossible to survey existing networks of heritage, community-based, after-
        school and weekend-and summer school programs, which provide significant amounts of training and cultural education
        for languages such as Arabic, Chinese (Mandarin and Cantonese), Korean, and Russian. Well-established summer
        intensive language programs and language camps, such as Concordia Summer Language Camp, National Security
        Language Initiative for Youth (NSLI-Y), STARTALK, and teacher-led school programs and exchanges have also not been
        included in the present study, although the aggregate numbers of U.S. school-level participants in the above studies is
        most certainly relevant to any assessment of overall U.S. language training activity.

        As reported by states, foreign language enrollments account for approximately 20% of the total school age population.
        A total of 11 states have foreign language graduation requirements; 16 states do not have foreign language graduation
        requirements; and 24 states have graduation requirements that may be fulfilled by a number of subjects—one of which is
        foreign languages.

        In addition to graduation requirements, other aspects of state level education policy—as well as a portion of English
        language learners and dual language immersion program enrollments—impact the overall number of language learners
        at the state level.

    1   These languages include: Arabic, ASL, Chinese, French, German, Latin, Russian, Spanish, Greek, Hindi, Korean, Persian, Portuguese, Swahili, Turkish,
        Azeri, Kazakh, Kyrgyz, Tajik, Afrikaans, Native American Language, Ancient Greek, Balto-Slavic, Celtic, Cherokee, Chickasaw, Choctaw, Classical Greek,
        Czech, East Asian Language, Filipino, Germanic Language, Haitian Creole, Hebrew, Indic Lang, Iranian/Persian Lang, Italian, Lakota Language, Hmong
        and Somali, Maskoke, Maskoke-Seminole, Ojibwe, Osage, Pawnee, Persian, Polish, Romance/Itali,Sauk, Southeast Asian Languages, Turkic/Ural-Altaic
        Language, Vietnamese and other unspecified languages.

6   The National K-16 Foreign Language Enrollment Survey Report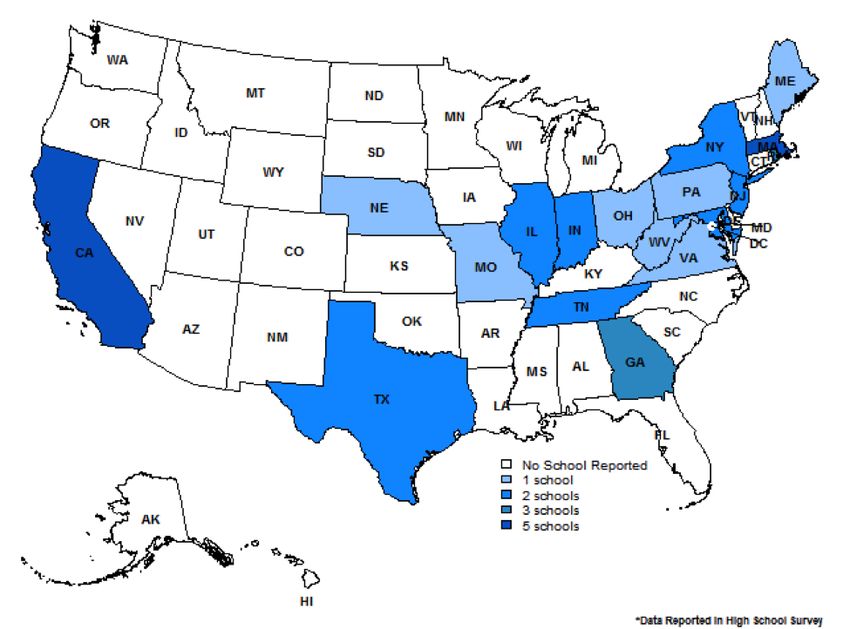
Table 1. State Foreign Language Enrollment (2014-15)**
Percent of K-12 Population Enrolled
State K-12 population K-12 Foreign Language Enrollment
in Foreign Language Classes
Alabama* 821,691 143,069 17.41%
Alaska* 134,315 22,187 16.52%
Arizona* 1,180,836 107,167 9.08%
Arkansas 507,060 46,095 9.09%
California 6,806,050 946,779 13.91%
Colorado* 896,918 110,995 12.38%
Connecticut* 614,313 173,580 28.26%
Delaware 149,108 48,218 32.34%
District of Columbia 72,937 34,408 47.17%
Florida 2,981,349 622,451 20.88%
Georgia 1,832,631 407,323 22.23%
Hawaii* 216,044 40,198 18.61%
Idaho* 308,290 37,584 12.19%
Illinois 2,258,315 294,686 13.05%
Indiana 1,165,262 228,059 19.57%
Iowa 524,775 79,944 15.23%
Kansas 520,583 79,477 15.27%
Kentucky* 741,776 83,098 11.20%
Louisiana 806,125 106,987 13.27%
Maine* 201,408 38,280 19.01%
Maryland 976,670 344,072 35.23%
Massachusetts 1,048,398 277,048 26.43%
Michigan* 1,708,384 384,442 22.50%
Minnesota 928,080 188,018 20.26%
Mississippi* 544,498 72,527 13.32%
Missouri 1,021,563 158,111 15.48%
Montana* 160,423 16,221 10.11%
Nebraska 331,732 58,832 17.73%
Nevada* 483,466 59,003 12.20%
New Hampshire* 210,631 57,855 27.47%
New Jersey 1,508,220 771,832 51.18%
New Mexico* 373,149 31,732 8.50%
New York 3,153,513 857,958 27.21%
North Carolina 1,668,877 328,918 19.71%
North Dakota* 108,163 23,668 21.88%
Ohio 1,973,655 357,474 18.11%
Oklahoma 675,116 82,096 12.16%
Oregon* 624,386 67,640 10.83%
Pennsylvania 2,014,442 401,693 19.94%
Rhode Island 160,466 36,023 22.45%
South Carolina 801,798 166,282 20.74%
South Dakota* 145,878 27,172 18.63%
Tennessee* 1,087,679 240,109 22.08%
Texas 5,080,783 960,911 18.91%
Utah* 622,449 131,118 21.06%
Vermont 94,632 33,153 35.03%
Virginia 1,358,037 272,041 20.03%
Washington* 1,144,380 168,316 14.71%
West Virginia 279,204 36,380 13.03%
Wisconsin 985,362 357,575 36.29%
Wyoming* 97,150 19,477 20.05%
Total 54,110,970 10,638,282 19.66%
*Foreign language enrollments are estimated.
**This table is based on data reported by states and an estimation model for missing state data. These data reflect overall enrollments only and not the summa-
tion derived from the language specific enrollments estimation model. The National K-16 Foreign Language Enrollment Survey Report 7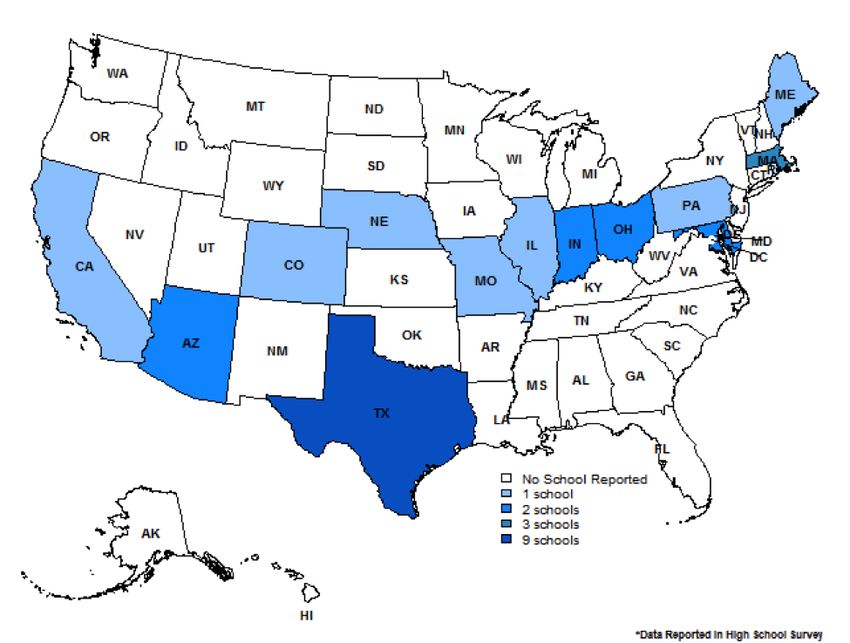
Table 2 below shows enrollments for major languages, based on data submitted by states, and the standard model to
develop estimates for missing data.
Table 2.
Enrollment for Major Languages by State**
State Arabic ASL Chinese French German Japanese Latin Russian Spanish
AL 230* 922* 2,600* 22,987* 5,333* 649* 3,653* 134* 115,197*
AK 2* 314* 373* 2,270* 89* 126* 6* 15* 14,767*
AZ 238* 961* 3,921* 15,810* 1,205* 1,407* 984* 69* 108,600*
AR 13* 523* 866 5137 1,943 7 286 5 37,693
CA 404* 16,079 21,157 108,194 9,638 12,054 5,220 546 712,213
CO 1,388* 448* 6,340* 19,889* 1,709* 1,705* 1,443* 103* 75,009*
CT 56* 1,058* 2,256* 23,710* 3,671* 314* 4,028* 187* 82,482*
DE 57 1,649 1,698 5,325 987 247 390 47* 36,368
DC 561 4* 1,888 4,204 16* 42* 891 1,612* 26,728
FL 84 14,793 7,029 61,356 4,887 663 10,267 223 510,097
GA 996 1081 7,419 62,424 12,699 993 13,334 116 307,999
HI 98* 990* 1,023* 4,117* 650* 507* 61* 10* 26,265*
ID 389* 453* 1,388* 6,409* 2,170* 1,392* 298* 14* 27,336*
IL 459 1,730 6,588 39,443 13,293 918 3,948 731 223,513
IN 92 2,185 3,422 25,911 14,687 2,521 6,249 168 136,757
IA 61 1,347* 568 7,072 3,973 531 212 44 67,351
KS 402* 1,988 1,600 9,075 2,427 227 1,182 43 62,919
KY 41* 828* 1,654* 11,684* 1,421* 271* 1,468* 210* 83,012*
LA 94* 867* 761 2,3013 453 149 1,687 8 80,916
ME 21* 170* 571* 5,513* 1,741* 136* 1,900* 50* 21,269*
MD 333 3,395 7770 40,078 4,833 932 5,240 363 174,701
MA 401 2,040 8261 45,175 3,367 377 20,548 286 117,839
MI 2,348* 3,421* 12643* 46,049* 30,024* 4,970* 10,882* 829* 264,068*
MN 1,693 4,999 6,770 19,877 11,091 880 3,115 212 136,314
MS 43* 151* 1,303* 13,610* 1,447* 235* 3,228* 101* 71,605*
MO 182* 857 1,144 24,382 8,430 259 2,686 80 107,238
MT 138* 77* 992* 3,192* 260* 413* 104* 28* 13,202*
NE 47* 751* 381 6,534 3,999 98 493 42 47,285
NV 5* 892* 629* 6,244* 890* 414* 137* 8* 45,926*
NH 33* 294* 744* 7,028* 2,832* 151* 1,665* 44* 24,207*
NJ 391* 3,688 9,491 61,269 10,771 826 11,823 711* 312,642
NM 290* 657* 1,861* 4,554* 227* 559* 266* 33* 43,342*
NY 1,015 7,387 25,751 99,754 7,299 4,328 22,213 3,488 624,742
NC 416 768 11,585 37,921 5,815 1,353 12,897 718 25,7180
ND 53* 534* 481* 2,497* 2,046* 145* 204* 21* 14,655*
OH 254 6,106 1,0971 52,173 18,478 901 9,294 745 236,532
OK 250* 1,032 1,563 7,147 2,207 89 1,885 199 66,190
OR 1,980* 586* 4,713* 13,173* 1,469* 2,195* 714* 78* 591,44*
PA 561 2,923* 3,569 63,202 38,165 2,086 13,880 438 242,998
RI 7* 33 35 5,399 76 76 384 45* 24,872
SC 385* 922* 1,991 21,825 4,406 634* 2,872 151* 135,188
SD 157* 516* 681* 3,202* 3,289* 220* 613* 24* 18,577*
TN 1,192* 2,452* 6,216* 28,611* 11,369* 2,340* 6,073* 386* 170,930*
TX 428 28,753 11,716 79,963 19,551 2,808 14,776 914 781,771
UT 5,223* 1,573* 6,046* 15,849* 10,515* 8,120* 1,179* 45* 69,660*
VT 76* 10 317 7,320 887 71 1,400 52 12,306
VA 505 2598 3,204 38,056 12,030 1,664 364 311 148,834
WA 1,899* 1,829* 7,337* 25,930* 3,888* 3,546* 958* 84* 116,385*
WV 25* 239 321 4,896 640 91 395 79* 29,798
WI 15 2,245 4,970 38,205 27,229 1,631 2,498 6 227,675
WY 14* 293* 508* 2,346* 376* 638* 13* 20* 10,828*
Total 26,045 130,411 227,086 1,289,004 330,898 67,909 21,0306 14,876 7,363,125
*Foreign language enrollments are estimated.
**The language specific enrollments estimation model was developed for the nine languages listed in this table only and not derived from overall enrollment
reports/estimates.
8 The National K-16 Foreign Language Enrollment Survey Report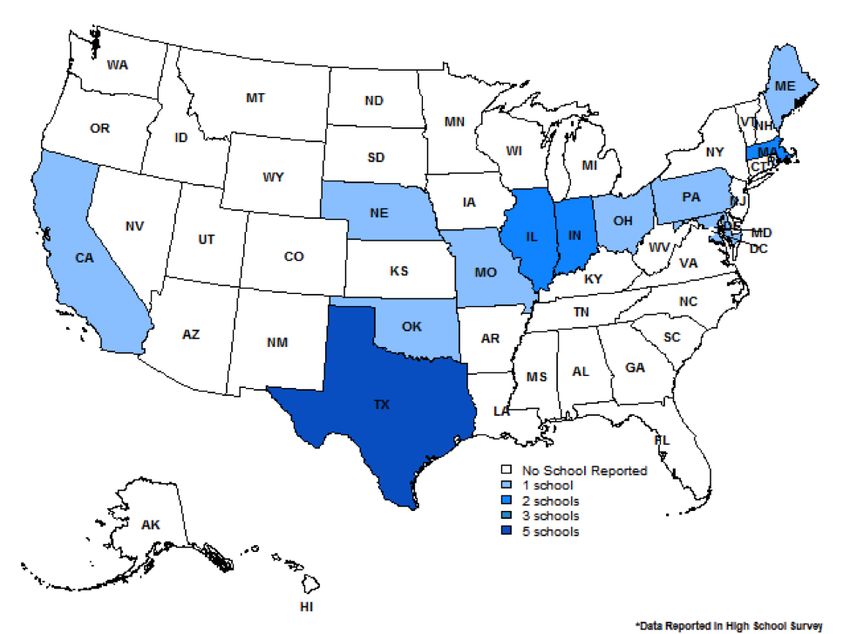
High School Foreign Language Programs by State
Table 3. below shows the number of high schools that offered foreign languages in each state and the District of Columbia. Spanish is by
far the most widely taught language in all 50 states and Washington, D.C.

                                                                     Table 3.
                      Total Number of High School Language Programs Reported in State (as reported in public and private schools)
State    #      ARB    ASL      AZE      CHI      FRA      DEU      GRK       HIN      JPN      KOR       LAT      PRS      POR     RUS   SPA   TUR
 AL     458      2      6        0        40       88       67        2        0        4         3       73        0        0       1    172    0
 AK      79      0      5        0        7        16        8        1        0         1        0        2        0        0       3    36     0
 AZ     261      2      14       0        15       51       25        4        0        7         2       23        0        0       5    111    2
 AR     306      0      5        0        18       63       37        2        0         1        0        9        0        0       1    170    0
 CA     1,120    4     62        4       108      254       46        9        1        49        11      68        1        5       5    492    1
CO      272      2      11       0        14       56       25        1        0        7         0       15        0        0       3    137    1
 CT     267      3      6        1        36       70       12        4        0         1        0       46        0        0       2    86     0
 DE      45      0      1        0        3        10        2        2        0        0         0        3        0        0       0    24     0
 DC      39      2      1        0        5        9         0        1        0        0         1        7        0        0       1    12     0
 FL     479      2     26        0        39      109       19        6        0        5         0       50        0        0       2    221    0
 GA     479      3      7        2        19      106       36        2        0        12        0       61        0        3       3    225    0
 HI      98      0      3        0        9        9         2        0        0        31        1        3        0        0       0    40     0
 ID     153      0      4        0        6        34       24        1        0        3         0        2        0        0       0    79     0
 IL     708      5      5        2        64       147      88        3        2        13        2       46        0        2       3    325    1
 IN     428      5      9        1        27       84       62        3        2        17        1       30        1        2       8    174    2
 IA     280      4      3        0        9        41       27        0        0        7         0        2        0        0       2    185    0
 KS     323      4      6        0        11       53       28        3        0        7         0       15        0        0       2    194    0
 KY     292      1      9        0        12       50       26        5        0        6         0       21        0        0       0    162    0
 LA     286      0      4        0        5        87        7        2        0        2         0       28        0        0       0    151    0
 ME     185      3      4        0        13       53       10        2        1        2         2       22        1         1      4    66     1
MD      256      7      9        0        16       60       21        4        1        2         2       33        1        2       3    93     2
MA      437      4      8        1        53       107      20        8        2        3         1       77        1        5       7    137    3
 MI     660     11     54        2        36       127      74        2        0        34        0       29        0        0       4    287    0
MN      364      4     28        1        22       57       57        3        0        7         0        17       0        0       1    167    0
 MS     175      1      0        0        7        34        7        1        0        0         0        14       0        0       1    110    0
MO      471      4      5        0        20      106       45        5        1        5         1       26        1         1      5    245    1
 MT     124      0      1        0        4        27       10        0        0        0         0       10        0        0       0    72     0
 NE     233      1      0        0        5        28       23        1        1         1        1        9        1         1      2    158    1
 NV      66      0      1        0        3        16        5        0        0        4         0        4        0        0       0    33     0
NH      148      1      3        0        8        44       17        1        0        3         0       20        0        0       2    49     0
 NJ     381      5      3        2        39       107      28        3        0        7         0       50        0        2       1    134    0
NM       121     4      4        0        8        23        11       0        0        5         0        8        0        0       1    57     0
 NY     859     10     42        1        45      223       35        9        0        17        2        71       1        2       8    393    0
 NC     590     16      12       0        58      105       53        5        0        32        0       73        0        0      20    216    0
 ND     132      0      3        0        2        20       34        0        0        0         0        9        0        0       0    64     0
OH      818      5     30        0        55      190       64        8        1        9         2       68        1         1      5    377    2
 OK     272      1      7        0        15       30       16        2        1        0         0       21        0        0       1    178    0
 OR     279      3      10       0        12       52       24        4        0        18        0        4        0        0       2    150    0
 PA     810      9      9        0        57      205       107       8        1        13        1       78        0         1      9    311    1
 RI      63      3      0        0         1       18        2        0        0        3         0        8        0        3       0    25     0
 SC     255      1      5        0        15       71       18        0        0        0         0       22        0        0       1    122    0
 SD      86      0      3        0        0         7        8        0        0        0         0        1        0        0       1    66     0
 TN     373      1      3        0        22       73       33        1        0        4         1       52        0        2       3    178    0
 TX     1,259   10     80        7        56       197      80        3        5        21        2       118       1        2      12    656    9

                                                                           The National K-16 Foreign Language Enrollment Survey Report               9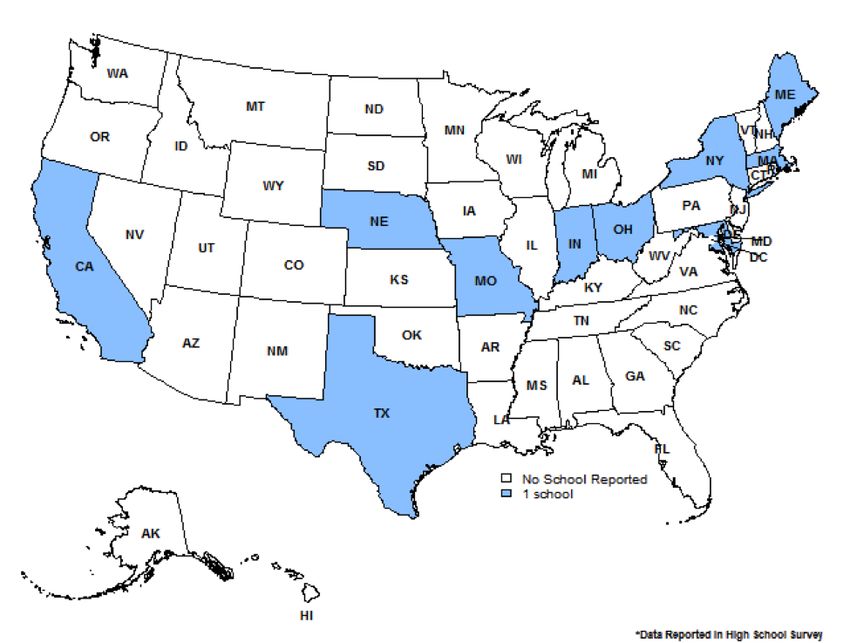
Table 3. (continued)
                                              Total Number of High School Language Programs Reported in State (as reported)
  State      #       ARB       ASL      AZE        CHI      FRA      DEU      GRK      HIN       JPN      KOR       LAT       PRS     POR      RUS       SPA      TUR

   UT       159       2        18        0         21       35       15        0        0         7        0        4         0        0         1       56        0
   VT       121       0         4        0          9       35        13       1        0         1        1        20        0        0         1       36        0
   VA       530       12       21        2         30       124      43        5        0        14        2        99        0        1         4       173       0
  WA        492       0        43        3         24       104      43        1        0        32        2        10        0        0         3       227       0
  WV        140        1        5        0          5       33        8        1        0        6         1        7         0        1         1        71       0
   WI       499       3        16        2         34       84       80        0        0        10        1        25        0        0         3       241       0
  WY         47       0         3        0          2        6        3        0        0        0         0        0         0        0        0        33        0
           17,778     161      621       31       1,144    3,738    1,548     129       19      433       43       1,513      10       37       147     8,177      27

ARB = Arabic, ASL = American Sign Language, AZE = Azeri, CHI = Chinese, FRA = French, DEU = German, GRK = Greek, HIN = Hindi, JPN = Japanese, KOR = Korean, LAT = Latin,
PRS = Persian, POR = Portuguese, RUS = Russian, SPA = Spanish, TUR = Turkish

10        The National K-16 Foreign Language Enrollment Survey Report
Distribution of High School Programs by Language
Table 4. below shows the distribution of languages offered by high schools in each state and the District of Columbia as
reported in the high school survey.
Table 4.
Distribution of Foreign Language Programs
(as reported)
Language Number of HS programs per language Percent of HS programs per language
Arabic 161 0.91
ASL 621 3.49
Azeri 31 0.17
Chinese 1144 6.43
French 3738 21.03
German 1548 8.71
Greek 129 0.73
Hindi 19 0.11
Japanese 433 2.44
Korean 43 0.24
Latin 1513 8.51
Persian 10 0.06
Portuguese 37 0.21
Russian 147 0.83
Spanish 8177 46.00
Turkish 27 0.15
Distribution of High School Programs
The vast majority of reporting schools offered year-round Less Commonly Taught Languages (LCTLs) courses across
a range of languages. Most of the secondary school language programs reported having an established language
curricula offered during the course of the school year.
Among the LCTLs, academic year course offerings decline for languages with lower enrollments such as Hindi and
Turkish (47% and 63% respectively), while the reliance on after school and Saturday classes rises to up to 10% of classes.
Year-long programs are also lower for Portuguese (59%) compared to other romance languages. Lower and fluctuation
enrollments in these languages inform the capabilities of schools to open and maintain classes that would meet the
minimum number of students for their respective institutions. In such cases, schools tend to adopt methods other than
academic year formats such as online formats or as an extracurricular activity.
The National K-16 Foreign Language Enrollment Survey Report 11Table 5. *
Type of Class
(Percent of High Schools Reporting)
Language # of high Academic year % Summer % After-school % Saturday %
schools courses courses classes classes
reporting
Arabic 161 138 85.71% 16 9.94% 13 8.07% 2 1.24%
ASL 621 544 87.60% 32 5.15% 28 4.51% 2 0.32%
Chinese 1144 983 85.93% 55 4.81% 38 3.32% 12 1.05%
French 3738 3343 89.43% 161 4.31% 67 1.79% 22 0.59%
German 1548 1280 82.69% 60 3.88% 29 1.87% 11 0.71%
Greek 129 104 80.62% 9 6.98% 7 5.43% 2 1.55%
Hindi 19 9 47.37% 2 10.53% 1 5.26% 1 5.26%
Japanese 433 328 75.75% 19 4.39% 16 3.70% 4 0.92%
Korean 43 31 72.09% 5 11.63% 0 0.00% 1 2.33%
Latin 1513 1261 83.34% 70 4.63% 27 1.78% 10 0.66%
Persian 10 7 70.00% 2 20.00% 0 0.00% 1 10.00%
Portuguese 37 22 59.46% 3 8.11% 3 8.11% 1 2.70%
Russian 147 100 68.03% 8 5.44% 7 4.76% 1 0.68%
Spanish 8177 7357 89.97% 584 7.14% 188 2.30% 41 0.50%
Tajik 2 1 50.00% 0 0.00% 0 0.00% 0 0.00%
Turkish 27 17 62.96% 3 11.11% 1 3.70% 0 0.00%
Urdu 3 1 33.33% 1 33.33% 0 0.00% 0 0.00%
Other 589 454 77.08% 47 8.14% 44 7.47% 12 2.03%
*Some high schools may offer more than one type of class, thus the total percentage will not add to 100%.
**Other include: Irish, Hawaiian, Italian, Polish, Apache, Choctaw, Vietnamese, Hebrew, Yiddish, Inupiaq, Paiute, Pilipino, Ojibwe, Cherokee, Dakota Language, Hmong, Soma-
li, Salish, Coast Salish, Northern Cheyenne, Tolowa, Yurok, Armenian, Native American, Keltic, Ancient Greek, Luiseno, Hidatsa, Tewa, Navajo, Keres, Navaho, Yupik Eskimo,
Nunivak Cup’ig, Ho-Chunk, Arikara, Finish, Comanche Indian, Dutch, Tlingit, Ancient Hebrew, Old Aramaic, Dine, Athabaskan, Seneca, Gwich’in, Gaelic, Romanian, Koine Greek,
Meskwaki, Zuni, Meskwaki, Punjabi, Tagalog, Bengali, Crow, Seminole, Passamaquoddy, Norwegian, Grosventre, Michif, Kickapoo, Braille, Lushootseed, Acoma Pueblo
Schools are increasingly adopting and using technology in their language classes. These applications included the use
of web-based programs as well as the use of computer-assisted instructional materials. Schools with limited resources
and limited staff reported use of alternate formats for providing LCTL instruction to their students. Traditional classes
often include the use of technology.
*Some high schools may offer more than one type of program and others did not provide any data, thus the total percentage will not add to 100%.
12 The National K-16 Foreign Language Enrollment Survey ReportTable 6.
Type of Programs
(Percent of High Schools Reporting)
Language # of high Traditional % Dual % Immersion % Online % Both online %
schools classroom language and Face-
reporting (two-way) to-face
immersion
Arabic 161 76 47.20% 5 3.11% 7 4.35% 62 38.51% 8 4.97%
ASL 621 459 73.91% 36 5.80% 44 7.09% 105 16.91% 60 9.66%
Chinese 1144 764 66.78% 53 4.63% 59 5.16% 252 22.03% 70 6.12%
French 3738 2950 78.92% 124 3.32% 190 5.08% 780 20.87% 327 8.75%
German 1548 968 62.53% 55 3.55% 67 4.33% 385 24.87% 93 6.00%
Greek 129 88 68.22% 3 2.32% 13 10.08% 13 10.08% 2 1.55%
Hindi 19 2 10.53% 2 10.53% 1 5.26% 7 36.84% 1 5.26%
Japanese 433 239 55.20% 11 2.54% 18 4.16% 105 24.25% 8 1.85%
Korean 43 17 39.53% 1 2.33% 2 4.65% 11 25.58% 1 2.33%
Latin 1513 1085 71.71% 25 1.65% 30 1.98% 266 17.58% 58 3.83%
Persian 10 1 10.00% 0 0.00% 1 10.00% 6 60.00% 0 0.00%
Portuguese 37 17 45.95% 1 2.70% 1 2.70% 11 29.73% 0 0.00%
Russian 147 64 43.54% 3 2.04% 6 4.08% 37 25.17% 2 1.36%
Spanish 8177 6831 83.54% 485 5.93% 484 5.92% 1833 22.42% 1142 13.97%
Swahili 4 0 0.00% 0 0.00% 0 0.00% 1 25.00% 0 0.00%
Tajik 2 1 50.00% 0 0.00% 0 0.00% 0 0.00% 0 0.00%
Turkish 27 12 44.44% 2 7.41% 2 7.41% 6 22.22% 0 0.00%
Urdu 3 0 0.00% 0 0.00% 0 0.00% 1 33.33% 0 0.00%
Other 589 381 64.69% 49 8.32% 57 9.68% 127 21.56% 49 8.32%
The National K-16 Foreign Language Enrollment Survey Report 13A growing trend is the increased reliance on courses and facilities of neighboring institutions, such as other high schools,
community colleges, or university campuses. For example, at schools where French or Chinese is not offered, provisions
are made to permit qualified students to take their preferred language off-campus at a nearby community college or
university for credit, or to undertake an online course. Some schools report offering courses through the use of online
resources.
A number of factors inform the decision to provide language instruction through collaboration with other educational
institutions; primarily limited resources, limited and often fluctuating demand, lack of teachers, and limited classrooms.
By adopting such collaborative agreements, schools can offer students instruction in any number of languages (without
having a minimum number of students to warrant a class or hiring the requisite teaching staff). Data from the commonly
taught languages (French, German, and Spanish) suggest that the collaborative mode is not restricted to low enrollment
languages but is a general strategy presumably to control costs and access resources.
Table 7.*
Type of Collaboration With Other Institutions
(Percent of High Schools Reporting)
Language # of high Another local % Community % University % Heritage com- %
schools high school college campus munity school
reporting
Arabic 161 9 5.59% 5 3.11% 13 8.07% 0 0.00%
ASL 621 71 11.43% 84 13.53% 28 4.51% 2 0.32%
Chinese 1144 112 9.78% 25 2.19% 69 6.03% 8 0.70%
French 3738 195 5.22% 185 4.95% 216 5.78% 1 0.03%
German 1548 130 8.40% 61 3.94% 96 6.20% 5 0.32%
Greek 129 1 0.78% 0 0.00% 3 2.33% 0 0.00%
Hindi 19 1 5.26% 0 0.00% 0 0.00% 2 10.53%
Japanese 433 40 9.24% 9 2.08% 19 4.39% 3 0.69%
Korean 43 1 2.33% 0 0.00% 0 0.00% 2 4.65%
Latin 1513 57 3.77% 16 1.06% 49 3.24% 0 0.00%
Portuguese 37 1 2.70% 0 0.00% 3 8.11% 0 0.00%
Russian 147 5 3.40% 1 0.68% 9 6.12% 0 0.00%
Spanish 8177 468 5.72% 698 8.54% 535 6.54% 22 0.27%
Other 589 31 5.26% 38 6.45% 47 7.98% 5 0.85%
Apart from Latin, most high schools offer Spanish and French AP courses. Among the LCTLs, Chinese AP® courses are
the most offered (23%), reflecting the growth of Chinese language learning across high schools in the U.S. Japanese
AP® courses rank second among LCTLs (21%), while the remaining LCTLs range from 2% to 10%: Arabic stands at
approximately 2.5%, Russian at 6% and Hindi at 10%.
14 The National K-16 Foreign Language Enrollment Survey ReportTable 8.*
Advanced Placement/International Baccalaureate Courses
(Percent of High Schools Reporting)
Language # of high schools reporting Advanced Placement % International Baccalau- %
reate
Arabic 161 4 2.48% 6 3.73%
ASL 621 14 2.25% 3 0.48%
Chinese 1144 260 22.72% 59 5.16%
French 3738 1140 30.50% 198 5.30%
German 1548 331 21.38% 66 4.26%
Greek 129 4 3.10% 0 0.00%
Hindi 19 2 10.53% 2 10.53%
Japanese 433 86 19.86% 24 5.54%
Korean 43 2 4.65% 2 4.65%
Latin 1513 511 33.77% 49 3.24%
Portuguese 37 1 2.70% 1 2.70%
Russian 147 9 6.12% 4 2.72%
Spanish 8177 2165 26.48% 246 3.01%
Turkish 27 1 3.70% 0 0.00%
Other 589 94 15.96% 10 1.70%
The growing interest in gaining Chinese proficiency is reflected in the number of schools that conduct assessment
of students’ proficiency (17% of reported Chinese offering schools); higher than Spanish (15%), which has the highest
enrollments of all foreign languages taught in the U.S.
Apart from Latin and among languages with higher enrollments, only French proficiency tests are conducted in more
schools than Chinese.
Table 9.
Instruments Used to Assess Student Proficiency
(Percent of High Schools Reporting)
Language # of high schools reporting Assess Student Proficiency % Name of Instruments Used to
Assess Student Proficiency
Arabic 161 16 9.94% IB, NEWL
ASL 621 35 5.64% ASLPI, ASLTA, IPA, STAMP, WIDA
Chinese 1144 197 17.22% AP, AAPPL, ACTFL, HSK, IB,
STAMP, YCT, NEWL
French 3738 739 19.77% AP, AAPPL, ACTFL, AATF, IB,
National French Exam (La Grand-
Concours)
German 1548 256 16.54% AAPPL, AATG, AP, ACTFL, Na-
tional German Exam, IB
Greek 129 28 21.71% National Greek Exam
Hindi 19 1 5.26% AP/IB tests
Japanese 433 49 11.32% ACTFL, AP, National Japanese
Exam, IB
Latin 1513 516 34.10% ACL, ACTFL, ALIRA, AP, National
Latin Exam, IB
Portuguese 37 5 13.51% AATSP, ACTFL, National Por-
tuguese Exam, Rosetta Stone
(online), NEWL
Russian 147 14 9.25% AP Prototype, Seal of Biliteracy,
National Russian Exam, Rosetta
Stone (online), Russian Olympi-
ad, NEWL
Spanish 8178 1184 14.48% AP, AAPPL, AATSP, ACTFL,
WIDA, IB, CLEP, National Spanish
Exam, STAMP
The National K-16 Foreign Language Enrollment Survey Report 15Anticipated Change in High School Foreign Language Programs
Table 10.
Anticipated Change in Language Courses Offered
(Percent of High Schools Reporting)
Language # of high schools re- Add Discontinue Number Change % Change
porting
Arabic 161 26 12 14 8.70%
ASL 621 63 30 33 5.31%
Chinese 1144 100 61 39 3.41%
French 3738 115 162 -47 -1.26%
German 1548 76 81 -5 -0.32%
Greek 129 15 11 4 3.10%
Hindi 19 5 3 2 10.53%
Japanese 433 34 37 -3 -0.69%
Korean 43 9 4 5 11.63%
Latin 1513 50 60 -10 -0.66%
Persian 10 3 2 1 10.00%
Portuguese 37 13 3 10 27.03%
Russian 147 18 14 4 2.72%
Spanish 8177 65 70 -5 -0.06%
Swahili 4 2 2 0 0.00%
Tajik 2 2 2 0 0.00%
Turkish 27 3 3 0 0.00%
Turkmen 1 2 1 1 100.00%
Urdu 3 1 1 0 0.00%
Yoruba 2 1 0 1 50.00%
Other 589 70 19 51 8.66%
Distribution of LCTL High School Programs by State
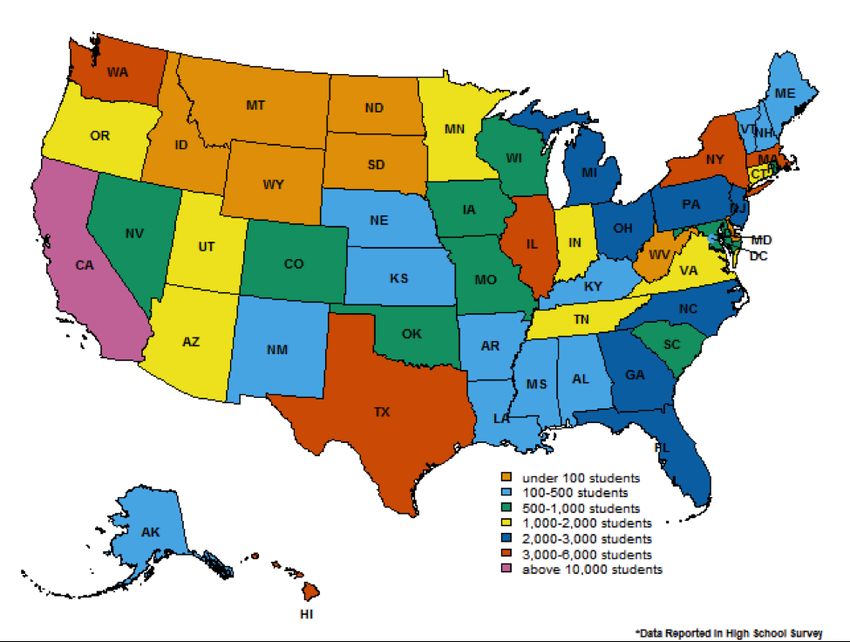
Through the high school census, of the 10,879 high schools in the U.S. secondary school system that responded, 2,064
offer LCTLs programs around the country, employing 1,460 full- and part-time teachers with reported enrollment of about
76,410 students2. The majority of these schools (79.28%) taught these languages through academic courses. Most states
had fewer than 100 LCTL programs. Only three states had over 100 high school LCTL programs: California, Texas, and
North Carolina (see Figure 1. Distribution of High School LCTL Programs by State).
2 These languages include Arabic, Azeri, Chinese, Hindi, Japanese, Korean, Persian, Portuguese, Russian, Swahili, Tajik, Turkish, Turkish, Turkmen, Urdu, and Yoruba.
16 The National K-16 Foreign Language Enrollment Survey ReportFigure 1. Distribution of High School LCTL Programs by State
Students of LCTLs were concentrated on the West Coast, where California is reported to have the most at over 10,000
students. States with 3,000-6,000 students of LCTLs are Washington State, New York, Illinois, Texas, and Massachusetts
(see Figure 2. Distribution of High School LCTL Students by State).
The National K-16 Foreign Language Enrollment Survey Report 17Figure 2. Distribution of High School LCTL Students by State
The explosion of Chinese enrollment and in the number of high school LCTL programs offering Chinese is a dominant
feature in the landscape of LCTL education in the U.S. Enrollment in Chinese classes has grown to the largest proportion
of all students enrolled in Flagship languages (Arabic, Chinese, Hindi/Urdu, Korean, Persian, Portuguese, Russian, Swahili,
and Turkish), accounting for 80% of total number of high school students enrolled in these languages in the U.S.
Up to 72% of high schools reported offering courses or online instruction in Chinese. Arabic and Russian are the second
and third most offered Flagship languages by high schools (10% and 9%) and also have the second largest enrollments
(6% each).
18 The National K-16 Foreign Language Enrollment Survey ReportFigure 3. Distribution of High School LCTL Programs by Languages
Figure 4. Distribution of Enrollment in High School LCTL Programs by Languages
The National K-16 Foreign Language Enrollment Survey Report 19Arabic:
As many as 3,740 students were reported to be enrolled in Arabic classes in 161 high schools in 38 states with up to 108
full- and part-time teachers of Arabic. Only five states were identified as having more than ten schools offering Arabic
classes. The highest concentration of U.S. schools offering Arabic classes are in North Carolina (16 schools), followed by
Virginia, New York, Minnesota, and Texas. The majority of schools reported that they offered Arabic through academic
classes (85%).
Figure 5. Distribution of Schools Offering Arabic by State
20 The National K-16 Foreign Language Enrollment Survey ReportChinese:
The results of the survey indicate that Chinese language instruction is widespread within school systems in 50 states,
(except for South Dakota) and the District of Columbia. We identified approximately 1,144 schools and school districts
offering Chinese classes, with a reported enrollment of over 46,727 students.
Figure 6. Distribution of Schools Offering Chinese by State
Approximately 22% of high schools surveyed reported that they offer Advanced Placement (AP) Chinese Language
and Culture classes and 5% of high schools surveyed report that they offer International Baccalaureate (IB) courses.
According to the survey result, 935 full- and part-time teachers of Chinese―of whom 70% are full-time and 30% are
part-time―are currently engaged in high school systems across the country. The majority of schools reporting (76%)
offer between one to four levels of Chinese, and another 24% offer level four or above (893 schools responded to this
question).
About 86 percent of surveyed high schools taught Chinese through academic courses, and 8% of them claimed the
Chinese was also taught through summer classes, after-school classes, or Saturday classes (please note that schools
might teach languages through different type of classes at the same time).
About 67% of reported high schools offered Chinese in traditional classroom settings, and nearly a quarter (22%) offered
Chinese online programs. Approximately 9.8% of high schools reported that they offered Chinese in collaboration with
another local high school, 21% with a community college, and 6% with a university campus.
The National K-16 Foreign Language Enrollment Survey Report 21The West Coast held the highest concentration of schools and students, primarily in California, where we were able to
identify 108 (9.4%) schools offering Chinese instruction and 15.67% of total student enrollments.
Korean:
In 43 schools across 22 states, 936 students are enrolled in Korean language classes. half of these schools (11 schools
or 50%) are located in California. With the exception of New York, where we identified four programs, all other states
have one or two schools. There are a reported total of 18 full- and part-time teachers. The vast majority of these schools
(72.9%) offer year-round classes, and about two-third of the schools offer up to four levels of Korean.
Figure 7. Distribution of Schools Offering Korean by State
22 The National K-16 Foreign Language Enrollment Survey ReportPersian:
We located 10 students of Persian in 10 states and 10 schools. About one-thirds of these schools reported that they offer
after-school and Saturday classes, while 70% reported that they offered year-round classes.
Figure 8. Distribution of Schools Offering Persian by State
The National K-16 Foreign Language Enrollment Survey Report 23Hindi:
Nineteen high schools reported offering Hindi, with a total enrollment of 219, located in Texas, Massachusetts ,Illinois and
California. About 40% of these schools reported that they offer online and online/face-to-face classes, and only about
50% offered year-round classes.
Figure 9. Distribution of Schools Offering Hindi by State
24 The National K-16 Foreign Language Enrollment Survey ReportPortuguese:
Thirty-seven high schools reported offering Portuguese with a total enrollment of 2827, located in 18 states. About 60%
these schools reported that they offer year-round classes, half of which are through traditional classroom instruction and
30% through online courses.
Figure 10. Distribution of Schools Offering Portuguese by State
Russian:
The survey result shows that 3,562 students are enrolled in Russian classes throughout the reporting high schools, with
up to 41 full- and 33 part-time Russian teachers. We identified about 147 schools offering Russian in 41 states. Only a small
number of these schools offer Advanced Placement courses (9), or IB courses (4).
Of these, 94 high schools offering Russian reported levels, which tended to offer up to four levels of Russian. A majority
(67%) of high schools taught Russian through academic courses. Nearly half (43%) offered through traditional classrooms,
while a quarter also reported they offered an online Russian program. The highest number of Russian students is
reported to be in New York (1,108 students). North Carolina has the highest number of schools teaching Russian.
The National K-16 Foreign Language Enrollment Survey Report 25Figure 11. Distribution of Schools Offering Russian by State 26 The National K-16 Foreign Language Enrollment Survey Report
Turkish:
We identified 27 schools in 13 states that offer Turkish language classes, with 865 total students. Most of these students
are located in Texas, with 75.7% of students, and Arizona with 13.3%, and where we have nine and two schools,
respectively.

                              Figure 12. Distribution of Schools Offering Turkish by State

                                                             The National K-16 Foreign Language Enrollment Survey Report     27
Primary Language Education (K-8)
The data collected primarily include information from schools with K-8 language programs. However, some schools
included in the study currently offer language only at the 9-12 level.
K-8 Language Programs Offered by State:
Responses were analyzed by state and languages offered. Table 11. shows the number of responding programs by state
that offer language in grades K-8.
Table 11.
Schools Offering Language by State; Schools Offering K-8 Instruction
Ancient
State Arabic ASL Bengali Chinese French German Greek Hawaiian Hebrew Italian Japanese Korean Latin Persian Russian Spanish Turkish
Greek
AZ - - - - - 1 - - - - 1 - - 1 - - 3 -
CA - - - - 4 7 2 1 - - 2 2 - 2 - - 15 -
CO - - - - 1 1 - - - - - - - 1 - - 2 -
CT - - - - 1 1 - - - - - - - 1 - - 1 -
DC - - - - 1 3 - - - - - - - 3 - - 3 -
DE - - - - 1 1 - - - - - - - 1 - - 1 -
FL - - - - 2 3 - - - - - 1 - 1 - - 3 -
GA - - - - 1 2 1 - - 1 - - - 1 - - 4 -
HI - - - - 1 1 - - 1 - - 2 - - - - 4 -
IA - - - - - - - - - - - - - - - - 1 -
IL - - - - 1 1 - - - - - - - 1 - - 2 -
IN - - - - - - - - - - - - - - - - 1 -
KY - - - - 1 - - - - - - - - - - - - -
LA - - - - - - - - - - - - - - - - 1 -
MA - - - - - 2 1 - - - - - - 1 - - 1 -
MD - - 1 - - 3 2 1 - 1 2 - 1 1 - - 4 -
ME 1 1 - - 2 3 1 - - - - - - 2 - - 3 -
MI - - - - 1 - - - - - - - - - - - 2 -
MN - - - - - 1 - - - - - - - - - - 3 -
MO - - - - 1 1 1 1 - - - - - 1 - 1 1 -
MS - - - - - - - - - - - - - 1 - - 1 -
NC - - - - 2 3 - - - - - - - - - - 7 -
NJ - - - - - - - - - - - - - - - - - -
NM - - - - - - - - - - - 1 - - - - - -
NY - 1 - 1 4 8 1 2 - - 1 2 - 7 1 1 12 1
OH - - - - 1 1 - - - - - - - - - - 1 -
OK - - - - 1 1 - - - - - - - - - - 4 -
OR - 1 1 - 3 2 2 - - - - 2 - - - - 7 -
PA - - - - 1 2 - - - 1 - - - 2 - - 2 -
SC - - - - - 1 1 - - - - - - - - - 2 -
TN - - - - - 1 - 1 - - - - - 2 - - 2 -
TX - - 1 - 2 1 1 - - - - 1 - 2 - - 8 -
UT - - - - - - - - - - - - - 1 - - - -
VA - 1 - - 1 1 - - - - - - - - - - 2 -
WI - - - - 1 5 2 - - - - - - - - - 9 -
WY - - - - - - - - - - - - - - - - - -
Total 1 4 3 1 34 57 15 6 1 3 6 11 1 32 1 2 112 1
As Table 11. indicates, responding schools from 35 states and the District of Columbia that offer instruction at the K-8 level
provided information on language offerings at the K-8 level.
Consistent with information from previous surveys, the most commonly taught language in schools responding to this
survey is Spanish (N=112), trailed by French (N=57). Chinese (N=34) and Latin (N=32) were the next most common. Sixteen
schools (11%), not listed in Table. 10, responded and indicated that they do not currently teach a foreign language.
28 The National K-16 Foreign Language Enrollment Survey ReportLanguages Offered by Grade Level:
After asking about the schools overall, the survey asked for information pertaining to each language. Some schools
indicated that they taught a language, but then did not provide any additional information about that specific language
program, hence a discrepancy in the total number of languages taught as reported in Table 11., and the total number of
language taught, as reported in the following tables.
Table 12. shows the languages offered by grade level. Some responding schools, while offering instruction to a range
of grades including K-8, did not list specific languages to those grade bands. For example, a school included the note
“Exploratory” as the language, meaning that they provide an introduction to a variety of languages through the Foreign
Language Exploratory/Experience approach.
Table 12.
Languages Offered by Grades Level K-8 (in Public and Private Schools)
Language Pre-K K 1 2 3 4 5 6 7 8
Ancient Greek - - - - - - - - - -
Arabic 2 2 2 2 2 2 2 2 2 2
ASL - - - - - - - - - -
Bengali - - 1 1 1 1 1 1 - -
Chinese 2 7 8 8 7 9 11 14 18 18
Explora-tory - - - - - - - 1 - -
French 3 9 9 11 11 12 16 24 36 38
German - 2 2 2 2 3 3 5 7 8
Greek 1 1 1 1 1 1 1 1 1 1
Hebrew - 2 2 2 2 2 2 2 2 2
Italian - - - - - - 1 2 3 4
Japanese - - 1 1 1 1 1 4 5 6
Korean - 1 1 1 1 1 1 - 1 1
Latin - - - - 3 5 8 15 22 23
Persian (Farsi) - - 1 1 1 1 1 1 1 1
Russian - - - - - - - - - 1
Spanish 15 38 47 50 51 53 57 58 63 70
Turkish - - - - - - - - - 1
Total 23 62 75 80 83 91 105 130 161 176
Consistent with the results shown by state, Spanish remains the most frequently taught language, followed by French,
Chinese, and Latin. Table 12. also provides information on which languages are taught each grade level, which is
important information for the Flagship program. For example, although only one school in the sample offers Persian, it is
offered at this school beginning in first grade. Similarly, Korean is only taught at one school, but beginning in kindergarten
with a break in sixth grade.
This table and the specific information from schools will help the Flagship program identify schools that teach specific
Flagship languages, and at which grade levels instruction begins. The data is also useful for viewing which schools begin
instruction in any language early in order to maximize students’ language-learning potential.
The National K-16 Foreign Language Enrollment Survey Report 29Student Enrollment:
Determining enrollment is a challenging task, and is even more challenging when the respondent may not know the
exact numbers of students enrolled on a given day, as described in the methodology section. This question was open-
ended, and some respondents provided a range, rather than an exact figure. In those cases, the middle of the range was
used to facilitate analysis. Responses were then coded into ranges. Table 13. shows the number of students enrolled in
each language in programs that include Grades K-8.
Table 13.
Number of Students per Language K-8
151- 201- 251- 301- 351- 401- 501- 601- 701-
Language 1-20 21-50 51-100 101-150 1000 1100 Total
200 250 300 350 400 500 600 700 800
Programs
Arabic - - 1 1 - - - - - - - - - - - 2
Bengali - 1 - - - - - - - - - - - - - 1
Chinese 2 4 5 4 1 - - 2 - 1 - - - - - 19
Exploratory - 1 - - - - - - - - - - - - - 1
French 4 6 9 4 5 - 3 2 - 1 - - - - - 34
German 1 3 2 1 1 - - - - - - - - - - 8
Greek 1 - - - - - - - - - - - - - - 1
Hebrew - - - - - - - - 1 1 - - - - - 2
Italian 1 1 - 2 - - - - - - - - - - - 4
Japanese 2 2 1 - - - 1 - - - - - - - - 6
Korean - - - 1 - - - - - - - - - - - 1
Latin 2 6 8 2 3 1 - - - - - - - - 22
Persian - - 1 - - - - - - - - - - - - 1
(Farsi)
Spanish 2 4 15 12 16 1 10 8 2 8 2 1 3 1 1 86
Turkish - 1 - - - - - - - - - - - - - 1
Total 15 29 42 27 26 1 15 12 3 11 2 1 3 1 1 189
Language Teaching Approaches:
The next part of the survey asked about how languages were taught. Respondents selected from among five choices:
hybrid, online, immersion, standard foreign language, and exploratory. The survey described each approach as follows:
• Hybrid (online and face-to-face)
• Online
• Immersion (foreign language, heritage, or two-way immersion; foreign language is used for at least 50% of
instruction)
• Standard foreign language (acquire listening, speaking, reading, and writing skills and understanding of other
cultures)
• Exploratory (gain general exposure to language and culture)
• Other (please describe)
30 The National K-16 Foreign Language Enrollment Survey ReportTable 14. Shows the teaching approaches for programs in Grades K-8.
Table 14.
Type of Instruction Offered by Language Programs Offered at K-8 Level
Hybrid (online and Standard foreign
Language Online Immersion Exploratory
face-to-face) language
Arabic - - - 2 -
Bengali - - - - -
Chinese 2 1 4 19 6
Exploratory - - - - 1
French - 1 7 34 13
German - - 1 8 3
Greek - - - 1 -
Hebrew - - 2 2 -
Italian - - - 3 1
Japanese - 1 1 4 1
Korean - - - 1 -
Latin - 2 1 24 5
Persian (Farsi) - - - 1 -
Russian - - - - -
Spanish 3 5 18 74 29
Turkish - - - 1 -
Total 5 10 34 174 59
As Table 14. shows, a standard approach to foreign language teaching was the most common method across languages
taught at the K-8 levels. The second-most common was exploratory, an approach that emphasizes general exposure to
the language and culture which, in the 2008 CAL survey data, was also reported by elementary schools as the second
most commonly-used approach. In this current survey, immersion programs were the third-most common, followed by
online and hybrid models.
Scheduling of Programs:
The survey also asked schools to indicate when languages are taught. Schools could respond in three ways:
• During the school day
• Summer school
• Before or after school
• On the weekend
Tables 15. and 16. show the responses to this question. No respondents selected “on the weekend,” so it is not included
in Tables 15. and 16.
The National K-16 Foreign Language Enrollment Survey Report 31Table 15.
When Classes Are Offered by Language - Programs Offering Grades K-8 Only
Language During the regular school day Summer school Before or after school
Arabic 2 - -
Bengali 1 - -
Chinese 20 - 2
Exploratory 1 - -
French 37 1 3
German 8 - 1
Greek 1 - -
Hebrew 2 - -
Italian 4 - -
Japanese 4 1 1
Korean 1 - -
Latin 23 1 -
Persian (Farsi) 1 - -
Russian 1 - -
Spanish 89 9 5
Turkish 1 - -
Total 196 12 12
As Tables 15. shows, the majority of respondents indicated that languages are taught during the regular school day,
and that languages are taught in equal proportions during summer school and before and after school. Some programs
selected more than one time during which languages were offered.
Collaborations:
The survey asked schools to indicate any collaboration in which their language program participated. Choices included
another local school (elementary, middle, or secondary), a private language school, a heritage or religious school, a
community college, a four-year university, or any other type of collaboration. Table 16. shows the results by K-8 schools.
32 The National K-16 Foreign Language Enrollment Survey ReportTable 16.
Collaborations by Language, Grades K-8
Another local ele-
Private language Heritage or religious Community college Other (please de-
Language mentary, middle, or
school school or university scribe)
high school
Chinese 2 - - - 1
French 3 - - 1 -
German 1 - - 1 -
Hebrew - - 1 - -
Spanish 6 - 1 3 1
Total 12 0 2 5 2
Note: “Other” included trips abroad (Spanish program) and international exchange students (Chinese program) hosted at the school.
Additions or Expansions to Programs:
Responding schools were also asked if they planned to stop offering languages or add new languages to their offerings.
Table 17.
Projected Program Changes by Language
Chinese French German Japanese Latin Italian Hebrew Persian Total
Add - - - - 1 1 1 1 4
Expand 1 1 1 1 - - - - 4
Discontinue - 2 1 - - - - - 3
Note: “Expand”” was not an option for respondents; rather programs that indicated that they were going to “add” a language they already taught were recoded as “expand”
rather than “add” to indicate the language itself would not be new.
Table 17. shows that a few schools intend to add languages to their programs, including one Flagship language, Persian.
Interestingly, there was no overlap between languages being added—that is, new languages being added to a school—
and those being expanded—that is, offering languages already being taught to additional grade levels. The languages
being discontinued included only French and German.
The survey asked respondents to indicate what assessments were used, and provided a selection of commonly
available ones to choose from. Table 18. shows the assessments, by language, being used at the schools in the study.
Table 18.
Assessments Used by Language, Grades K-8
Language ACTFL Oral Proficiency Interview LAS Links LinguaFolio STAMP No nationally-available instruments used Other
Arabic 1 - - - 1 -
Bengali - - - - 1 -
Chinese 1 - - - 11 1
French 4 - 1 1 14 8
German - - - - 4 2
Greek - - - - - 1
Hebrew - - - - 1 1
Italian - - - - - 2
Japanese - - - - 3 1
Korean - - - - 1 -
Latin 1 - - - 7 5
Persian - - - - 1 -
(Farsi)
Russian - - - - 1 -
Spanish 5 2 1 - 48 10
Turkish - - - - 1 -
Total 12 2 2 1 94 31
The National K-16 Foreign Language Enrollment Survey Report 33As Table 18. shows, the most common response was “none,” followed by “other,” which included instruments such
as those developed by the American Associations of Teachers of French (AATF), German (AATG), and Spanish and
Portuguese (AATSP); Avant; locally created assessments; Texas English Language Proficiency Assessment System
(TELPAS); DELF (French proficiency tests); Woodcock-Muñoz; Advanced Placement (AP); and National Language exams.
In addition, 12 schools reported using the ACTFL OPI.
Table 19.
IB Offered by Language, All Grade Levels
Language Yes No Total
Ancient Greek - 2 2
Arabic - 4 4
ASL - 1 1
Bengali - 1 1
Chinese 2 24 26
Exploratory - 1 1
French 3 43 46
German 1 12 13
Greek - 5 5
Hebrew - 2 2
Italian 1 6 7
Japanese - 9 9
Korean - 1 1
Latin - 26 26
Persian (Farsi) - 1 1
Russian - 2 2
Spanish 5 98 103
Turkish - 1 1
Total 12 239 251
Only seven K-8 programs indicated that the IB program was offered in a language.
Implications
The results of the current survey can be used to examine and reflect upon the specific languages and program types
taught in K-12 schools. The data can help school districts, state departments of education, researchers, and government
agencies do the following:
(1) identify schools that teach specific languages in order to encourage well-articulated language sequences
from elementary through middle and high school and continuing through college;
(2) select schools for collaboration, in an effort to promote professional development activities, teacher training,
and curriculum development;
(3) identify schools that may be interested in a relationship with a teacher training institution (sponsoring student
teachers, mentoring undergraduates, or collaborating in other ways);
(4) identify schools that could serve as national model programs for their language taught and/or program design;
(5) identify schools near Flagship universities whose students could be possible candidates for language study at
the universities (whether they already study a specific Flagship language or not);
(6) investigate types of collaboration between K-12 schools and other entities to highlight successful efforts and
ways of replicating them at other schools; and
(7) explore student participation in government-sponsored extracurricular foreign language opportunities and
investigate ways of promoting participation.
The survey results show that, despite the increasing availability of online and hybrid teaching approaches, even in
these less commonly taught languages (LCTLs), standard face-to-face language teaching approaches are still the norm.
34 The National K-16 Foreign Language Enrollment Survey ReportUnderstanding that language teaching is likely to be conducted face-to-face provides important contextualization for
future conversations about collaboration as well as for considerations in articulation.
The data on the nationally available assessments being used show that little is being done to document language
outcomes at the K-12 level among respondents to this survey. The overwhelming majority of respondents indicated that
they do not use any nationally available standardized test to measure outcomes. Of almost equal concern is the number
of K-8 programs (N=12) that indicated that they use the ACTFL OPI to measure student outcomes. The ACTFL OPI is
not an appropriate instrument for students at these grade levels, and it is difficult to imagine the usefulness of the data
gathered from such an instrument. This result shows that language educators still have limited knowledge of appropriate
ways to assess what students know and are able to do with language after different K-8 language learning sequences.
Finally, the sheer difficulty of collecting data is noteworthy. With repeated efforts via email and telephone, we were
able to obtain a 38% return for K-8 schools and 44.3% for high schools. However, the lack of knowledge about foreign
language teaching and learning at the school level was striking, and it suggests that any future studies will require more
funding and time to obtain more data and deeper insights about the current status of K-12 foreign language learning.
The National K-16 Foreign Language Enrollment Survey Report 35Appendix 1: Outreach Campaign
American Councils and its partners launched an outreach campaign to reach out to the foreign/world language
community to invite participation in the Enrollment Survey. This consisted of the following:
Press Release:
American Councils released an official press release through its newswire distribution service, PRWeb. The release is
also featured on the American Councils website here. The press release received 29,384 headline impressions and was
delivered to 1,305 media outlets for distribution. The potential audience that viewed the release, after distribution to the
media outlets, is 136,021,300.
Website Presence:
American Councils created a landing page for the Comprehensive Survey of Foreign Language Enrollments on its
website in order to direct traffic toward the survey and provide detail about the effort. As of March 25, 2015, the page
has received 2,918 views (2,614 unique views), with visitors spending an average of 3:36 minutes on the page. Of the
total number of views, 81.73% are direct referrals, meaning the website URL was entered directly into the user’s browser.
Email Outreach and Social Media Presence:
Dr. Dan E. Davidson, President of American Councils, reached out directly via email to senior-level leadership at
language-related organizations in which he has relationships in order to request their collaboration in encouraging
participation in the Foreign Language Enrollment Survey.
American Councils also issued a follow-up email to invite the members of foreign language education organizations to
participate in the survey and to again encourage participation.
Of the list of 95 language-related organizations invited to participate in the Comprehensive Survey of Foreign Language
Enrollments, 31 of these organizations have Twitter accounts. Each organization received a variation of the below tweet
as a reminder to take the Enrollment Survey and/or share it with their constituents. Several organizations retweeted or
noted it as a “favorite” tweet, while the American Association of French Teachers offered to share a link to the survey
on their respective Facebook page. Listed below is a list of organizations contacted, including those that have Twitter
accounts:
1. African Language Teachers Association (ALTA)
2. American Association for Applied Linguistics
3. American Association for Teachers of Slavic and East European Languages (AATSEEL)
4. American Association for the Advancement of Slavic Studies (AAASS)
5. American Association of Teachers of Arabic (AATA)
6. American Association of Teachers of French
7. American Association of Teachers of German
8. American Association of Teachers of Italian
9. American Association of Teachers of Japanese
10. American Association of Teachers of Korean
11. American Association of Teachers of Persian
12. American Association of Teachers of Slavic and East European Languages (AATSEEL)
13. American Association of Teachers of Spanish and Portuguese, Inc. (AATSP)
14. American Association of Teachers of Turkic Languages (AATT)
15. American Council of Teachers of Russian/American Councils for International Education
16. American Council on the Teaching of Foreign Languages
17. American Foundation for Translation and Interpretation
18. American Hungarian Educators’ Association
36 The National K-16 Foreign Language Enrollment Survey Report19. American Portuguese Studies Association (APSA)
20. American Sign Language Teachers Association
21. Arkansas Foreign Language Teachers Association
22. Association for Asian Studies (AAS)
23. Association for the Advancement of Baltic Studies
24. Association of Teachers of Japanese
25. Brigham Young University Center for Language Studies
26. California Language Teachers Association
27. Center for Advanced Research on Language Acquisition
28. Center for Applied Linguistics
29. Center for the Advanced Study of Language
30. Central States Conference on the Teaching of Foreign Languages
31. Certified Languages International
32. CETRA Language Solutions
33. Chinese Language Association for Secondary/Elementary Schools (CLASS)
34. Chinese Language Teachers Association (CLTA)
35. Colorado Congress of Foreign Language Teachers
36. Computer Assisted Language Instruction Consortium
37. Concordia Language Villages
38. Connecticut Council of Language Teachers
39. Consortium for the Teaching of Indonesian
40. Council of Teachers of Southeast Asian Languages (COTSEAL)
41. Defense Language Institute Foundation
42. Florida Foreign Language Association
43. Foreign Language Association of Georgia
44. Foreign Language Association of Missouri
45. Foreign Language Association of North Carolina
46. Foreign Language Association of North Dakota
47. Foreign Language Association of Virginia
48. Foreign Language Educators of New Jersey
49. Group of Universities for the Advancement of Vietnamese Abroad (GUAVA)
50. Illinois Council on the Teaching of Foreign Languages
51. Indiana Foreign Language Teachers Association
52. Institute for Applied Linguistics, Kent State University
53. International Association for Language Learning Technology
54. International Association of Teachers of Czech
55. International Language and Culture Foundation
56. Iowa World Language Association
57. Japan Foundation, Los Angeles
58. Kansas World Language Association
59. Kentucky World Language Association
60. Latvian Association of Language Teachers (LALT)
61. Less Commonly Taught Languages Project (LCTL), The University of Minnesota
62. Linguistic Society of America
63. Louisiana Foreign Language Teaching Association
64. Massachusetts Foreign Language Association
65. Michigan World Language Association
66. Middlebury Language Schools
67. Minnesota Council on the Teaching of Languages and Cultures
68. Modern Greek Language Teacher Association (MGLTA)
69. Monterey Institute of International Studies
70. National Association of District Supervisors for Foreign Languages
71. National Association of Self-Instructional Language Programs
72. National Committee for Latin and Greek
The National K-16 Foreign Language Enrollment Survey Report 37You can also read