SCHOOL RE-OPENINGS AFTER SUMMER BREAKS IN GERMANY DID NOT INCREASE SARS-COV-2 CASES - IZA DP NO. 13790 OCTOBER 2020
←
→
Page content transcription
If your browser does not render page correctly, please read the page content below
DISCUSSION PAPER SERIES

IZA DP No. 13790

School Re-Openings after Summer Breaks
in Germany Did Not Increase SARS-CoV-2
Cases

Ingo E. Isphording
Marc Lipfert
Nico Pestel

OCTOBER 2020
DISCUSSION PAPER SERIES

IZA DP No. 13790

School Re-Openings after Summer Breaks
in Germany Did Not Increase SARS-CoV-2
Cases
Ingo E. Isphording
IZA and CESifo
Marc Lipfert
University of Bonn
Nico Pestel
IZA

OCTOBER 2020

Any opinions expressed in this paper are those of the author(s) and not those of IZA. Research published in this series may
include views on policy, but IZA takes no institutional policy positions. The IZA research network is committed to the IZA
Guiding Principles of Research Integrity.
The IZA Institute of Labor Economics is an independent economic research institute that conducts research in labor economics
and offers evidence-based policy advice on labor market issues. Supported by the Deutsche Post Foundation, IZA runs the
world’s largest network of economists, whose research aims to provide answers to the global labor market challenges of our
time. Our key objective is to build bridges between academic research, policymakers and society.
IZA Discussion Papers often represent preliminary work and are circulated to encourage discussion. Citation of such a paper
should account for its provisional character. A revised version may be available directly from the author.

                                                     ISSN: 2365-9793

                                           IZA – Institute of Labor Economics
Schaumburg-Lippe-Straße 5–9                      Phone: +49-228-3894-0
53113 Bonn, Germany                             Email: publications@iza.org                                    www.iza.org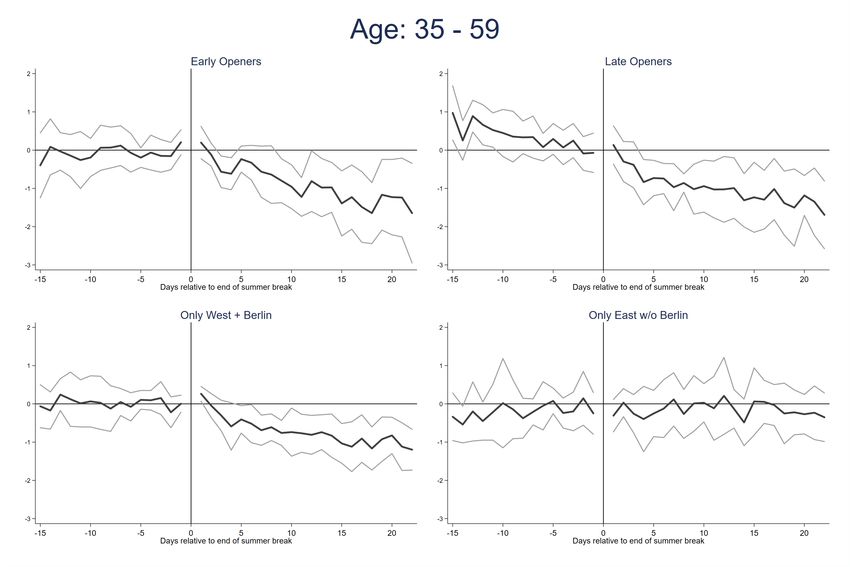
IZA DP No. 13790                                                                                                           OCTOBER 2020

            ABSTRACT
            School Re-Openings after Summer Breaks
            in Germany Did Not Increase SARS-CoV-2
            Cases*
            This paper studies the effect of the end of school summer breaks on SARS-CoV-2 cases
            in Germany. We exploit variation in the staggered timing of summer breaks across federal
            states which allows us to implement an event study design. We base our analysis on official
            daily counts of confirmed coronavirus infections by age groups across all 401 German
            counties. We consider an event window of two weeks before and three weeks after the
            end of summer breaks. Over a large number of specifications, sub-group analyses and
            robustness checks, we do not find any evidence of a positive effect of school re-openings
            on case numbers. On the contrary, our preferred specification indicates that the end
            of summer breaks had a negative effect on the number of new confirmed cases. Three
            weeks after the end of summer breaks, cases have decreased by 0.55 cases per 100,000
            inhabitants or 27 percent of a standard deviation. Our results are not explained by changes
            in mobility patterns around school re-openings arising from travel returnees. We conclude
            that school re-openings in Germany under strict hygiene measures combined with
            quarantine and containment measures have not increased the number of newly confirmed
            SARS-CoV-2 infections.

            JEL Classification:              I12, I18, I28
            Keywords:                        COVID-19, schooling, education, Germany

            Corresponding author:
            Ingo E. Isphording
            Institute of Labor Economics
            Schaumburg-Lippe-Str. 5- 9
            53113 Bonn
            Germany
            E-mail: isphording@iza.org

            * We are grateful to Reyn van Ewijk, Hilmar Schneider, Andreas Peichl, Simon Schulten, Sebastian Siegloch,
            Olivier Deschenes, Mikko Silliman, and seminar participants at IZA for helpful comments and suggestions. Johannes
            Schmieden and Daniela Ramirez Fuentes provided excellent research assistance.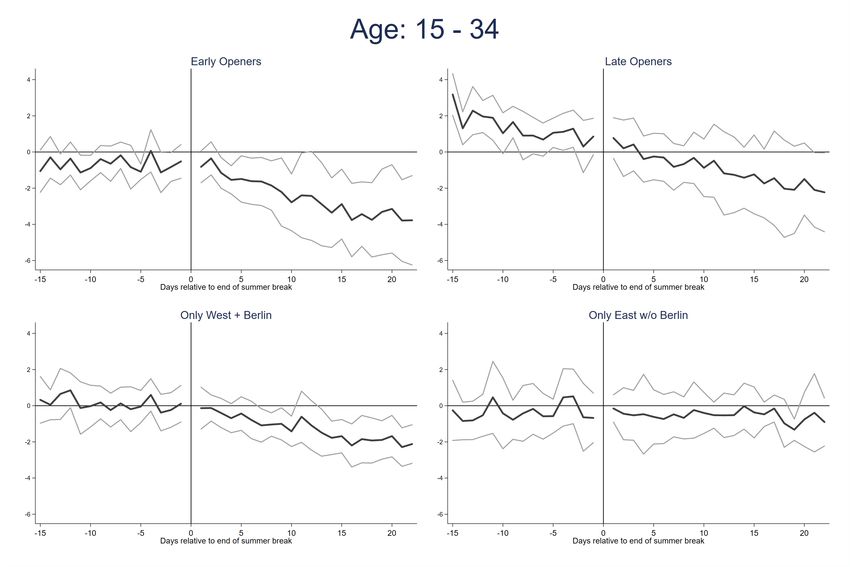
1 Introduction

School closures have been among the most common non-pharmaceutical interventions to slow
down the spread of the novel coronavirus (SARS-CoV-2). According to UNESCO estimates,
these affected over 60 percent of the world’s student population.1 Closing schools is expected to
widen gaps by socio-economic status in school performance and longer-term career outcomes
as students from disadvantaged households lack resources and parental inputs to ensure a
successful learning at home (Fuchs-Schündeln et al., 2020). Despite the large expected costs
of school closures for human capital formation, in many countries policymakers remain hesitant
to re-open schools. In cases where schools have re-opened, confirmed cases and quarantine
measures in schools draw disproportional media attention. Closing schools remains a commonly
cited option to counter newly rising case numbers. A controversial and heated debate between
advocates of online-only solutions vs. on-site education, as recently summarized by Levinson
et al. (2020) for the U.S., is characterized by the lack of empirical evidence on how school
re-openings affect the spread of the novel coronavirus.

         Against this background, we provide estimates of how the end of summer breaks and
the associated school re-openings under strict hygiene measures in Germany have affected the
course of the COVID-19 pandemic. We exploit the staggered timing of summer breaks across
German federal states. We implement an event study design in which we intuitively compare
changes in newly confirmed cases in re-opening states over the end of summer breaks. States
having not (yet) re-opened schools act as a control group. We base our estimations on official
daily case counts by age group across all 401 German counties. In all specifications, we control
for changing mobility patterns, measured by Google Mobility Reports and commercial mobile
phone data. Over a large number of specifications and robustness checks, we do not find
evidence for a positive effect of the end of summer breaks on the number of confirmed cases.
Rather, our results indicate a significant negative effect on the number of newly confirmed
cases. Our preferred estimates indicate that three weeks after schools have re-opened, cases
have decreased by 0.55 cases per 100,000 (100K) population or 27 percent of a standard
deviation. The effect is concentrated among patients aged up to 34 years. In contrast, for the
specifically vulnerable age groups 60+, infection rates appear to be unaffected by the school
re-openings in the short term.

         The pattern of a reduction in case numbers following the end of summer breaks may not
be in accordance with initial priors and may contradict salient media reports of individual cases
 1
     See https://en.unesco.org/covid19/educationresponse (last accessed: 23 September 2020).

                                                  1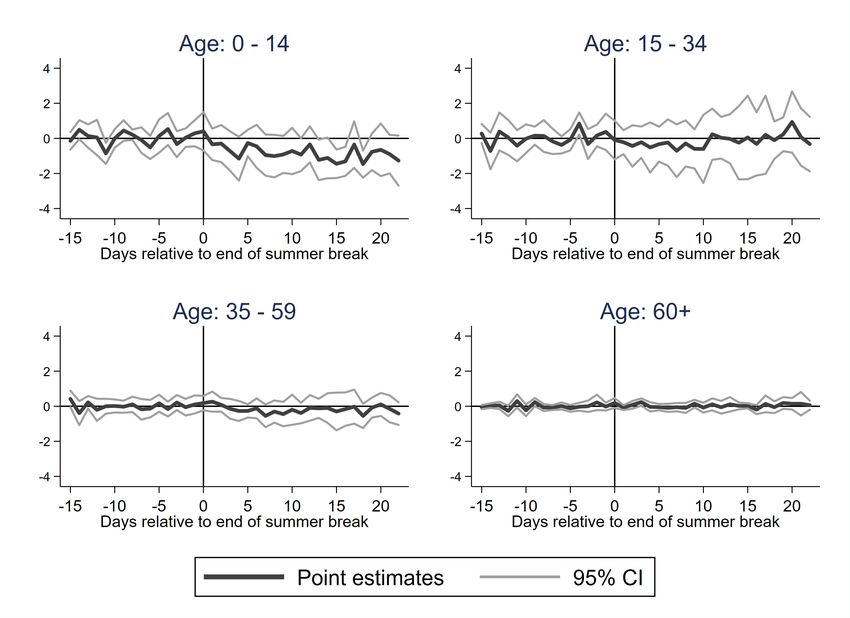
and quarantine measures in single schools. The following plausible mechanisms may explain
the pattern of our findings. First, schools re-opened after the summer breaks under strict
hygiene and containment measures, including mandatory mask wearing and teaching in fixed
groups. Detection of individual infections among students or teachers led to rapid testing and
quarantining of contact persons. Second, the effect of the end of summer breaks has to be
interpreted against a context of very low community spread and decreasing acceptance of social
distancing measures. This situation is likely not the flip side of the coin of comprehensive school
closures during a phase of exponential growth in case numbers in March and April. Third,
school re-openings likely led to changes in parental behavior, as opportunity costs of caring
for an symptomatic child at home increased. As students with corona-related symptoms were
barred from school until negatively tested, any respiratory infection was associated with high
opportunity costs, e.g., time investments for child care or forgone working hours. Thus, school
re-openings increased parents’ incentives to comply more thoroughly with social distancing and
hygiene measures to avoid their children falling ill with symptoms similar to those of COVID-19.

      Our results have important implications for policymakers world-wide. To the best of
our knowledge, we are the first to provide causal evidence on the effect of school re-openings
associated with the end of summer breaks in a quasi-experimental design. We show that in a
situation where schools re-open under strict hygiene measures, case numbers do not positively
respond to the end of summer breaks. Freely available rapid testing for teachers and students as
well as decentralized quarantine and containment measures appear to be sufficient to keep the
pandemic under control and simultaneously allow for universal in-class teaching. The robust
negative effect of the end of summer breaks on case numbers suggests that re-opened schools
can even contribute to the containment of the pandemic, compared to the situation during
the summer breaks. Given the high immediate and longer-run human capital costs of school
closures, our results should be taken seriously in re-evaluating the cost-benefit considerations
of moving back to on-site schooling. Yet, in doing so, the context of our estimation of
a situation of low community spread and the restricted time horizon of three weeks after
the school re-openings after the summer breaks has to be kept in mind. In particular, the
increasingly accelerating number of new infections in the overall population during September
and October 2020 may increase the risk of more infections among students. Furthermore,
colder temperatures and worse weather conditions in the fall may hamper outdoor activities
and ventilation of classrooms, which may also facilitate outbreaks in schools.

      We run an extensive battery of alternative specifications and subgroup analyses to assess

                                                2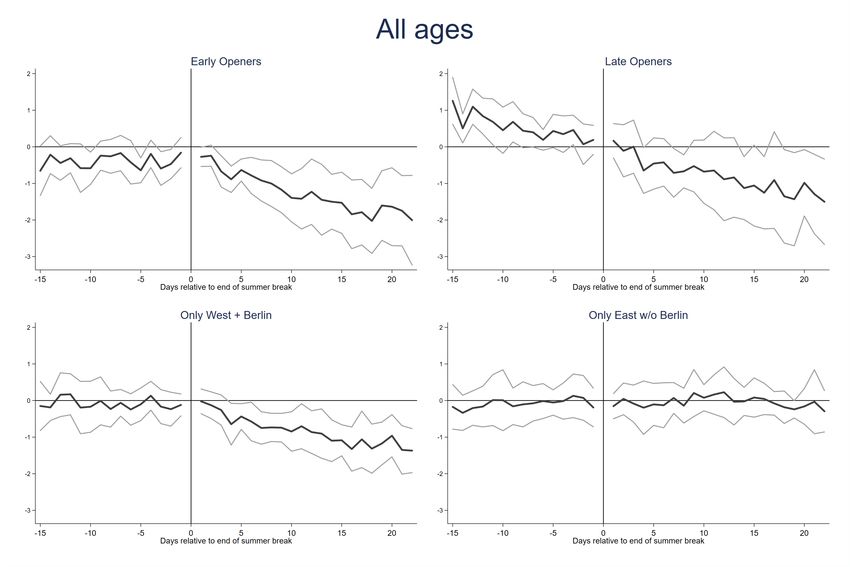
the robustness of our estimates. Estimations accounting for confounding dynamic heteroge-
neous treatment effects following de Chaisemartin and D’Haultfoeuille (2020) do not alter the
found patterns. The exclusion of any single state does not affect the overall pattern. Subgroup
analyses reveal that mainly states with early summer breaks and states in West Germany drive
the negative effect of the end of summer breaks on SARS-CoV-2 cases. East German states
and states with late summer breaks instead show constant rates of infection around the end
of summer break. Importantly, not in a single robustness check or sub-group, we find any evi-
dence for a positive effect of the end of summer breaks and the associated school re-openings
on the spread of the virus.

2 Background

The role of summer breaks, school closures and re-openings during a pandemic. The
effectiveness of school closures to counter the spread of the COVID-19 pandemic is controver-
sially debated because of conflicting evidence and a lack of understanding of specific mecha-
nisms. In addition, only few studies have addressed the role of school re-openings, which are
not necessarily the other side of the coin of school closures during exponential growth of case
numbers in the first wave.

      Studies investigating the role of school closures in mitigating earlier influenza epidemics
have provided mixed empirical evidence heavily depending on the local context. Jackson et al.
(2013) provide a systematic review of 65 studies which analyze situations where seasonal
or pandemic influenza outbreaks coincided with planned or unplanned school closures. In
general, influenza incidence declined after school closure. The effect was reversed after school
re-openings in only a few cases . The authors stress potential caveats in estimating the effect
of school closures: It is difficult to isolate the effect of school closures from a natural decline
of case numbers when school closures are enacted late in a pandemic wave. It is also difficult
to disentangle the effect of school closures from other non-pharmaceutical interventions like
social distancing strategies when these are implemented as bundles of different measures.

      A subset of studies focuses on regular school closures due to summer breaks (De Luca
et al., 2018; Chu et al., 2017). In general, these studies find mitigating effects of school closures
in the context of influenza epidemics. An advantage of the analysis of regular summer breaks,
also exploited in our own analysis, is that these do typically not coincide with further non-
pharmaceutical interventions. Yet, one has to take into account that summer breaks affect

                                                 3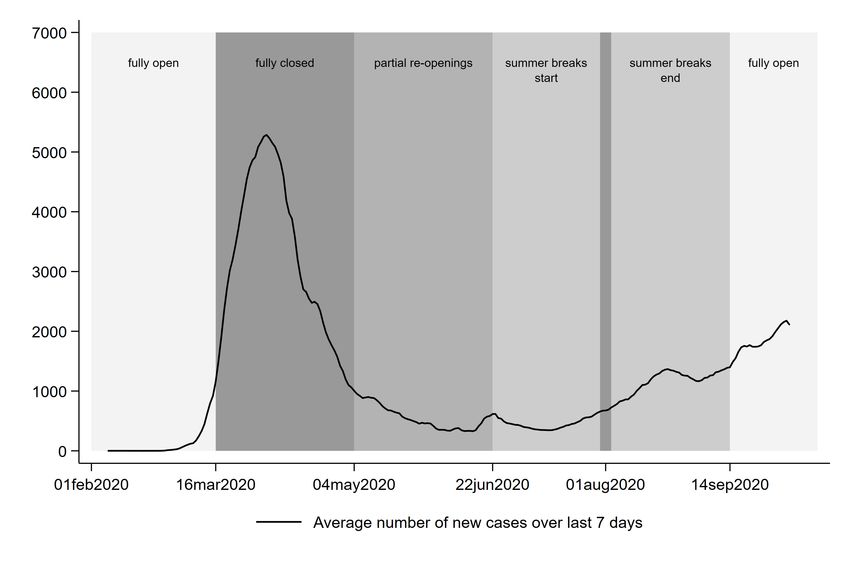
case numbers through different mechanisms: School closures, but also differences in social
mixing and mobility patterns can reduce or increase the number of new infections (Eames
et al., 2012; Apolloni et al., 2013).

      For the specific case of SARS-CoV-2, early studies mirror the mixed evidence found for
previous epidemic outbreaks. Viner et al. (2020) conclude in an early review of 16 studies on
school closures in China and Hong Kong that these did not contribute to the containment of
the epidemic. Studies comparing infection rates surrounding school closures outside China in
general find lower infection rates after school closures (Auger et al., 2020; Stage et al., 2020).
As in the case of earlier influenza-related studies, authors note the difficulty of disentangling
the effect of school closures from coinciding further non-pharmaceutical interventions (Auger
et al., 2020). Studies that trace direct transmissions of SARS-CoV-2 between individuals
report a lack of evidence for transmissions among primary school children, e.g., in Ireland
(Heavey et al., 2020), France (Fontanet et al., 2020) and Australia (Macartney et al., 2020).
Macartney et al. (2020) highlight the role of case-contact testing and epidemic management
strategies in contributing to low transmission rates. Zhang et al. (2020) conclude from a
transmission model calibrated on infection rates among children that proactive school closures
cannot interrupt transmission on their own, but can reduce peak incidence by 40–60 percent
and slow down the epidemic.

      Apart from prospective simulations, to the best of our knowledge only two studies have
addressed how school re-openings affect the spread of SARS-CoV-2. Stage et al. (2020)
conclude that partial re-openings before the summer breaks in Germany and Scandinavian
countries have not resulted in significant increases in the growth rate of new cases. Further
studies are restricted to the description of case studies. Notably, Stein-Zamir et al. (2020)
describe a significant high-school outbreak in Israel a few days after re-opening.

School closures during the COVID-19 pandemic in Germany. In Germany, the number
of confirmed SARS-CoV-2 infections started to increase exponentially in early March. Closures
of schools and daycare facilities for children were an integral part of policymakers’ immediate
response to the coronavirus outbreak. Figure 1 shows the development of the total number
of confirmed cases as well as the phases of schools closures and re-openings in Germany.
While the decision to close schools is in the responsibility of the 16 states, the federal and
the state governments had agreed on a coordinated approach such that the onset of school
closures occurred in all states during the days from 16 to 18 March 2020. Only children of
parents working in essential occupations were eligible for emergency care in schools and daycare

                                                4
facilities. Before that, schools had operated under pre-pandemic (“normal”) conditions, i.e.,
without hygiene measures, social distancing or separation of groups.
After a phase of rigorous restrictions of physical contact (Kontaktbeschränkungen) in
March and April, state governments started to partially re-open schools under strict hygiene
measures and social distancing rules from mid of April on. Children were admitted to school
on a rotating basis, only for certain grades, and in small groups on few days. The degree of
partial re-openings of schools differed between states.
The school year 2019/2020 ended as planned between 22 June and 30 July followed
by summer breaks of six weeks. Traditionally, starting and ending dates of summer breaks
differ between states to prevent the entire German population to go on holidays at the same
time. The staggered summer breaks avoid traffic congestion as well as excess demand for
holiday accommodation in tourist regions. A long-term scheduling of summer vacation periods
across states (currently up to 2024) is decided by the Standing Conference of the Ministers
of Education and Cultural Affairs (Kultusministerkonferenz, KMK), a consortium of state
ministers responsible for education and schooling.2 Proposals to adjust the summer break
schedule in response to the pandemic were discussed, but eventually rejected. Thus, the
summer breaks remained unaffected by regional differences in the spread of the pandemic.
Figure 2 displays the spatial and temporal variation in school starting dates after the summer
break across German states.3 Only for a few days around 1 August all schools in Germany are
closed due to summer breaks. We focus on the phase of full re-opening of schools in all states
after the summer breaks which took place from early-August to mid-September 2020.
School re-openings under strict hygiene measures. Throughout the summer breaks, state
and school administrations discussed best practices of how to allow schools to be re-opened
by simultaneously minimizing the risk of spreading the virus. In mid-July, the KMK agreed
on a common framework for measures to be implemented by state governments, such that
schools re-opened after the summer breaks under fairly homogeneous conditions (Kultusminis-
terkonferenz, 2020). This common framework provided guidelines for a wide range of hygiene
measures, wearing of face masks, ventilation and disinfection of classrooms, social distancing
2
See https://www.kmk.org/service/ferien.html for details (last accessed: September 10, 2020).
3
For later robustness checks, we distinguish between early and late re-openers. Early opening states are
the states of Mecklenburg-Vorpommern (3 August), Hamburg (6 August), and Schleswig-Holstein, Berlin,
Brandenburg (10 August) and finally Hessia, Rhineland-Palatinate, and Saarland on 17 August. Late openers
are Lower Saxony, Bremen, and Saxony-Anhalt on 27 August, Saxony and Thuringa on 31 August and then
finally Bavaria and Baden-Wuerttemberg on 8 and 14 September, respectively.
5rules, separation of groups to facilitate contact tracing and regular testing of teachers and
students. Students, teachers and parents showing symptoms related to COVID-19 were not
allowed to enter the school perimeter. When new infections were detected, relevant groups
were immediately quarantined, with other groups remaining in school and being closely mon-
itored for additional new cases. A much-noticed statement by the German national academy
of sciences supported this strategy, further stressing the importance of fixed and separated
epidemiological groups, systematic testing and rapid quarantining (Leopoldina, 2020).
As responsibilities ultimately lie with the federal state authorities, specific rules differed
between states at school re-opening. Table A.1 in the Appendix summarizes the extent of
heterogeneity in minimum requirements with respect to these measures across federal states.
In almost all states, mask wearing was mandatory for older students, partly even during class.
For primary school students, masks were mostly worn on the way to the classroom, yet were
not worn during class. Fixed groups were largely assigned on a classroom basis, in other cases
on cohort basis. Groups remained physically separated, sometimes through staggered school
start times. Testing was readily available for affected children and teachers. Symptomatic
students went into 14 days of quarantine. Sports and music classes were suspended. Schools
were able to deviate from agreed minimum requirements and often applied stricter measures.
3 Data
Confirmed cases of SARS-CoV-2 infections. Our main data source comprises daily new
confirmed SARS-CoV-2 cases by German counties (Kreise). This data is collected from the
official COVID-19 reporting database which is maintained by Germany’s main public health
institute, the Robert-Koch-Institut (RKI). In accordance with the Infection Protection Act
(Infektionsschutzgesetz), the RKI collects daily reports from county-level public health offices
on newly detected cases and deaths. Case reports are transmitted to the RKI by 0:00 a.m. on
the respective day.
The records contain the exact date on which the local public health office became aware
of the case and recorded it electronically. We focus on this date in our empirical analysis.4
4
For cases where symptoms where present before the testing, the data contains additional information on when
the patient became ill with clinical symptoms according to the patient’s own statement or according to the
statement of the treating physician (onset of symptoms). Since testing has strongly been extended over
the summer months, and the share of detected asymptomatic cases has increased (or at least the share of
infected patients being tested before they develop symptoms), we do not take the date of onset of symptoms
into account.
6Cases are separately recorded by age group: 0–14, 15–34, 35–59, 60-79 and 80+.5 For the
purpose of our analysis, we combine the latter two and create the age group 60+. Daily case
counts are regularly updated based on delayed lab confirmations and deaths of earlier recorded
cases. The analysis of this paper is based on a snapshot of the data taken on 6 October 2020
and we consider the observation window from 1 July to 5 October 2020. To take into account
regional differences in population density, we normalize case numbers by 100K population by
county and age group.
Table 1 summarizes case numbers over the period of observation by age group, and
separately for periods before and after the school re-openings. Two patterns are noteworthy.
First, while initial infections during the peak of the pandemic in early-April were more concen-
trated among vulnerable age groups 60+, over the summer the share of younger age groups
among the total number of confirmed cases has grown strongly. Confirmed cases are highest
among the 15–34 year old which display with 2 cases per 100K population a roughly twice as
large case rate than for the age groups 0–14 and 35–59. Compared to ages 60+, the case rate
is even four times as high. Additionally, after cases in Germany had decreased for a period of
almost three months since the peak of the pandemic, they started to rise again since late-June
(see Figure 1). Case numbers are thus higher in each age group after the school re-opening
compared to the situation before. Our empirical analysis will determine to what extent the
end of school summer breaks is causally related to this increase.
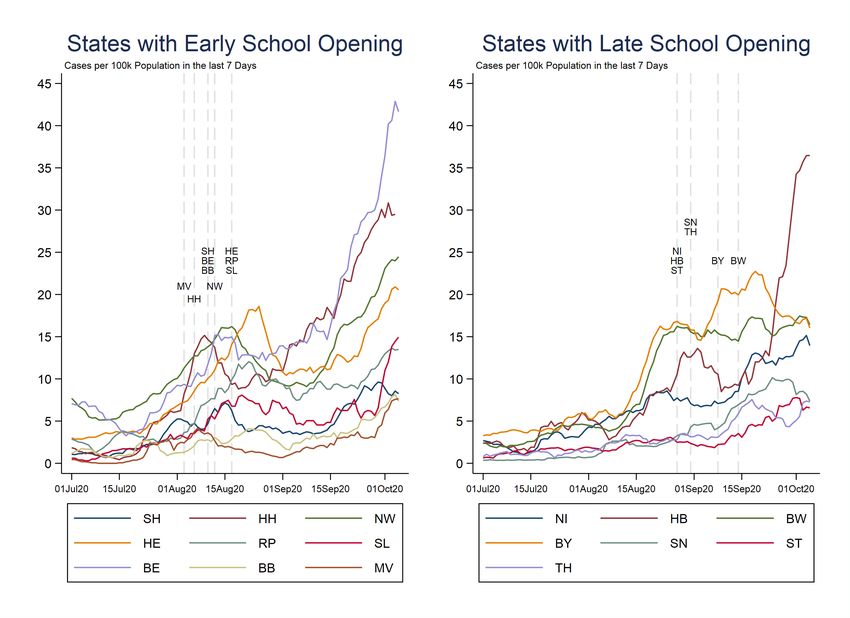
Figure 3 compares the evolution of confirmed cases across early and late re-opening
states. The evolution of cases shows a pattern of increasing case numbers of SARS-CoV-2
infections over the summer months, yet at different points in time in different states. No clear
and systematic pattern surrounding the school-openings is apparent from the data. Peaks
of cases appear both left and right of the re-opening dates. The figure displays the strong
heterogeneity of the pandemic’s evolution over German regions. East German states (BB, MV,
SN, ST, TH) display a much lower case incidence and growth rate than the more populated
West German states.
Mobility patterns. The end of summer breaks necessarily leads to coinciding changes which
might have independent effects on the course of the pandemic. Summer breaks are charac-
terized by significantly different mobility patterns, decreased commuting and lower usage of
public transportation. These changes might affect the spread of the pandemic independently
5
Unfortunately, the age groups are fixed by the data provider and cannot be altered to more appropriately
capture school-aged children.
7from re-opening of schools and might ask for different policy responses.
To disentangle the effect of school re-openings as good as possible from these coinciding
changes in mobility patterns, we keep the latter constant by controlling for several measures
of mobile phone mobility. First, we use commercial data on daily levels of mobile phone
mobility within and across counties covering about one third of Germany’s mobile phone
market provided by Teralytics. Specifically, we control for the daily number of within-county
mobility as well as between-county mobility both within and across states. Second, we draw
state-level information on relative duration of stays at different places from Google Mobility
Reports: groceries, parks, home, retail and recreation, transit stations and workplaces. Figures
A.1 and A.2 show how mobility patterns change surrounding the end of summer breaks.
Mobility within states (both within and across counties of the same state) gradually
increase before the end of the summer break and remains constant thereafter (Panels A and B
of Figure A.1). Mobility across state borders (Panels C1 and C2), which may be largely driven
by travel returnees, is higher before the re-opening of schools and also remains constant after
the end of summer breaks. Figure A.2 shows that mobility related to everyday life activities
(grocery and retail shopping, commuting and work) gradually increases before the end of
summer breaks and does not change much afterwards, reflecting that families with school-
aged children gradually return to their places of residence and take up everyday activities.
4 Empirical Approach
The aim of this study is to disentangle the causal effect of the end of summer breaks and the
associated school re-openings on the spread of the pandemic from coinciding patterns in the
evolution of cases. We do so by exploiting the staggered summer break schedule across federal
states. Intuitively, we compare the evolution of cases in states where summer breaks have
ended with states with summer breaks yet to be ended and those who have already opened
schools as control groups.
Our analysis relies on the assumption that cases after summer breaks would have de-
veloped similarly as in control states in the counterfactual and unobservable situation that
schools would have remained closed. To support this identification assumption, we present our
estimates in the form of event study graphs to establish that trends in cases between treat-
ment and control states behaved similarly in the days preceding the end of summer breaks.
We discuss potential conditions that would invalidate our identification assumption in Section
85.2. Our empirical model reads:
22
CoVgist = αi + µt +
X
βτ SchoolsOpens,t−τ + Xit0 γ + εist (1)
τ =−15,τ 6=0
g
where CoVist denotes the number of new confirmed cases of SARS-CoV-2 infections in
county i in state s on date of reporting t per 100K of population of age group g. The indicator
SchoolsOpens,t−τ takes a value of one if the county i’s state s has schools open on date t.
Following Schmidheiny and Siegloch (2019), we limit the effect window to a finite number of
leads and lags of two weeks before and three weeks after the end of the summer breaks and
create bins for the endpoints of the event window. County fixed effects αi control for time-
invariant unobserved characteristics, most notably population density and age structure. Date
fixed effects µt control for any unobserved influence that affects the evolution of cases globally
across counties. This includes, among others, changes in nation-wide counter-measures or the
testing regime in place. Our baseline period is τ = 0, i.e., the first school day after the summer
break. While the direct effect of school openings on case numbers may be expected to kick
in only after some days, indirect effects of school openings acting through parental behavior
may lead to more immediate changes. Therefore, we present results relative to the first
day at school. We additionally control for time-varying controls Xit which most importantly
include changing mobility patterns assessed by mobile phone movements and Google Mobility
Reports. To determine heterogeneous effects on different age groups, we estimate Equation
(1) separately for the overall number of cases and case numbers by age groups. Standard
errors εist in all estimations are clustered at the federal state level.
5 Empirical results
In section 5.1, we first present estimates for the entire sample as well as effects separately
estimated for different age groups. We then present estimates for different subgroups as well
as alternate specifications to corroborate our main results in section 5.2.
5.1 Main Results
Figure 4 displays coefficients of interactions between time indicators relative to the end of sum-
mer breaks based on Equation (1). Before schools re-opened, cases do not differ significantly
9between treatment and control states. After the end of summer breaks, cases significantly de-
crease in counties in re-opening states relative to the control group. Three weeks after school
openings, cases per 100K population have decreased by 0.55 or 27 percent of a standard
deviation.
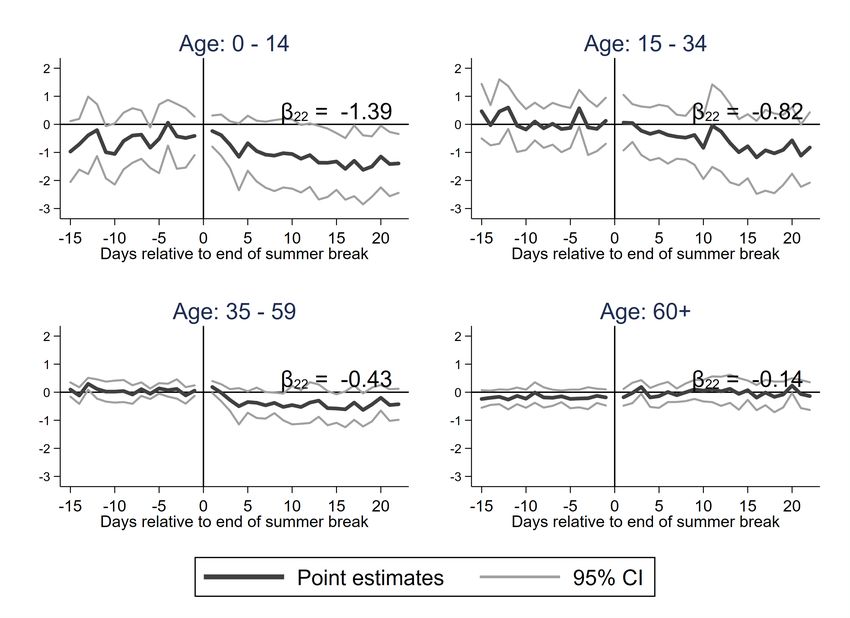
Figure 5 reports estimated coefficients of Equation (1) separately for different age groups.
The overall pattern is mirrored in the results for cases among 0–14, 15–34 and 35–59 year-old
individuals. The effect is strongest in the youngest age group of 0–14 year old cases where the
end of summer breaks is associated with a significant reduction in cases per 100K population
of about 1.4 cases after 3 weeks for individuals up to 14 years (42 percent of a standard
deviation). Reductions for older age groups are smaller and insignificant: 0.82 cases in the
group of 15–34 years (21 percent of a standard deviation) and 0.43 cases in the group of
35–59 years (16 percent of a standard deviation). The more vulnerable population of 60+
years appears to be unaffected by the school openings.
The concentration of effects among the youngest age group encompassing school-aged
children, and the gradual decrease of the effect size by age corroborates that reductions in
case numbers around the end of summer breaks are causally linked to the school re-openings.
5.2 Robustness Checks
Heterogeneous dynamic treatment effects. Several recent contributions have demon-
strated that difference-in-differences approaches with staggered introductions of treatments
might provide biased estimates if treatment effects change over time dynamically (Goodman-
Bacon, 2018; Callaway and Sant’Anna, 2019; de Chaisemartin and D’Haultfoeuille, 2020). The
intuition behind this empirical problem is that estimates partly rely on problematic comparisons
of newly treated observations (“switchers”) with already treated units. These already treated
units display a problematic control group if treatment not only leads to a level change, but
rather leads to dynamic changes in the outcome.
This problem can be circumvented by focusing on unproblematic comparisons only, which
compare switchers with not yet treated observations (de Chaisemartin and D’Haultfoeuille,
2020).6 Estimates based on their approach are summarized in Figure A.3. Despite the fact
that daily effects are identified by ever-smaller numbers of observations with increasing time
since treatment (Figure A.4), the found pattern is very similar to our main results based on
simple event studies without adjustment (Figure 5). We conclude from this similarity that the
6
Note that this necessarily excludes the last treated federal state of Baden-Wuerttemberg from our estimation.
10negative slope in cases after the end of summer breaks is no artifact of heterogeneous dynamic
treatment effects.
Subgroup analyses. We explore in how far the evolution of cases in single states is driving
our results. To do this, we run our main specification 16 times, excluding each state one by
one. The results are summarized in Figures A.5–A.9. Patterns remain almost identical when
single states are excluded, providing support for homogeneous treatment effects over states.
No single state appears to drive our result as an outlier.
We further estimate Equation (1) for systematic distinctions of states into subgroups
(Figures A.10–A.14). We first estimate effects separately among states with early and late
summer breaks. Average results are mainly driven by early states. States with late summer
breaks show a similar post-treatment pattern as states with early summer breaks. Yet, they dis-
play a negative pre-trend indicating that late re-opening states already experienced decreasing
case numbers before the summer break. Accordingly, the trend break surrounding the school
re-opening is less distinct.
We further run subgroup analyses separately for East and West Germany. East German
counties, which constitute just 19 percent of the sample, were later and far less severely
hit by the pandemic. In addition, East German states are characterized by a lower level of
urbanization and population density. Up to late summer, cases remained below West German
levels (compare Figure 3). In line with low case numbers, separate regressions show that results
are entirely driven by West German states.
Overall, we conclude from the robustness checks and subgroup analyses that the found
pattern is primarily driven by West German states and states with early summer breaks. Het-
erogeneous treatment effects and changes in mobility patterns do not explain the pattern of
a robust negative effect of the end of summer breaks which makes us confident that indeed
re-opening schools is the main contributor to the found effect pattern. No robustness check
or subgroup analysis points to any positive effect of the end of school breaks and associated
school re-openings on the number of confirmed cases.
116 Plausible mechanisms
The negative effect of the end of summer breaks and associated school re-openings on the
number of confirmed cases may run counter to established priors and contradicts media reports
on individual and partial school closures due to detected cases after the re-opening. In the
following, we set our results into perspective by discussing the counterfactual situation and
by presenting additional information on changes in mobility patterns surrounding the end of
summer breaks. We further discuss mechanisms of altered parental behavior which potentially
explain our results.
The counterfactual situation. Comprehensive school closures were viewed as a drastic but
necessary non-pharmaceutical intervention to effectively slow down the spread of SARS-CoV-2
at the very beginning of the epidemic in Germany around mid-March 2020. Several pieces
of evidence indicate that school closures played a significant role in reducing infection rates
(Auger et al., 2020; Stage et al., 2020; Jackson et al., 2013). Yet, this evidence does not
necessarily contradict the reported negative effects of school re-openings as the counterfactual
situations differ strongly.
School closures were effective against the counterfactual situation of keeping schools
open during the early period of exponential growth in new case numbers in March and April
2020. Up until the comprehensive school closures in mid-March, schools had operated without
any hygiene concept, mask-wearing was not yet established, testing was restricted to symp-
tomatic cases only and daily case numbers were substantially higher than the average case
numbers in July and August (see Figure 1).
The re-openings after the summer breaks in August and September 2020, which are the
setting for this study, do not represent the flip side of the coin of the school closures during
March and April. They differ with respect to at least two dimensions. First, case numbers
decreased strongly during the early summer months, and levels of community spread were very
low during the time of the re-opening. Yet at the same time, compliance and agreement with
social distance measures decreased strongly. In a recurring representative survey of the German
population’s perception of risks from the new type of coronavirus, 79 percent of respondents
reported that they meet family and friends less frequently and 73 percent stated to leave
their home less often in early June. These numbers reduced to 60 percent and 51 percent
respectively in mid-September even though over this period a constant share of respondents
(around 60 percent) perceived the risk of infection through proximity to other people as high or
12very high.7 Consequently, private gatherings and also traveling became important risk factors
for the spread of the virus.8
Second, schools provided a very different environment after re-opening in August and
September in comparison to the time before they were closed down in mid-March 2020. Knowl-
edge about the characteristics of the novel coronavirus and successful measures to prevent or
at least minimize its spread had diffused widely among both policymakers and the population.
This has led to the strict hygiene measures described in Section 2. In addition, decentralized
quarantine measures were put in place following clearly established guidelines.
Changes in parental behavior. A second related mechanism likely at play works through
parental opportunity costs of children staying at home due to an infection. During summer
breaks, child care through schools was not an option, and corona-like symptoms of children
did not necessarily affect a child’s care situation.
After school re-openings, most children were back in full-day child care through schools
and after-school care. Children with corona-related symptoms were prohibited from attending
school until recovery, or at least until a negative test result is received. Thus, opportunity costs
of a child’s respiratory infection (not necessarily by COVID-19) increased strongly with the end
of the summer breaks. We argue that this change in opportunity costs led to behavioral changes
among parents which resulted in more careful social distancing than during the summer breaks.
Travel returnees. During the summer, Germany had comparably low infection numbers (see
Figure 1). Travel returnees from abroad were among the main sources of new infections at the
end of summer breaks. During July, about one third of all new cases had been infected abroad
(Robert Koch Institute, 2020). Mandatory testing of travel returnees from at-risk areas was
in place at all major airports in Germany. Returnees from at-risk areas were quarantined on a
mandatory basis for 14 days.
Higher case numbers among travel returnees would be able to partially explain our
result pattern, yet would not be related to school re-openings per se. There are four pieces
of evidence that make us confident that our pattern is not driven by travel returnees. First,
travel returnees with school-aged children tend to return gradually over the holiday season, not
7
See BfR Corona MONITOR, 15.-16. September, https://www.bfr.bund.de/cm/343/
200915-bfr-corona-monitor.pdf (last accessed: 25 September 2020).
8
See Daily Situation Report of the Robert Koch Institute, https://www.rki.de/DE/Content/
InfAZ/N/Neuartiges_Coronavirus/Situationsberichte/Sept_2020/2020-09-24-en.pdf?__blob=
publicationFile (last accessed: 25 September 2020).
13necessarily concentrated at the end of the school holidays. The observed gradually changing
mobility patterns depicted in Figures A.1 and A.2 corroborate this gradual return of returnees.
Thus, the estimated effect of the end of school breaks is unlikely driven by a coinciding spike of
holiday returnees before the end of summer breaks. Second, flat pre-trends depicted in Figures
4 and 5 show that control and treatment states experienced similar developments in case
numbers before the summer break. Increasing numbers of positively-tested holiday returnees
towards the end of summer breaks would instead imply increasing pre-trends. Third, holiday
returnees before school start would not be able to explain the gradual decrease in cases we
observe for younger age groups, but would indicate a sudden reduction in levels of new cases
after school re-openings. Finally, our results are also insensitive to the inclusion of mobility
controls. Existing variation in mobility measures, even if driven by holiday returnees, does not
explain the observed pattern of flat pre-trends followed by a decrease in case numbers. Taken
together, we are confident that our results are not driven by travel returnees.
7 Conclusions
In this paper, we estimate the effect of the end of summer breaks in Germany on the number of
new SARS-CoV-2 cases. We identify a causal effect of the end of summer breaks by exploiting
the staggered schedule of summer breaks across German federal states. We implement an
event study design using an event window of two weeks before and three weeks after the
summer breaks. Our results indicate over a large number of specifications, sub-group analyses
and robustness checks that the end of summer breaks is associated with a distinct decrease
in the number of SARS-CoV-2 cases. After three weeks following the end of summer breaks,
cases per 100K population have decreased by 0.55 cases per 100K population or 27 percent
of a standard deviation. We show that changes in mobility patterns do not contribute to this
pattern. Our findings indicate that school re-openings under strict hygiene measures as well
as quarantine and containment measures functioned well after the summer breaks in Germany
and reduced the risk of larger outbreaks in schools. Changes in parental behavior due to higher
opportunity costs of children in quarantine might be an important mechanism at play.
We acknowledge two caveats of the analysis. First, in terms of external validity, one has
to keep in mind the specific counterfactual situation described in Section 6. Schools re-opened
during a time of in general low infection rates and cannot be interpreted as the flip side of
school closures during the peak of the pandemic. In particular, the increasingly accelerating
number of new infections in the overall population during September and October 2020 may
14increase the risk of more infections among students. Second, schools re-opened after the
summer breaks in August and September when weather conditions (warm temperatures and
little precipitation) were favorable for outdoor activities and ventilation of classrooms. These
conditions may be hampered by colder temperatures and worse weather conditions in the fall
and therefore facilitate outbreaks in schools.
Having these caveats in mind, our paper provides first causal evidence of the absence of
an increase of cases after school re-openings at the end of summer breaks. This absence of an
increase stands in stark contrast to raised concerns about arising hotspots and super-spreading
events in schools which dominate debates about school re-openings world-wide. Given the high
immediate and longer-run human capital costs of school closures, our results should be taken
seriously in re-evaluating the cost-benefit considerations of moving back to on-site schooling.
Doing so requires careful designs of hygiene measures, but blueprints are readily available
(Levinson et al., 2020; Leopoldina, 2020; Stephenson, 2020). Given the still scarce evidence
on the effect of school closures, countries that have not opened schools yet should consider
the opportunity to do so in a controlled way allowing researchers to rigorously evaluate effects
on transmissions.
15References
Apolloni, A., Poletto, C., and Colizza, V. (2013). Age-specific contacts and travel patterns in
the spatial spread of 2009 h1n1 influenza pandemic. BMC infectious diseases, 13(1):176.
Auger, K. A., Shah, S. S., Richardson, T., Hartley, D., Hall, M., Warniment, A., Timmons, K.,
Bosse, D., Ferris, S. A., Brady, P. W., et al. (2020). Association between statewide school
closure and covid-19 incidence and mortality in the US. JAMA.
Callaway, B. and Sant’Anna, P. H. (2019). Difference-in-differences with multiple time periods.
Available at SSRN 3148250.
Chu, Y., Wu, Z., Ji, J., Sun, J., Sun, X., Qin, G., Qin, J., Xiao, Z., Ren, J., Qin, D., et al.
(2017). Effects of school breaks on influenza-like illness incidence in a temperate Chinese
region: An ecological study from 2008 to 2015. BMJ open, 7(3).
de Chaisemartin, C. and D’Haultfoeuille, X. (2020). Two-way fixed effects estimators with
heterogeneous treatment effects. American Economic Review, 110(9):2964–96.
De Luca, G., Van Kerckhove, K., Coletti, P., Poletto, C., Bossuyt, N., Hens, N., and Colizza, V.
(2018). The impact of regular school closure on seasonal influenza epidemics: A data-driven
spatial transmission model for Belgium. BMC infectious diseases, 18(1):1–16.
Eames, K. T., Tilston, N. L., Brooks-Pollock, E., and Edmunds, W. J. (2012). Measured
dynamic social contact patterns explain the spread of h1n1v influenza. PLoS Comput Biol,
8(3).
Fontanet, A., Grant, R., Tondeur, L., Madec, Y., Grzelak, L., Cailleau, I., Ungeheuer, M.-N.,
Renaudat, C., Pellerin, S. F., Kuhmel, L., et al. (2020). Sars-cov-2 infection in primary
schools in northern France: A retrospective cohort study in an area of high transmission.
medRxiv.
Fuchs-Schündeln, N., Krueger, D., Ludwig, A., and Popova, I. (2020). The long-term dis-
tributional and welfare effects of covid-19 school closures. Working Paper 27773, National
Bureau of Economic Research.
Goodman-Bacon, A. (2018). Difference-in-differences with variation in treatment timing. Tech-
nical report, National Bureau of Economic Research.
Heavey, L., Casey, G., Kelly, C., Kelly, D., and McDarby, G. (2020). No evidence of secondary
transmission of covid-19 from children attending school in Ireland, 2020. Eurosurveillance,
25(21).
Jackson, C., Vynnycky, E., Hawker, J., Olowokure, B., and Mangtani, P. (2013). School
closures and influenza: Systematic review of epidemiological studies. BMJ open, 3(2).
Kultusministerkonferenz (2020). Rahmen für aktualisierte Infektionsschutz- und
Hygienemaßnahmen (Beschluss der Kultusministerkonferenz vom 14.07.2020).
https://www.kmk.org/fileadmin/Dateien/veroeffentlichungen_beschluesse/
2020/2020_07_14-Infektionsschutz-Hygienemassnahmen.pdf (last accessed: 25
September 2020).
Leopoldina (2020). 5. Ad-Hoc-Stellungnahme Coronavirus-Pandemie: Für ein krisenresistentes
Bildungssystem. Technical report, Leopoldina - Nationale Akademie der Wissenschaften.
16Levinson, M., Cevik, M., and Lipsitch, M. (2020). Reopening primary schools during the
pandemic. New England Journal of Medicine, 383(10):981–985.
Macartney, K., Quinn, H. E., Pillsbury, A. J., Koirala, A., Deng, L., Winkler, N., Katelaris,
A. L., O’Sullivan, M. V., Dalton, C., Wood, N., et al. (2020). Transmission of sars-cov-2 in
Australian educational settings: A prospective cohort study. The Lancet Child & Adolescent
Health.
Robert Koch Institute (2020). Coronavirus desease 2019 (covid-19) daily situation report of
the Robert Koch Institute Oct. 4th 2020.
Schmidheiny, K. and Siegloch, S. (2019). On Event Study Designs and Distributed-Lag Models:
Equivalence, Generalization and Practical Implications. CESifo Working Paper Series 7481,
CESifo.
Stage, H. B., Shingleton, J., Ghosh, S., Scarabel, F., Pellis, L., and Finnie, T. (2020). Shut
and re-open: The role of schools in the spread of covid-19 in Europe. arXiv preprint
arXiv:2006.14158.
Stein-Zamir, C., Abramson, N., Shoob, H., Libal, E., Bitan, M., Cardash, T., Cayam, R.,
and Miskin, I. (2020). A large covid-19 outbreak in a high school 10 days after schools’
reopening, Israel, May 2020. Eurosurveillance, 25(29).
Stephenson, J. (2020). National academies offers guidance on reopening schools amid covid-19
pandemic. In JAMA Health Forum, volume 1. American Medical Association.
Viner, R. M., Russell, S. J., Croker, H., Packer, J., Ward, J., Stansfield, C., Mytton, O., Bonell,
C., and Booy, R. (2020). School closure and management practices during coronavirus
outbreaks including covid-19: A rapid systematic review. The Lancet Child & Adolescent
Health.
Zhang, J., Litvinova, M., Liang, Y., Wang, Y., Wang, W., Zhao, S., Wu, Q., Merler, S.,
Viboud, C., Vespignani, A., et al. (2020). Changes in contact patterns shape the dynamics
of the covid-19 outbreak in China. Science, 368(6498):1481–1486.
17Figures
Figure 1: Timeline of COVID-19 Pandemic and School Closures and Openings in Germany
Note: This graph shows the evolution of the average number of new confirmed cases of SARS-CoV-2 infections over the
last seven days in Germany (solid line). The shaded areas describe the different phases of school closures and
re-openings in Germany. Source: RKI, own presentation.
18Figure 2: School Opening Dates after Summer Vacation 2020 in Germany
Note: This graph shows a map of German counties highlighting the counties in states by date of school opening after
summer vacation 2020. Counties (states) highlighted in dark gray start the new school year on the respective date,
while light gray indicates that they are still on summer vacation and medium gray indicates that they had already
re-opened schools at an earlier date. Schools re-openings: 3 August: Mecklenburg-Vorpommern, 6 August: Hamburg,
10 August: Schleswig-Holstein, Berlin, Brandenburg, 17 August: Hessia, Rhineland-Palatinate, and Saarland, 27
August: Lower Saxony, Bremen, and Saxony-Anhalt, 31 August: Saxony and Thuringa, 8 September: Bavaria, 14
September: Baden-Wuerttemberg. Source: KMK.
19Figure 3: Evolution of Cases by State around School Opening Dates
Note: This graph shows the evolution of confirmed cases over the last seven days over the observation period from
July 1 to October 5. Left and right panel show case numbers of early and late re-opening schools, respectively. Dashed
vertical lines indicate school opening dates. State abbreviations are Schleswig-Holstein (SH), Hamburg (HH), North
Rhine-Westphalia (NW), Hessia (HE), Rhineland-Palatinate (RP), Saarland (SL), Berlin (BE), Brandenburg (BB),
Mecklenburg-Vorpommern (MV), Lower Saxony (NI), Saxony (SN), Baden-Wuerttemberg (BW), Bavaria (BY),
Thuringa (TH), Bremen (HB), Saxony-Anhalt (ST). Source: RKI.
20Figure 4: The Effect of the End of Summer Breaks on Confirmed Cases
Note: This graph plots the point estimates (βˆτ , τ ∈ [−15, 22]) and corresponding 95% percent confidence intervals of
the event study model as defined in Equation (1). The dependent variable is the daily count of confirmed cases per
100K population per county. The vertical line at τ = 0 indicates the school opening. The regressions include fixed
effects on the county and day level. Standard errors are clustered at the federal state level.
21Figure 5: The Effect of the End of Summer Breaks on Confirmed Cases by Age Groups
Note: This graph plots the point estimates (βˆτ , τ ∈ [−15, 22]) and corresponding 95% percent confidence intervals of
the event study model as defined in Equation (1), separately estimated for age groups 0-14, 15-34, 35-59 and 60+. The
dependent variable is always the daily count of confirmed cases per 100K population per county and age group. The
vertical line at τ = 0 indicates the school opening. The regressions include fixed effects on the county and day level.
Standard errors are clustered at the federal state level.
22Tables
Table 1: Summary Statistics - confirmed cases of SARS-CoV-2 (by county and day)
Full Period Before School Opening After School Opening
Mean SD Mean SD Mean SD
Age Group
0-14 0.959 3.140 0.805 2.976 1.174 3.343
15-34 1.986 4.071 1.496 3.753 2.671 4.387
35-59 1.115 2.688 0.838 2.796 1.503 2.477
60+ 0.461 1.672 0.265 0.995 0.736 2.279
All Ages 1.114 2.026 0.827 1.912 1.515 2.111
Observations 31,118 18,143 12,974
Note: This table summarizes means and standard deviations of confirmed cases of SARS-CoV-2 normalized by 100K
population by county and age group. The full observation period covers 1 July – 5 October 2020.
Source: RKI and Statistical Office.
23A Appendix
Figure A.1: The Effect of the End of Summer Breaks on Mobility Patterns I
Note: This graph plots the point estimates (βˆτ , τ ∈ [−15, 22]) and corresponding 95% percent confidence intervals of
the event study model as defined in Equation (1). The dependent variables are the number of daily trips (in logs) within
and across county and state borders. Mobility is measured by mobile phone movements, based on commercial data by
Teralytics. The vertical line at τ = 0 indicates the school opening. The regressions include fixed effects on the county
and day level as well as state-specific day-of-the-week fixed effects. Standard errors are clustered at the federal state
level.
24Figure A.2: The Effect of the End of Summer Breaks on Mobility Patterns II
Note: This graph plots the point estimates (βˆτ , τ ∈ [−15, 22]) and corresponding 95% percent confidence intervals of
the event study model as defined in Equation (1). The dependent variables is the percentage change in mobility
compared to a baseline period. Mobility measures are based on Google Mobility Reports. The vertical line at τ = 0
indicates the school opening. The regressions include fixed effects on the state by day-of-the-week and day level.
Standard errors are clustered at the federal state level.
25Figure A.3: Accounting for Heterogeneous Treatment Effects
Note: This graph plots the point estimates (βˆτ , τ ∈ [−15, 22]) and corresponding 95% percent confidence intervals of
the event study model as defined in Equation (1) adjusted for heterogeneous treatment effects following
de Chaisemartin and D’Haultfoeuille (2020). The dependent variable is always the daily count of confirmed cases per
100K population per county and age group. The vertical line at τ = 0 indicates the school opening. The regressions
include fixed effects on the county and day level. Permutation-based standard errors based on 100 repetitions.
26Figure A.4: Number of Observations Underlying Treatment Effects in Figure A.3
Note: This graph plots the number of observations that underlie the point estimates in Figure A.3.
27Figure A.5: The Effect of the End of Summer Breaks on Confirmed Cases Leaving One State
Out
Note: This graph plots the point estimates (βˆτ , τ ∈ [−15, 22]) and corresponding 95% percent confidence intervals of
the event study model as defined in Equation (1). The dependent variable is always the daily count of confirmed cases
per 100K population per county and age group. The vertical line at τ = 0 indicates the school opening. The regressions
include fixed effects on the county and day level. Standard errors are clustered at the county level.
28Figure A.6: The Effect of the End of Summer Breaks on Confirmed Cases Leaving One State
Out
Note: This graph plots the point estimates (βˆτ , τ ∈ [−15, 22]) and corresponding 95% percent confidence intervals of
the event study model as defined in Equation (1). The dependent variable is always the daily count of confirmed cases
per 100K population per county and age group. The vertical line at τ = 0 indicates the school opening. The regressions
include fixed effects on the county and day level. Standard errors are clustered at the federal state level.
29Figure A.7: The Effect of the End of Summer Breaks on Confirmed Cases Leaving One State
Out
Note: This graph plots the point estimates (βˆτ , τ ∈ [−15, 22]) and corresponding 95% percent confidence intervals of
the event study model as defined in Equation (1). The dependent variable is always the daily count of confirmed cases
per 100K population per county and age group. The vertical line at τ = 0 indicates the school opening. The regressions
include fixed effects on the county and day level. Standard errors are clustered at the federal state level.
30Figure A.8: The Effect of the End of Summer Breaks on Confirmed Cases Leaving One State
Out
Note: This graph plots the point estimates (βˆτ , τ ∈ [−15, 22]) and corresponding 95% percent confidence intervals of
the event study model as defined in Equation (1). The dependent variable is always the daily count of confirmed cases
per 100K population per county and age group. The vertical line at τ = 0 indicates the school opening. The regressions
include fixed effects on the county and day level. Standard errors are clustered at the federal state level.
31Figure A.9: The Effect of the End of Summer Breaks on Confirmed Cases Leaving One State
Out
Note: This graph plots the point estimates (βˆτ , τ ∈ [−15, 22]) and corresponding 95% percent confidence intervals of
the event study model as defined in Equation (1). The dependent variable is always the daily count of confirmed cases
per 100K population per county and age group. The vertical line at τ = 0 indicates the school opening. The regressions
include fixed effects on the county and day level. Standard errors are clustered at the federal state level.
32Figure A.10: The Effect of the End of Summer Breaks on Confirmed Cases by Subgroups of
States
Note: This graph plots the point estimates (βˆτ , τ ∈ [−15, 22]) and corresponding 95% percent confidence intervals of
the event study model as defined in Equation (1). The dependent variable is always the daily count of confirmed cases
per 100K population per county and age group. The vertical line at τ = 0 indicates the school opening. The regressions
include fixed effects on the county and day level. Standard errors are clustered at the federal state level.
33You can also read