Homelessness in NYC Elementary Schools: Student Experiences and Educator Perspectives - NYU Steinhardt
←
→
Page content transcription
If your browser does not render page correctly, please read the page content below
Homelessness in NYC
Elementary Schools:
Student Experiences and Educator
Perspectives
By Kathryn Hill and Zitsi Mirakhur

                                     February 2019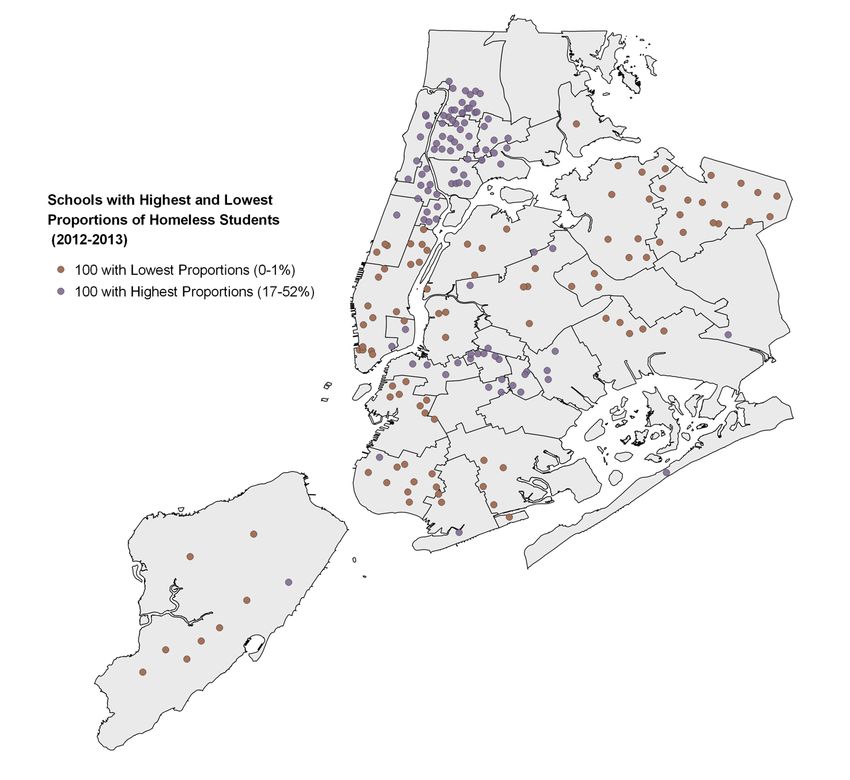
Steering Committee                                             Acknowledgements
Augusta Souza Kappner, Chair                                   We would like to thank our Research Alliance
President Emeritus, Bank Street College of Education           colleagues and mentors who supported and
                                                               advised this work. James Kemple, Adriana
Jennifer Jones Austin
                                                               Villavicencio, and Cheri Fancsali have been
Chief Executive Officer & Executive Director, Federation of
                                                               tireless advocates and sounding boards as this
Protestant Welfare Agencies                                    study has developed over the past year. Their
Mark Cannizzaro                                                feedback on numerous prior drafts of this work
President, Council of School Supervisors and Administrators    has been invaluable. Chelsea Farley and Kayla
                                                               Stewart always provide careful and thoughtful
Richard Carranza, ex-officio member                            reviews of our writing—and our thinking. As
Chancellor, New York City Department of Education              with much of the work we do at the Research
                                                               Alliance, the groundwork for this project was
Rudolph F. Crew                                                laid by our talented and hardworking team of
President, Medgar Evers College                                analysts. Linda Tigani coordinated our
Mark Dunetz
                                                               recruitment and helped organize school visits;
                                                               Jasmine Soltani, Patricia Chou, and Paulina
President, New Visions for Public Schools
                                                               Toro Isaza supported our work by maintaining
Katherine Fleming                                              the highest standards of data quality and
Provost, New York University                                   documentation.
                                                               We are grateful to Research Alliance Steering
Sister Paulette LoMonaco
                                                               Committee members who have provided
Executive Director, Good Shepherd Services
                                                               encouragement, asked tough questions, and
Félix Matos Rodriguez                                          given us valuable feedback over the past year.
President, Queens College                                      In particular, we thank Christina Collins and
                                                               Jennifer Jones Austin for their time and
James Merriman                                                 expertise in helping us develop our research
Chief Executive Officer, New York City Charter School Center   questions and make sense of emerging results.
                                                               Similarly, Kathy Marshall Polite, Lois Herrera,
Michael Mulgrew
                                                               Chris Caruso, Michelle Paladino, Mike Hickey,
President, United Federation of Teachers                       and others at the NYC Department of
                                                               Education were generous in sharing their time
                                                               and knowledge with us. We are also fortunate
Leadership Team                                                that working on this brief gave us an excuse to
James Kemple                                                   learn from Liza Pappas at the Independent
Executive Director                                             Budget Office.
Adriana Villavicencio                                          Finally, we extend a heartfelt thanks to the
Deputy Director                                                school and district staff who made time to
                                                               speak with us about how they serve this
Cheri Fancsali                                                 population of vulnerable students. We are
Research Director                                              inspired by the work they do and indebted to
                                                               them for lending us their insights and voices.
Chelsea Farley
Communications Director
                                                               ----------------------------------------------------
                                                               The research conducted as part of this series
About the Equity, Access and Diversity                         was supported by a generous grant from the
                                                               Walton Family Foundation.
Series
                                                               In addition, Research Alliance publications are
Launched in recognition of the Research Alliance’s 10th        supported by a small group of funders who
Anniversary, the Equity, Access and Diversity series is        underwrite our core operations, including
                                                               flexible research capacity, communications,
designed to illuminate important areas of progress as well     and public engagement efforts. These funders
as stubborn barriers to equity in NYC public schools.          include Carnegie Corporation of New York, the
Focused on some of the City’s most vulnerable students,        Ford Foundation, the Spencer Foundation, the
the series aims to examine the mechanisms driving              Wallace Foundation and the William T. Grant
educational inequality and identify promising strategies to    Foundation.
produce more equitable learning opportunities and              Our publications reflect the findings,
outcomes.                                                      interpretations and conclusions of the Research
                                                               Alliance and not necessarily those of our
                                                               funders or Steering Committee members.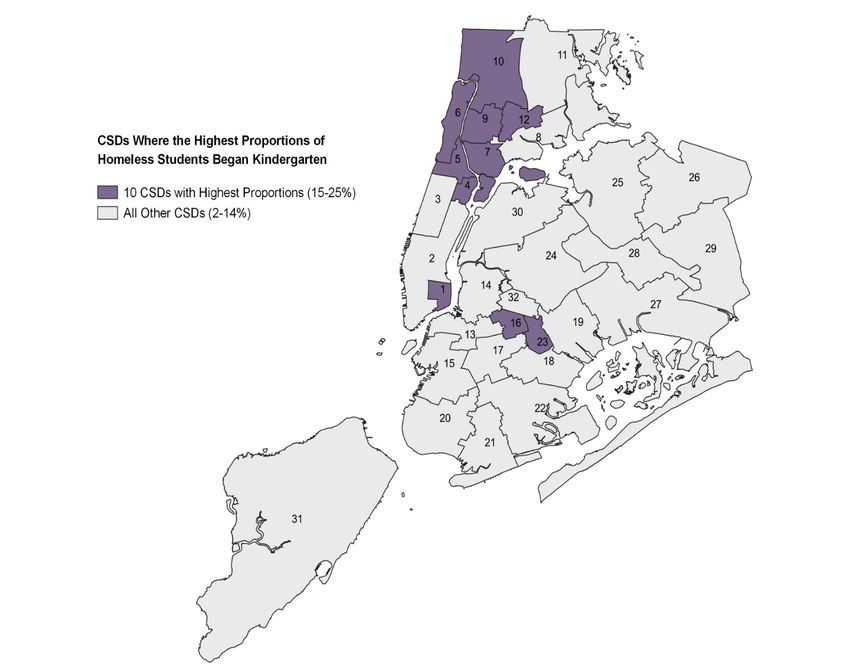
1
    Homelessness in NYC Elementary
    Schools:
    Student Experiences and Educator Perspectives

    The large and growing number of New York City students who lack stable housing
    has recently received much attention from advocates, researchers, educators, and
    policymakers. 1 Figure 1 below highlights not only that rates of homelessness have
    increased in recent years, but also that the problem is most prevalent among our
    youngest students. The percentage of middle and high schoolers in the district who
    experienced homelessness increased from about 5 percent in 2012 to a little over 7
    percent in 2017. Among elementary-aged students, the rate already stood at 7.5
    percent in 2012 and has since grown to more than 9.5 percent. Put another way,
    during the 2016-2017 school year, nearly one in ten New York City students
    who were enrolled in kindergarten through 5th grade experienced
    homelessness.

    Figure 1: Trends in Percentages of NYC Students Experiencing
    Homelessness, by Grade Level

                             100
                             90
                             80
                             70                                            Elementary        Middle and High School
       Percent of Students

                             60
                             50
                             40
                             30
                             20
                                                                  7.7                  9.3                  9.6
                                    7.5          7.4                                          6.6                 7.3
                             10           5.1          5.3              5.4

                              0
                                   2012-2013    2013-2014        2014-2015           2015-2016            2016-2017

      Source: Research Alliance calculations based on data obtained from the NYC Department of Education.
      Note: Figure includes all kindergarten through 12th grade students enrolled in NYC public schools in a given year.
      Total student enrollment varies by year and ranges from 943,592 to 987,331 students.
2   This means an extraordinarily large group of students (over 45,000 during that single
    school year) are experiencing instability at a young and developmentally important age. 2
    Driven to the homes of extended family or friends, shelters or hotels, or—in some cases,
    cars, tents, or the street—by eviction, domestic violence, overcrowding and other factors,
    these students arrive at their schools with heavy academic, social, and emotional burdens.
    Understanding the challenges these students face, and how their schools respond, is
    crucial, given that the elementary years serve as a foundation for long-term academic
    success. Our study starkly illuminates that—from the earliest grades—school teachers,
    counselors, and principals often find themselves on the frontlines in grappling with the
    consequences of larger societal inequalities.
    In this brief, we seek to better understand the experiences of NYC’s homeless elementary
    students and those who serve them at school. The second in our series on Equity, Access,
    and Diversity, this brief makes two important contributions to the existing research on
    student homelessness in our city. First, we explore the multiple ways in which young
    children experience homelessness by attending to differences in the type and duration of
    housing instability. Second, we highlight the challenges that schools face in serving large
    numbers of homeless students, as well as the practices that school staff say contribute to
    improving homeless students’ school experiences. We hope these findings can inform the
    design and implementation of future interventions that more effectively support this
    vulnerable population of students.
    Our study draws on the Research Alliance’s extensive archive of system-wide
    administrative data, as well as interviews with principals, teachers, and counselors in five
    elementary schools. The bulk of our quantitative analysis focuses on the cohort of students
    who began kindergarten in the fall of 2012, following them through the end of the 2016-
    2017 school year, when they should have been completing 4th grade. This approach allows
    us to develop a richer understanding of how students experience homelessness over time
    (versus annual snapshots of the proportion of students who are homeless in a given year).
    For our qualitative analyses, we identified a set of elementary schools where there were
    much higher proportions of students living in shelters than the Citywide average, but where
    those students had test scores and attendance rates that were similar to those of housed
    students across the City. We conducted fieldwork in five of these schools, consisting of
    interviews and focus groups with 18 school staff members, including principals, social
    workers, guidance counselors and classroom teachers. Additionally, we conducted
    interviews with four district officials tasked with supporting schools’ efforts to serve their
    homeless student population. Please refer to the Technical Appendix for more detailed
    information about our samples and analysis.
3
Measuring Homelessness in NYC
The NYC Department of Education (NYCDOE) identifies “students in temporary
housing” each academic year, as defined in the federal McKinney-Vento
Homeless Education Assistance Act. This includes those who are:
• Doubled up with another family or person because of housing loss or
economic hardship;
• Living in emergency or transitional shelters;
• Awaiting a foster care placement (refer to the Technical Appendix for more
details about this population);
• Living in a hotel or motel because they lack other housing, and are paying
for it themselves; and
• Living in “other temporary living situations,” including trailer parks,
campgrounds, and public places.
Our brief defines all of these students as “homeless,” but also presents some
analyses that distinguish between varying types of homelessness.
It is important to note that there are several difficulties in effectively identifying
homeless students. First, students’ housing status is generally self-reported by
parents or guardians when families move or when a student enrolls in a new
school. This likely means that some changes in residential status go unreported—
both when families become homeless and when they transition into permanent
housing. Second, within a given year, we do not know the length of time that
students are homeless. All students in our data archive are flagged as either being
in temporary housing, or permanently housed, during the school year, whether
they experienced housing instability for a few nights or for the entire period.
Relatedly, administrative records do not capture multiple forms of homelessness
within the same school year. So, for instance, if a student’s family was doubled up
and then moved into a shelter, our records would identify them as being “in
shelter” for that year.
Finally, our interviews with NYCDOE officials suggest that, during the past few
years, changes have been implemented to improve the quantity and quality of data
on student homelessness. For instance, in 2016, the DOE and the City’s
Department of Homeless Services altered their data-sharing agreement so the
DOE now receives daily (as opposed to monthly) rosters of students who are in
shelters. Relatedly, the DOE has encouraged schools to routinize the completion
of the Housing Questionnaire, which is how families report their residency status.
Thus, some portion of the increase in rates of homelessness (as shown in Figure
1) is probably due to improved data collection.
These data considerations are important to bear in mind while examining any work
focusing on student homelessness in NYC. Please refer to our Technical Appendix
for more details about the collection of data on student homelessness.4 Who Are New York City’s Homeless Elementary School
Students?
Of the 81,669 students who began kindergarten in the fall of 2012, 10,312 students—over
12 percent of the cohort—experienced homelessness at some point before their 5th
grade year. The number of students experiencing homelessness in this single cohort is
larger than the entire population of the vast majority of school districts in our country. 3
While there is very little systematically collected data on how families become homeless,
our interviews with educators highlighted a range of root causes, including high rents,
domestic violence, and issues relating to mental health or substance abuse. This generally
fits with prior research, which has found that families are increasingly entering the NYC
shelter system due to evictions and to escape domestic violence. 4
The characteristics of these students reflect larger, persistent and troubling inequalities
along racial and socio-economic lines. As Table 1 demonstrates, students who experienced
homelessness were disproportionately Black and Latino, and less likely to be White and
Asian. Perhaps unsurprisingly, students who experienced homelessness were consistently
economically vulnerable—with nearly two thirds qualifying for free or reduced price lunch
every year between kindergarten and 4th grade. 5 As other researchers have shown,
students who experience homelessness were also disproportionately more likely to be
identified as English Language Learners 6 or in need of special education services.
Table 1: Student Characteristics by Homelessness Status
Never
Homeless
Full Cohort Homeless
Students
Students
Race/ethnicity (%)
Asian 15.8 6.3 17.1
Black 24.8 32.7 23.7
Latino 41.0 56.1 38.9
White 16.1 3.5 18.0
Free or reduced price meals for 48.6 63.3 46.4
all five years a (%)
School services b (%)
Special education 22.6 28.9 21.7
English language learning 18.8 21.3 18.4
Sample size 81,669 10,312 71,357
Source: Research Alliance calculations based on data obtained from the NYC Department of Education.
Note: Table includes all students who enrolled in NYC public schools as kindergarteners in 2012 (N=81,669).
a
This measure captures students who qualified for free or reduced price meals every year for all five years that we followed
them.
b
We categorize students as receiving these services if they ever received them during the five years that we followed this
cohort.5 Students who experienced homelessness were not evenly distributed across community
school districts (CSDs) and schools in the City. Some CSDs and schools served much
higher concentrations of these vulnerable students. Figure 2A on the next page highlights
the top 10 districts where students in our cohort who ever experienced homelessness
began kindergarten in 2012-2013. 7 These students were concentrated in upper Manhattan,
central and western parts of the Bronx, and in northern Brooklyn. Remarkably, over 10
percent of all students who experienced homelessness began their kindergarten
year at schools in District 10 in the Bronx, which includes the neighborhoods of
Riverdale, Bedford, Fordham, Belmont, and Kingsbridge. The neighborhoods with the
highest proportions of homeless students map closely on to neighborhoods with the highest
levels of poverty, underscoring that homelessness among students is just one symptom of
deeply rooted economic inequality and concentrated poverty in the City. 8
Relatedly, Figure 2B on page 7 highlights the 100 elementary schools that had the highest
and lowest proportions of homeless students during the 2012-2013 school year, when the
students in our cohort were beginning kindergarten. Consistent with Figure 2A, schools with
the highest proportion of homeless students were located primarily in the Bronx and upper
Manhattan as well as northern Brooklyn. In these schools, students who experienced
homelessness made up between 17 and 52 percent of the student body. The 100 schools
with the lowest proportion of students who experienced homelessness were mostly located
in lower Manhattan, Staten Island, and Northern Queens. In these schools, homeless
students made up 1 percent or less of the student body; 12 of those schools had no
homeless students.
Equity, Access, and Diversity in NYC Schools:
Exploring Steady Progress and Stubborn Barriers
This brief is part of the Research Alliance’s Equity, Access, and Diversity
series, which aims to advance a better understanding of the mechanisms
driving educational inequality and to identify promising strategies to promote
more equitable learning opportunities and outcomes for NYC students. The
series focuses on students who are historically underserved and vulnerable to
challenges, both inside and outside of the classroom. The first study in the
series explored the outcomes and experiences of “persisting students”—that
is, those who do not graduate on time, but remain enrolled in a NYC high
school:
• Research Brief on Persisting Students
• Spotlight on NYC Schools Post: How Have the Rates at Which
Students Are Graduating in Four Years, Dropping Out, or “Persisting”
in NYC High Schools Changed Over Time?
Forthcoming work in the series will examine racial and socio-economic
segregation in NYC schools. We are also developing a study of middle school
students with disabilities in charter and traditional public schools.6 Figure 2A: Students Who Experience Homelessness Are Not Evenly Distributed
Across Community School Districts
Source: Research Alliance calculations based on data obtained from the NYC Department of Education.
Note: Calculations include all students who were enrolled as kindergarteners in the 2012-2013 school year
(N=81,669). Districts highlighted in purple are the top ten where students who ever experienced homelessness
began kindergarten (i.e., schools with the highest proportions of these students in the 2012-2013 school year).7 Figure 2B: Students Who Experience Homelessness Are Not Evenly Distributed
Across Elementary Schools
Source: Research Alliance calculations based on data obtained from the NYC Department of Education.
Note: Figure includes all schools that served exclusively kindergarten through 5th grade students and does not include charter,
District 75 or District 88 schools (N=647).8 What Are the Different Ways in Which Students Experience
Homelessness?
Our data allow us to examine two key dimensions along which students’ experiences of
homelessness vary—duration and type. In the cohort of students we follow, almost 70
percent of those who experienced homelessness did so for more than one year, and
more than a quarter were homeless for all five years. On average, students
experienced homelessness for just under three years. It is important to remember that
“duration” here refers to the number of academic years students were flagged as
experiencing homelessness—and students can be flagged after experiencing
homelessness anywhere from a few days to many months each year. Still, it remains
troubling that so many young children appear to have endured homelessness for extended
periods of time during their early years in school.
When we examined the types of homelessness students experienced, we found that a
large majority—over 90 percent of students who were ever homeless—experienced the
same form of homelessness from year to year. The most common experience of
homelessness was living doubled up with another family or another person—58 percent of
students experienced homelessness only in this form. An additional 30 percent of homeless
students were only in shelter. Just under 10 percent of students experienced multiple forms
of homelessness across years.
To better understand students’ experiences of homelessness, and the implications for their
outcomes, we divided the 10,312 students who experienced homelessness into four
groups. The groups were based on the type of homelessness students experienced and
whether they were homeless for more or less than the average duration (of three years). As
Figure 3 on the next page shows, 28 percent of homeless students were doubled up for
fewer than three years. Another 30 percent were doubled up for three or more years. 9 The
third and fourth groups include students who were either in shelter, experienced another
form of homelessness, or experienced multiple forms of homelessness. Since the vast
majority of these students (about 87 percent) were in shelters at some point, 10 we refer to
these two groups as being “in shelter.” The “shelter – fewer than three years” group
constitutes 24 percent of all homeless students. The remaining 19 percent were in shelters
(or experienced other or multiple forms of homelessness) for three years or more.
In our interviews with district staff, they highlighted differences in the experiences of
students who were doubled up relative to those who were in the shelter system. In general,
staff said that the shelter population is “needier” than the doubled up population. As
an official in the NYCDOE’s Office of Students in Temporary Housing noted,
“I find that the doubled up population tends to, actually, be more stable than the
shelter population. If you’re doubled up, that means you have some kind of support
system. You’re most likely working. Even if a parent is economically unstable, there
are other stable people in [students’] lives.”9 Figure 3: Elementary School Students Experience Homelessness in Different
Ways
Doubled Up -
Fewer Than
Three Years
18.6% Doubled Up -
28.4% Three Years or
More
Shelter - Fewer
23.6% Than Three
29.5% Years
Shelter - Three
Years or More
Source: Research Alliance calculations based on data obtained from the NYC Department of Education.
Note: Figure includes all students who experienced homelessness between kindergarten and the end of their
scheduled 4th grade year (N=10,312). The largest group (doubled up – three years or more) has 3,040
students; the smallest group (shelter - three years or more) consists of 1,915 students. The shelter groups
include students in shelter as well as those who experienced other or multiple forms of homelessness.
Percentages add up to more than 100% because of rounding.
Put differently, the fact that doubled up families are able to find a place to stay with family
or friends suggests they might have a social network to support them in times of crisis.
District staff we spoke with saw shelters as places that families go as a last resort.
Indeed, we found other evidence of meaningful differences between the four groups of
homeless students. As Table 2 on the next page shows, students who were doubled up
were disproportionately Asian or Latino, while students in shelters were
disproportionately Black. Students who were doubled up were more likely to be receiving
English language learning services at school. In contrast, students in shelters were less
likely to be English learners, but more likely to be receiving special education services.
White students were not only the least likely to experience homelessness—when they did,
it tended to be for shorter periods of time. As we would expect, longer-term homelessness
was associated with other signs of persistent poverty: More than 75 percent of students
who experienced homelessness for three or more years (whether doubled up or in shelters)
qualified for free or reduced price meals for all five years between kindergarten and 4th
grade. Students who were in shelter for three or more years—perhaps the neediest of
the four groups—were almost entirely (95%) Black or Latino. This underscores the
disproportionate impact of extreme poverty on NYC’s Black and Latino students.
The last set of findings in Table 2 focuses on students’ academic performance. Overall,
across the four groups, only about a quarter of homeless students attained proficiency on
state math and English tests in 4th grade, which was about half the rates of proficiency for10 students who were permanently housed. 11 Homeless students in doubled up settings were
more likely than those in shelters to achieve proficiency on these assessments. Students
who were in shelters for longer periods of time had the lowest scores—with less than 20
percent attaining proficiency on either test.
Table 2: Student Characteristics by Type and Duration of Homelessness
Doubled Doubled Shelter -
Up - Shelter -
All Up - Fewer
Fewer Three
Homeless Three Than
Than Years or
Students Years or Three
Three More
More Years
Years
Race/ethnicity (%)
Asian 6.3 9.2 8.8 3.4 1.8
Black 32.7 23.3 20.1 47.0 48.6
Latino 56.1 60.8 67.3 44.5 46.0
White 3.5 5.3 2.8 3.4 1.9
Free or reduced 63.3 46.5 83.0 50.0 74.8
price meals for all
five years a (%)
School services b
(%)
Special 28.9 22.7 24.3 33.2 40.1
education
English 21.3 27.3 31.4 10.6 9.9
language
learning
State test scores c
(%)
Proficient in 26.4 32.5 31.4 20.1 17.6
Math
Proficient in 28.8 34.3 34.1 23.6 18.9
English
Sample size 10,312 2,923 3,040 2,434 1,915
Source: Research Alliance calculations based on data obtained from the NYC Department of Education.
Note: Table includes all students who experienced homelessness between kindergarten and the end of their
scheduled 4th grade year (N=10,312). The shelter groups include students in shelter as well as those who
experienced other or multiple forms of homelessness.
a
This measure captures students who qualified for free or reduced price meals for all five years that we follow them.
b
We categorize students as receiving these services if they ever received them in the five years that we follow this
cohort.
c
This table highlights proficiency levels based on students' performance on their 4th grade tests. We are missing data
on test scores for approximately 20 percent of students who experienced homelessness; these students are excluded
from the denominator for this analysis.11 How Does Homelessness Disrupt Students’ Academic
Experiences?
Our interviews with school staff suggests that homeless students’ academic struggles are
partially a result of higher rates of school mobility. As Figure 4 shows, homeless students
in NYC changed schools more often than permanently housed students, with those
in shelters moving around the most. The average student who was in shelter for three or
more years changed schools at least once between kindergarten and 4th grade. Some of
these students changed schools seven times during this five-year span. 12
School mobility can be detrimental for children in the best of circumstances. But for many
families experiencing homelessness, these moves are sudden. Abrupt breaks to students’
relationships with their peers and teachers can be painful, and changing schools can be
disruptive to their educational progress and development. 13 Families who go into shelters
might be especially likely to move their children to new schools because they are often
placed in housing based on available space, and can end up living far away from their
original neighborhood and school. 14 This is troublesome because scholars have
demonstrated that such long-distance moves are particularly harmful to students’ academic
performance.
Figure 4: Students Who Experience Homelessness Move Schools Often
1.6
1.5
1.4
1.2
1.2
Number of School Moves
1.0 0.9
0.8
0.8
0.6 0.5
0.4 0.3
0.2
0.0
Never All Homeless Doubled Up - Doubled Up - Shelter - Fewer Shelter - Three
Homeless Fewer Than Three Years or Than Three Years or More
Three Years More Years
Source: Research Alliance calculations based on data obtained from the NYC Department of Education.
Note: Figure includes all students who experienced homelessness between kindergarten and the end of their scheduled
4th grade year (N=10,312). The largest group (doubled up – three years or more) has 3,040 students; the smallest group
(shelter – three years or more) consists of 1,915 students. The shelter groups include students in shelter as well as those
who experienced other or multiple forms of homelessness.12 A principal of a school in northern Brooklyn—where nearly half of the student body
is homeless—told us about how he believed that changing schools due to
homelessness had consequences for students’ academic preparedness:
“We have a lot of children who have been shuffled around. I call them my ping-pong
children, because they’re in one school, and another. It’s constantly back and forth
from school to school like a ping-pong, and they’re not getting that stable education.
When you get a child who has been in three or four different schools, and they’re
eight years old, it’s difficult to adequately educate (them)…,because you’re
constantly playing catch-up.”
Providing academic interventions for students who are highly mobile is challenging.
The principal told us that he had confidence in his staff’s ability to identify and
support students who have fallen behind academically through the use of strategies
such universal screening and targeted small group or individual instruction..
However, frequent school moves disrupt these attempts at intervention, with the
process beginning anew each time a student enters a different school. School staff
also reported difficulties in gaining and sharing information—beyond what is
reported in the district’s database—between schools when students moved. Such
information could be useful to counselors and classroom teachers as they try to
seamlessly incorporate newly enrolled students into their schools and classrooms.
Even when students experiencing homelessness do remain in their original school,
they struggle to maintain good attendance. As Figure 5 on the next page shows,
students who experienced homelessness had almost double the levels of chronic
absenteeism, between kindergarten and 4th grade, relative to students who did not
experience homelessness. Strikingly, over 80 percent of students who lived in
shelters for longer periods were chronically absent—meaning they missed about a
month of school—during one or more of the years between kindergarten and 4th
grade. 15
Attendance issues are driven, in part, by the long trips that students in shelter must
often take to and from school. A kindergarten teacher told us about one of her students,
whose family was suddenly moved from their shelter in Brooklyn to another in the Bronx.
The student’s mother wanted her to remain in this school, and so it took some time to sort
out busing, during which the student was absent. She said,
“What I see now is—when she comes to school—she’s five, and she’s sleepy. She’s
been on a bus since very early in the morning. I need to teach her how to write, read,
do math, but by a certain time, in about an hour, her gasoline tank is done. She gets
in a bad mood. She's grumpy. She starts not being able to cope. And then it’s time
to go home and get on the bus for the long ride again.”
Even though the district has made efforts to improve transportation options for students
who experience homelessness, including creating more bus routes and providing students
with free metro cards, transportation difficulties remain. Students may come in late, or miss
school altogether. And the long distances that some students must travel to stay in their
original school can impact their sleep patterns and thus their alertness in the classroom.13 Figure 5: Students Who Experience Homelessness Have High Rates of Chronic
Absenteeism
100
90
80.8
80 74.1
70
Percent of Students
58.8
60
48.4
50 42.6
40
32.2
30
20
10
0
Never All Homeless Doubled Up - Doubled Up - Shelter - Fewer Shelter - Three
Homeless Fewer Than Three Years or Than Three Years or More
Three Years More Years
Source: Research Alliance calculations based on data obtained from the NYC Department of Education.
Note: Figure includes all students who experienced homelessness between kindergarten and the end of their scheduled
4th grade year (N=10,312). The largest group (doubled up – three or more years) has 3,040 students; the smallest group
(shelter – three or more years) consists of 1,915 students. The shelter groups include students in shelter as well as those
who experienced other or multiple forms of homelessness. Students are classified as chronically absent if they were ever
chronically absent at any point between kindergarten and 4th grade—meaning they missed 20 or more days in a given
school year.
Educators emphasized how all of this disruption in student lives—both in school and
at home—can lead to social-emotional difficulties. Research has demonstrated that
students who experience homelessness are at greater risk of social and behavioral
problems, especially students who live in shelters. 16 As a school social worker told us,
“When there’s a major change in the family, children become very restless. They’re
going through all these changes, and they don’t have control over them. It may
present itself as behavior difficulties. In the classroom, they may become very
distracted, and get bad grades. Or they may become unusually quiet or even act
out—looking for attention and wanting to be helped by an adult.”
For families in shelter, the conditions can be particularly stressful. They may struggle to
maintain privacy, and parents are often overwhelmed with trying to meet immediate needs
for themselves and their children. Our interviews illuminated the emotional toll that living in
shelter can take on children—and how this may negatively impact their behavior in the
classroom, as well as their academic performance.14 What Does it Take for Schools to Serve Homeless Students?
Schools are one of the primary places where homeless children are identified, and where
families experiencing homelessness can be connected to information, services and
resources. 17 In fact, school districts are federally mandated to identify of students who are
experiencing homelessness, to work to eliminate barriers they face in attending school, and
to provide them with access to additional programming and resources. Because homeless
students are concentrated in particular schools (see Figure 2B on page 7), the burden of
serving them falls most heavily on those schools, which generally already have a high
concentration of needy students, and limited resources to support them.
To better understand how such schools serve homeless students, we spoke with staff in
five schools with particularly high concentrations of homeless students—two in the Bronx,
two in upper Manhattan, and one in northern Brooklyn. In the 2016-2017 school year, the
proportion of students who experienced homelessness in these schools ranged from 30
percent to nearly half of the overall student body—much higher than the 10 percent of
elementary-school-aged students who are homeless Citywide. These five schools had
particularly high proportions of students living in shelter, in part because they were located
near clusters of shelters that fed into the schools. While the proportion of elementary
school-aged students living in shelter was just over 4 percent in the 2016-2017 school year,
in these five schools, the proportion of students living in shelter ranged from 14 percent to
nearly a quarter. Below we discuss some of the challenges these schools face—as well as
strategies they are using to grapple with these obstacles and better support their homeless
students.
Going Above and Beyond to Coordinate Services
Our conversations with educators in these schools highlighted the lengths to which they
often go—devoting extra time and resources—to support families and students
experiencing homelessness. For example, in a school in Harlem where over 30 percent of
students were homeless, a school social worker talked about consoling families in crisis
and even accompanying parents to PATH, the office located in the Bronx, where families
must go if they need to apply for shelter. Educators told us that this level of personalized
attention and care is what it takes to effectively support homeless students and families, but
the volume of students who are in need makes it almost impossible to do consistently.
In particular, educators reported that it was often challenging to coordinate with
shelter-based staff, perhaps because those staff are also stretched very thin—having
to spend much of their time supporting families in crisis. As a DOE official, who oversees
the district efforts to support students experiencing homelessness across several CSDs,
told us,
“We just don’t have enough staff to do all of the work. There’s a lot of work to be
done. We have a bunch of hotel sites that we don’t even have enough staff to man.
We need more boots on the ground. We need more people engaging with the
families, day to day.”
As an example of this, a DOE family assistant, whose role is to serve as a liaison between
students in shelters and the staff at the schools they attend, estimated that she worked with15 over 100 students across multiple shelter sites. Even though she was based in Brooklyn,
she talked about traveling as far away as the Bronx to work with the schools that these
students attend. Given the number of students and schools that she worked with, it was
extremely challenging for her to routinely coordinate with staff at each school.
Identifying Students Experiencing Homelessness
Identifying homeless students can be a challenge for schools—especially when it comes to
students who are doubled up, because these families self-report their housing status. There
are many reasons why families may be reluctant to disclose their residential status to their
child’s school. As a district staff member who works with homeless students told us,
“Identifying [doubled up families] can be a challenge if they’re not forthcoming on
the Housing Questionnaire that the school asks parents to fill out. Sometimes they
are a little reluctant to share their housing situation for fear of judgement, or
because of external repercussions, be it governmental, or other things that they may
be wanting to not reveal. We try our best to connect them to services, as they’re
willing, and sometimes we even coach them that it’s actually in their best interest to
share.”
The school staff we spoke with tried various approaches to better identify students who
may be doubled up. Schools created routines and set aside time, so staff could discuss
which students might be experiencing problems and strategize about how to reach out to
families. Staff told us that they look for a few key warning signs that students might be
facing housing instability, including sudden changes in behavior, a lack of weather-
appropriate clothing, or poor attendance. However, school staff also noted that many of
their students who are not currently homeless but live in poverty have similar patterns of
behavior and needs.
School staff also talked about the importance of building relationships and trust with
families and students, and how this can help them be more aware of challenges students
are facing outside of school. When families trust school staff, they are more likely to
confide in them, including when they are having difficulties with housing. In fact, it is
through these conversations that families sometimes disclose their residency status.
Educators and district staff also report encouraging parents to provide any updates to the
Housing Questionnaire mid-year, such as during parent-teacher conference time, or
through “backpacking” the forms home with students. A social worker in a school in the
Bronx, where nearly half of the student body was homeless, explained to us that the time
he took to build relationships meant that parents would come to him if they needed support.
This Bronx social worker was part of the Bridging the Gap program, which, during the time
of our fieldwork, placed 44 social workers in schools across the City to support students
and families experiencing homelessness. Bridging the Gap social workers were placed in
schools with particularly high concentrations of students experiencing homelessness.
School staff we interviewed said that having a staff member who could fully devote their
time to supporting these students allowed schools to build stronger connections to families
and be aware of those who might be struggling with maintaining stable housing. These
social workers did outreach to families to ensure that Housing Questionnaires were up to
date and helped schools identify homeless students so that they could provide them with
support.16 Addressing Barriers to School Attendance
As we noted earlier, another barrier that schools face in serving homeless students is their
high levels of chronic absenteeism. Educators told us that regular school attendance was
important for students experiencing homelessness, not only because school is a place
where students learn—but also because they could access resources and supports and
experience regular classroom routines that provide welcome stability to students who are
facing uncertainty in their home lives.
Similar to the efforts schools undertook to identify students who were experiencing
homelessness, school staff created routines for examining attendance data and had
fixed meetings to strategize about how to respond when student attendance faltered.
Ideally, these meetings would include the principal, classroom teachers, parent coordinator,
attendance teacher, and DOE staff who are based in shelters. With time set aside to
analyze trends in attendance data, staff could work through ways to respond and offer
more systematic support. The principal from the school in Harlem talked about how keeping
track of both morning and afternoon attendance allowed her to notice that many students in
shelter were leaving school early. She realized that it was because some families in shelter
had to attend mandatory meetings with social service agencies that were scheduled during
the school day. She explained,
“It’s up to us, the school, to find those attendance trends, like students being picked
up at 12:30 three days a week, and then intervene. A lot of times, parents, they’ll say,
‘Well, that’s the appointment they gave me. I have no choice.’ It’s true. Then the
school has to step in and say to the agency, ‘You need to reschedule. They’re
missing two hours of instruction every Tuesday. Do it after school. Do it on a
Saturday.’ We have to advocate for our children and our parents that way.”
As this principal highlighted, for elementary school-aged students, preventing chronic
absenteeism involves working closely with families, as young students usually rely on their
parents to take them to school. Parents experiencing homelessness are often overwhelmed
with arranging childcare, dealing with social service agencies, and securing basic needs—
such as food, clothing and safety—for their children. Schools serving large numbers of
homeless students often find it challenging to support all of the families who might need
their help getting children to school—on top of the school’s usual instructional duties.
School staff who we interviewed said they often have to conduct outreach to families on
their own time. As one example a para-professorial, at a school where over a quarter of the
students lived in shelter told us about how she coordinated with families to pick up students
from nearby shelters, and walk them to school, so that they can arrive early enough to eat
breakfast.
Educators reported that having additional non-instructional staff who focus
specifically on homeless students enables schools to more effectively connect with
families and shelter staff and work together to improve attendance. One of the schools
in the Bronx that we visited was a community school, meaning that it had support from the
DOE to create a long-term partnership with a community-based organization (CBO). Much
of their partnership work was focused on preventing chronic absenteeism, and the principal
of that school noted how important the additional CBO staff had been for doing outreach to
families. The two Bridging the Gap social workers we interviewed also talked about how17 some of their time was devoted to visiting shelters and helping families address barriers to
school attendance.
Deciding How to Allocate Resources, Programs and Services
While schools can be an important place for students and families experiencing
homelessness to access support, the capacity of schools to provide these resources is
necessarily limited. Schools with high concentrations of needy students can easily become
over-extended. Schools are mandated to set aside a portion of their Title I funding—which
is meant to support all students in economic need—to provide services specifically for
homeless students. The schools we visited set aside these limited funds (only $100 per
student) to purchase additional school supplies and clothing for students, and to make sure
that students did not have to pay for school trips. This funding was not sufficient to hire
additional non-instructional staff who could devote all of their time to supporting homeless
students. Moreover, while educators understood that homeless students could benefit from
the additional resources they could secure with the set-aside funds, they noted that many
of their students who are not currently homeless, but are living in poverty might also be in
need of such support. As a principal in a school in the Bronx, where over 30 percent of the
student body experienced homelessness, told us,
“We do provide [homeless students] with the things they need as far as clothes and
shoes. We collect clothes. We have our own holiday Christmas, where they let them
go and take toys or whatever. Whatever we do, we try to not provide it under the
heading of ‘this is for the children that are homeless.’ It’s for our children. Because
many children who are not in shelters are in need.”
This principal, like many of the educators we spoke to, did not label resources as being
designated just for students experiencing homelessness. This was because they did not
wish to stigmatize these students, but also because they recognized that many of their
housed students might also be in need. Schools worked to make resources accessible
to as many needy families as possible, including—but not limited to—those
experiencing homelessness. For example, schools encouraged families to enroll their
children in afterschool programs, which in addition to academic support and mentorship
opportunities, often provided dinner. Combined with school breakfast and lunch, this could
guarantee three meals a day during the school week. Schools would also direct families to
resources in the community, including food banks and places to access mental health
services.
As noted, schools often relied on partnerships with CBOs, which increased their capacity to
support students and connect families with a web of external resources. The schools where
we conducted our fieldwork all had organizations that provided programming for students—
creating opportunities for students to build relationships with compassionate adults. School
staff believed that it was especially important for students experiencing homelessness to
have a caring and consistent adult presence in their lives, because, as one principal put it,
so little was consistent for them outside of school.
Notably, however, schools often built such partnerships in an ad hoc fashion, based
largely on the networking of principals and the connections of other staff. Several
principals noted that having institutional support could provide them with greater capacity to18 leverage community resources. The one community school in our study had a full-time
community school director who was based in the school building. The school’s principal
described this role as especially valuable for coordinating with other staff to bring in
relevant resources and make sure that they were well integrated with the work of the
school. These resources included academic and social supports—such as tutoring, arts
and mentoring programs, as well as health services and donations of clothing. In this case,
the partnership also provided additional staff who worked to develop supportive
relationships with students and assisted with family outreach. The principal noted that this
has allowed the school to become a place where—not just her students—but their families
and community members could all be connected to much needed services.
Questions Raised for Policy, Practice and Research
Taken together, our findings underscore that homelessness is not a uniform experience.
Students who are doubled up and in shelter appear to be rather distinct populations. The
length of time that students are homeless is also associated with different student
characteristics and outcomes. Our interviews with school and district staff highlight the
challenges inherent in serving these vulnerable students. As NYC works to improve
supports and services for homeless students and their families, it will be important to
grapple with four related questions:
What Information Do Schools Need to Better Serve Homeless Students?
Our findings highlight ways that additional information about homeless students’
experiences might be useful to educators. For example, while administrative records
contain some information about the types of homelessness that students experience (e.g.
doubled up, in shelter, etc.), they generally do not contain detailed information about how
long students have been homeless. Our study showed that students who live in shelters for
an extended period are especially vulnerable—four out of five of them were chronically
absent, and less than 20 percent scored proficient on state tests. Flagging “long-term
homeless” students could help educators target interventions to those who are particularly
high risk. Our findings suggest a need for better data systems—building on the data that is
already being collected by the DOE and the City’s Department of Homeless Services—as
well as new tools designed to make this information easily accessible to school staff .
School staff also emphasized the value of more qualitative information about students’
experiences that goes beyond what is captured in administrative records. This knowledge
is especially useful when students arrive at a new school. For example, data about student
trauma might help school social workers or counselors identify and better serve students in
need of support. Likewise, information about students’ prior instruction, routines, and
behavior might help classroom teachers be more effective. That being said, collecting,
organizing, and safeguarding such information would certainly present challenges. Who
would collect it, and how would it be stored? Would the current DOE database be
sufficient—or would a whole new system be needed to track this kind of data? Given the
sensitive nature of some of the information, how would the confidentiality of students and
their families be preserved? What kinds of data-sharing structures and practices are
needed to ensure that even highly mobile students are able to receive appropriate
instruction, care, and consistency across different schools?19 What Staffing Is Required to Meet Homeless Students’ Needs?
Our interviews with educators suggest that non-instructional staff can play a critical role in
building relationships with homeless students and families, addressing barriers to school
attendance, and connecting families and students to the resources and supports that they
need. The presence of non-instructional staff in a school building lessens the burden school
staff often face in helping so many students and families in crisis—allowing classroom
teachers to focus on instruction, guidance counselors to focus on providing mandated
academic support, and administrators to focus on providing high-quality leadership for the
entire school community. There is a lot to be learned about how schools can best leverage
the time and expertise of non-instructional staff. For instance, how many students should
each of these individuals be expected to serve? Should these staff be based at shelter
sites, or should they be based in schools? Are particular staff characteristics and training
associated with better outcomes for students and families? What routines, structures, and
conditions facilitate effective coordination between instructional and non-instructional staff?
How Should the District Deal with the Concentration of High-Needs Students
in Particular Schools?
Students who experience homelessness—and other students living in extreme poverty—
are not evenly distributed across NYC’s community school districts and schools.
Entrenched patterns of socio-economic and racial segregation mean that some schools are
being asked to serve very large numbers of disadvantaged children. Our interviews suggest
that this sometimes creates opportunities for targeted, intensive service provision, with
schools becoming a hub where students and families can connect with resources. Yet,
there is very likely a “tipping point” for schools, where the sheer number of students in need
becomes overwhelming and makes it impossible for school staff to serve them effectively.
Given the concentration of poverty in particular neighborhoods, what would it take to foster
more socio-economically diverse elementary schools? 18 And would this improve homeless
students’ access to support (because the schools are generally higher-performing and
better resourced), or reduce that access (because staff have less expertise in serving
homeless students or because services are no longer focused in one place)? Nascent
efforts to address racial and socio-economic segregation in NYC schools will need to be
attentive to these issues. Moreover, while the prevalence of homelessness currently varies
greatly across schools, we found that 98 percent of elementary schools in the City serve at
least some homeless students. It is likely that schools will need to employ different
strategies to serve students experiencing homelessness, depending on the concentration
of homeless students in the building.
How Can Schools Best Connect Students to External Resources and
Supports?
The findings in this brief highlight that schools are one of the primary places where
homeless students and their families can connect with resources and supports provided by
CBOs and social service agencies. All of the schools where we conducted interviews have
partnerships with local CBOs; however these partnerships took a wide variety of forms.
This underscores the need for better evidence about such partnerships, and their capacity
to improve school experiences and outcomes for homeless students. What does it take to
build sustainable and effective partnerships between schools, shelters, social service20 agencies, and other CBOs? What structures and routines encourage strong working
relationships between school and CBO staff? And do such partnerships actually keep
students engaged in school and improve their academic performance? Research that
identifies elements of effective partnerships that can be broadly replicated across schools—
and help make the most of the limited funding that schools have to serve homeless
students—could be immensely helpful to schools, districts, and CBOs.
Conclusion
This brief provides a glimpse into the barriers to school success that children who
experience homelessness face at a developmentally crucial age. It also highlights the
myriad challenges that school staff encounter as they work to support these vulnerable
students. Looking ahead, we hope to generate additional evidence about specific school
practices and district policies that can help more homeless students succeed. That said,
given the scope of the problem—with one in eight NYC students experiencing
homelessness by the end of fourth grade—our findings also raise questions about the role
of other institutions and systems, including efforts to prevent families from becoming
homeless in the first place.21
Endnotes
1 See, for example, Advocates for Children (2018), da Costa Nunez, R. et al. (2017), Pappas, L. (2016), and
Shapiro, E. (2018).
2 See Fantuzzo, J et al. (2013) and Herbers, J. et al. (2012).
3 As we have documented elsewhere, we can understand the magnitude of the NYC public school system by
comparing it to other large districts in the US. Please also see Table 1 in this report from the US
Department of Education.
4 See Hurley, K. (2017) and Brown, E. (2014).
5 Please note that this measure captures students who qualified for free or reduced price meals every year
for all five years that we followed them. Proportions of homeless students who qualified for free or reduced
price meals are higher if we look at yearly estimates (e.g., 98 percent of students who experienced
homelessness during the 2016-2017 school year were eligible for free or reduced price meals).
6 See Ralph da Costa Nunez, R. et al. (2018).
7 This means that some of the students who are included in this graph experienced homelessness after the
2012-2013 school year.
8 See Austensen, M. et al. (2016).
9 For research that has focused exclusively on understanding the experiences of doubled up students see,
for instance, Hallett, R.E. (2010).
10 Just over 70 percent of the students in the third and fourth groups were only in shelters for the duration of
their homelessness.
11 About 48 percent of housed students in this cohort attained proficiency on the math and English state tests
in 4th grade.
12 Deck, S.M. (2017) finds similar school mobility outcomes for students experiencing homelessness in
Jefferson County, Kentucky: Students who lived in shelters had higher rates of school mobility than those
who were doubled up or poor but permanently housed.
13 See Rumberger, R. (2015).
14 Even though students experiencing homelessness have the right to remain in their school of origin, and the
district must provide transportation for them to do so, some families might have to or choose to switch their
children into schools that are nearer to the shelter.
15 Deck, S.M. (2017) finds similar school attendance patterns in her analysis of students in the Jefferson
County Public Schools: Students who were in shelters had lower attendance rates than those who were
doubled-up or poor but permanently housed.
16 See Herbers, J.E. et al. (2014) and Brumley, B. et al. (2015).
17 See Ingram E.S. et al. (2017) and Miller, P.M. (2011).
18 See New York City Department of Education (2019).You can also read