HOUSING ACTION PLAN - SITUATION REPORT - JAN UARY 2014
←
→
Page content transcription
If your browser does not render page correctly, please read the page content below
H O U S I N G A C T I O N P L A N - S I T UAT I O N R E P O RT
                         JA N UA RY 2 0 1 4
                  Pre p ared by CitySpac es Co nsulting
TAB LE OF CONTE N TS

     EXECUTIVE SUMMARY
     I     INTRODUCTION                                                                               1
           OVERVIEW                                                                                   1
           PURPOSE OF A HOUSING ACTION PLAN                                                           1
           APPROACH                                                                                   2
           HOUSING CONTINUUM                                                                          3
     II COMMUNITY PROFILE                                                                             5
           POPULATION CHANGE                                                                          5
           HOUSEHOLDS & INCOMES                                                                       7
           CORE HOUSING NEED                                                                          7
           HOUSING SUPPLY                                                                             8
     III MARKET HOUSING                                                                               13
           HOUSING TENURE                                                                             13
           RENTAL HOUSING                                                                             13
     IV NON-MARKET HOUSING & HOMELESSNESS                                                             20
           NON-MARKET HOUSING                                                                         20
           HOMELESSNESS & AT-RISK POPULATIONS                                                         22
     V CONTEXT: LEGISLATION & POLICY                                                                  24
           FEDERAL ROLE                                                                               24
           PROVINCIAL ROLE                                                                            24
           METRO VANCOUVER                                                                            26
           DISTRICT OF MAPLE RIDGE                                                                    27
     APPENDICES                                                                                       32
     APPENDIX A - TERMS & DEFINITIONS                                                                 33
     APPENDIX B - DATA SOURCES & REFERENCES                                                           35

MA P LE R I DG E H O U S I N G ACTI O N P L AN - S i t u at i o n Re p o r t | Ja n u a r y 2 0 1 4        2
MA P LE R I DG E H O U S I N G ACTI O N P L AN - S i t u at i o n Re p o r t | Ja n u a r y 2 0 1 4 3
EXECUTIVE S UMMARY
T H E S I T UAT I O N R E P O RT
The purpose of this project is to produce a comprehensive Housing Action Plan, which will provide policy
direction and a guiding framework by which the District of Maple Ridge can take action towards a future
of housing that meets the needs of all members of its community. This Housing Action Plan is being
completed to fulfill the District of Maple Ridge’s Regional Context Statement requirements under the
Regional Growth Strategy and it may provide the basis for future amendments to Maple Ridge’s Official
Community Plan.

This Situation Report is the first of three documents to be prepared as part of this project. A Consultation
Report and Housing Action Plan will be completed as part of the next components of this project to be
undertaken in 2014. By presenting information and data on population and housing, this Situation Report
provides a community profile and housing overview for Maple Ridge. It presents information and data
compiled from a variety of different data sources, using the information that best represents the
geographic area that encompasses the District of Maple Ridge.

P O P U L AT I O N & H O U S I N G
•      According to the Population Census, Maple Ridge was home to 76,000 people living in 28,000
       dwellings in 2011. BC Stats estimates that the population will increase by 17 percent between 2011
       and 2021. During this ten year period, the number of children and youth are projected to decline by
       2 percent, while the over 65 population is anticipated to increase by 66 percent.

•      In 2011, according to Canada Mortgage and Housing Corporation, most seniors in Canada were living
       independently in private dwellings and, as the population ages, this will continue to have an impact
       on future housing occupancy demand in all areas of the country.

•      Compared to the Greater Vancouver region, Maple Ridge’s housing stock is predominantly ground-
       oriented, although the percentage of apartments among housing starts increased from 5 percent in
       2010 to 59 percent in 2012.1

•      Based on the 2011 National Household Survey conducted by Statistics Canada, households in Maple
       Ridge are predominantly owner-occupied (81 percent).

R E N TA L M A R K E T
•      In 2012, according to Canada Mortgage and Housing Corporation, there was a 4.6 percent vacancy in
       the purpose-built rental market in Maple Ridge and Pitt Meadows.2 Compared to Greater Vancouver,
       which had a 1.8 percent vacancy rate, the rental market in Maple Ridge and Pitt Meadows was not
       under as much pressure in 2012. Average rents for all unit types were also much lower — $827 in
       Maple Ridge and Pitt Meadows, and $1,058 in Greater Vancouver.

1   The terms Greater Vancouver and Metro Vancouver are used interchangeably throughout this report.

2   The purpose-built rental market information is available for the combined Maple Ridge and Pitt Meadows area.

MA P LE R I DG E H O U S I N G ACTI O N P L AN - S i t u at i o n Re p o r t | Ja n u a r y 2 0 1 4                1
• In Maple Ridge, as elsewhere, the average rents for rental units in the secondary market
(investor-owned condominiums or other rented units) were estimated to be higher than those in
purpose-built rental buildings. The exception is with basement suites, which tended to have the
lowest rents overall.3
• According to Canada Mortgage and Housing Corporation, seniors housing in Maple Ridge and Pitt
Meadows is generally more affordable than the regional average. The average rent for independent/
supportive living units is $2,250, which is significantly lower than the average rents in the Lower
Mainland which is $2,998.4
R E A L E STAT E P R I C E S
• According to the Greater Vancouver Real Estate Board, real estate prices in Maple Ridge are
considerably lower than those in the region. In 2012, the benchmark price in Maple Ridge was
$386,000 (all housing types), which is 52 percent lower than the benchmark in Greater Vancouver
($588,000). Since 2008, house prices have dropped by 6.3 percent overall, while Greater Vancouver’s
benchmark price increased by 6.2 percent over the same period.
• In 2012, the average price for a single detached house in the resale market in Maple Ridge was
$464,000, $273,000 for a townhouse, and $183,000 for an apartment.
H O U S I N G A F F O R DA B I L I T Y
• According to taxfiler-reported income data (presented by Statistics Canada), median incomes in
Maple Ridge in 2011 were higher than those in the region as a whole, with couple families earning
20 percent more than their counterpart in Greater Vancouver and single parents and one-person
households earning 4 percent more. At the same time, rents and house prices in 2011 and 2012 were
generally lower in Maple Ridge than in the region as a whole (as reported by Canada Mortgage and
Housing Corporation and the Greater Vancouver Real Estate Board).
• At an estimated 2012 median income of $91,000, a couple family (with or without children) has
the ability to purchase a house valued at $397,000 with a 10 percent downpayment or rent a home
for $2,300.5
• Under the same assumptions, lone parent families earning the median income ($41,500) could afford
a unit priced at $138,000. At that price point, there would be a limited selection of apartments or
mobile homes available. Lone parent families would have $1,040 available for rent (at 30% of their
income), which would likely be adequate for a two-bedroom unit in Maple Ridge.
3Secondary rental market information is based on a scan of rental listings undertaken by CitySpaces Consulting in September and
October, 2013.
4 The Lower Mainland includes all municipalities in the Greater Vancouver and Fraser Valley regional districts, as well as Squamish
from the Squamish Lillooet Regional District.
5 Median income refers to the midpoint of all household incomes, where one half of all households are earning below the median
income and the other half are earning more than the median income. The median income figures are based on 2011 taxfiler-
reported statistics presented by Statistics Canada and adjusted to 2012 based on BC average annual employment earnings.
MA P LE R I DG E H O U S I N G ACTI O N P L AN - S i t u at i o n Re p o r t | Ja n u a r y 2 0 1 4 2• Single persons earning the median income ($26,700) would have a very limited selection in the
Maple Ridge housing market. To enter home ownership, single person households would need a
higher downpayment or other financial assistance. In terms of rental opportunities, at 30 percent of
their income, single person households would be restricted to renting a place at $670 unless they
were able to spend a greater share of their income on rent or find shared accommodation.
NON-MARKET HOUSING & HOMELESSNESS
• According to BC Housing, Maple Ridge has approximately 585 units in non-market housing plus
42 funded temporary beds in shelters and safe houses. In addition to this stock of units, there were
511 rent supplements made available to individuals and households living throughout Maple Ridge
in 2013.
• In 2011, there were 110 homeless people counted in Maple Ridge and Pitt Meadows as part of the
Metro Vancouver Homeless Count. Since 2008, the number of homeless individuals counted in this
area increased by 22%, whereas for Metro Vancouver the number of homeless people experienced
very little change. Compared to the 2008, there was a small reduction in the adult homeless
population counted in Maple Ridge, but this was offset by an increase in the number of homeless
youth. The increase in the number of homeless youth may be attributed, in part, to improvements in
how homeless youth are counted.
MA P LE R I DG E H O U S I N G ACTI O N P L AN - S i t u at i o n Re p o r t | Ja n u a r y 2 0 1 4 3I I N TRO D U C TI O N
OVERVI EW
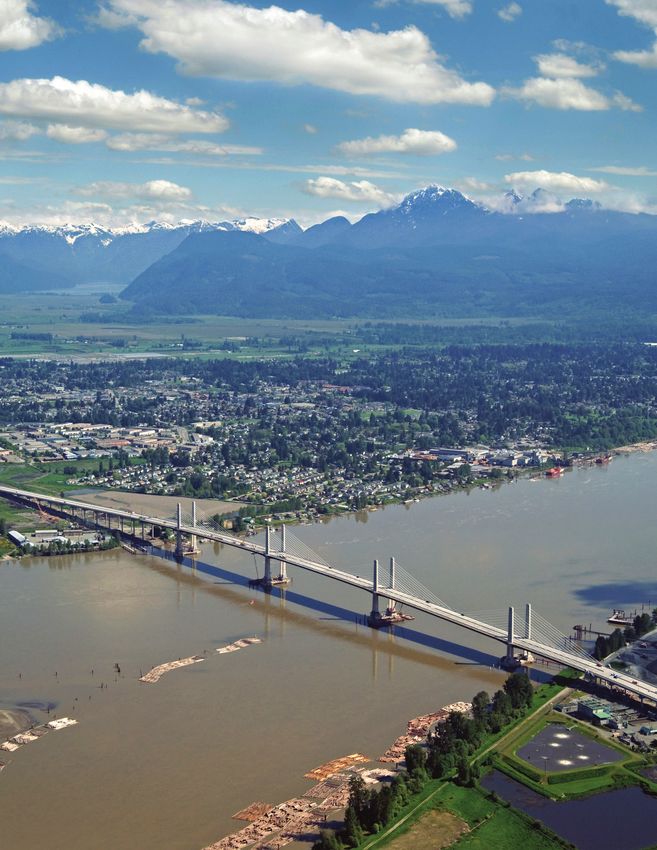
A healthy and sustainable city is one in which every resident has access to affordable and appropriate
housing. According to the recent 2011 Census data, Maple Ridge has approximately 76,000 people living
in 28,000 dwellings. By 2021, according to BC Stats, the District is expected to add another 16,000
people, almost half of whom will be above the age of 65. The District of Maple Ridge commissioned
CitySpaces Consulting to prepare a Housing Action Plan (HAP) that would respond to the changing needs
of Maple Ridge’s current and future residents. The Housing Action Plan will provide policy direction and a
guiding framework by which the municipality can take action towards a future of housing that meets the
needs of all members of its community.
PURPOSE OF A HOUSING ACTION PLAN
Metro Vancouver’s Regional Growth Strategy requires all municipalities to provide diverse and affordable
housing choices. As part of their role, municipalities are required to:
a) Adopt regional context statements which include policies and strategies that indicate how the
municipality will meet the estimated future housing demand between 2011 and 2021; and
b) Prepare and implement Housing Action Plans.6
Housing Action Plans can assist municipalities to achieve their housing goals by:
a) Assessing local conditions;
b) Identifying housing policies and priorities; and
c) Detailing strategic actions and approaches that use the resources and tools available to local
government to encourage the development of affordable housing.
The tools that are within a municipality’s jurisdiction to implement may include land use and zoning
regulations; and advocacy and partnership with other levels of government, non-profit organizations, the
private sector, and other agencies. Once endorsed by Council, a Housing Action Plan would provide the
District with a strategy document that the District can quickly reference with respect to future policy
formation and decision-making.
6Housing demand in Maple Ridge was estimated to be 6,600 units, including 4,300 ownership and 2,300 rental units. Among the
estimated rental units, 74 percent would respond to the demand for affordable rental units and 26 percent would be market rentals.
MA P LE R I DG E H O U S I N G ACTI O N P L AN - S i t u at i o n Re p o r t | Ja n u a r y 2 0 1 4 1APPROACH
The purpose of this project is to produce a comprehensive Housing Action Plan, which clearly outlines the
District’s immediate and longer-term goals for housing. When endorsed, the Housing Action Plan will
guide decision-making related to market and non-market housing in the District of Maple Ridge for many
years to come. The Housing Action Plan project consists of three major components:
1. THE SITUATION REPORT (Fall 2013) — Assessing the housing context in Maple Ridge by identifying
and analyzing key housing data and relevant information.
2. CONSULTATION REPORT (Winter 2014) — A series of workshops, a community questionnaire, and
additional engagement approaches to identify gaps in the housing continuum and identify issues
affecting specific population groups, such as seniors, youth or young families.
3. HOUSING ACTION PLAN REPORT (Spring/Summer 2014) — In response to the issues and gaps
identified in earlier stages, a toolbox of policies and approaches will be recommended and an
implementation plan will be prepared that outlines short, medium and longer term actions.
FIGURE 1.1: Outline of Housing Action Plan Project - Components & Reports
REVIEW OF
STATISTICS & POLICY SITUATION REPORT
DOCUMENTS
ONLINE
& STAKEHOLDER CONSULTATION
POP-UP WORKSHOPS REPORT
QUESTIONNAIRE
IDENTIFY GAPS IN PREPARING TOOLBOX
DRAFT HOUSING FINAL HOUSING
HOUSING OF POLICIES &
CONTINUUM
ACTION PLAN ACTION PLAN
STRATEGIES
MA P LE R I DG E H O U S I N G ACTI O N P L AN - S i t u at i o n Re p o r t | Ja n u a r y 2 0 1 4 2This Situation Report is the first of three reports prepared as part of this project (Figure 1.1). It presents
information and data compiled from a variety of different data sources. In addition to information
provided directly by the District of Maple Ridge (e.g. registered secondary suites or building permits),
additional data from Statistics Canada, Canada Mortgage and Housing Corporation (CMHC), BC Housing,
and others are presented. Where possible, the information is presented for the geographic area that
encompasses the District of Maple Ridge, but this level of geography is not consistently available.
Occasionally, the information is only available for the Ridge-Meadows geography, which includes the City
of Pitt Meadows, or for a larger sub area of the Metro Vancouver region. Where it is relevant, Metro
Vancouver as a whole is used as a benchmark or comparison.
HOUSI NG CONTI N UUM
The housing continuum is a visual concept used to describe and categorize different types of housing.
On the non-market end of the continuum (the left) are emergency shelters and transitional or supportive
housing, which represent a temporary and less stable housing form. These housing forms typically
involve various levels of support services and often require the most public funding.
Towards the middle of the continuum is non-market housing for households that do not require support
services, both in dedicated buildings or in the private market by way of rent supplements. Below-market
ownership bridges between the non-market and market segments and is represented by different
options that support low and moderate income households to get into the homeownership market.
Lastly, on the market end of the continuum (the right), are rental and ownership housing available
through the private market. Implicitly, the continuum suggests that residents should have the
opportunity to move across the housing continuum and find housing that is most appropriate and best
suited to their needs and circumstances.
HOUSING CONTINUUM
TEMPORARY LONG-TERM
RENT
BELOW
EMERGENCY TRANSITIONAL INDEPENDENT SUPPLEMENTS HOME
MARKET RENTAL
SHELTERS & SUPPORTIVE LOW INCOME IN MARKET OWNERSHIP
OWNERSHIP
RENTALS
NON-MARKET MARKET
Maple Ridge’s Housing Action Plan will provide an overview of the complete continuum of housing in the
District, including affordable home ownership, market rental housing for low and moderate income
households, and non-market housing for low-income households and for groups that require supportive
RENT
or special needs housing.
EMERGENCY The Plan INDEPENDENT
TRANSITIONAL will identify priority issues, make
SUPPLEMENTS
BELOWrecommendations for municipal
HOME
MARKET RENTAL
SHELTERS & SUPPORTIVE LOW INCOME IN MARKET OWNERSHIP
actions, and recommend actions for other groups and agencies.
RENTALS
OWNERSHIP
RENT
BELOW
EMERGENCY TRANSITIONAL INDEPENDENT SUPPLEMENTS HOME
MARKET RENTAL
SHELTERS & SUPPORTIVE LOW INCOME IN MARKET OWNERSHIP
OWNERSHIP
MA P LE R I DG E H O U S I N G ACTI O N P L AN - S i t u at i o n Re pRENTALS
o r t | Ja n u a r y 2 0 1 4 3
RENT
BELOW
EMERGENCY TRANSITIONAL INDEPENDENT SUPPLEMENTS HOME
MARKET RENTALThe District of Maple Ridge has already made great strides towards understanding the housing needs of the community and responding to urgent housing challenges. The District has been exploring tools to increase affordable rental housing, and has been actively involved in community initiatives that explore issues of homelessness, housing affordability, and housing suitability. The HAP will build on the housing work that has already been completed by the District, focusing on identifying housing issues along the entire housing continuum. MA P LE R I DG E H O U S I N G ACTI O N P L AN - S i t u at i o n Re p o r t | Ja n u a r y 2 0 1 4 4
II          COM MU N I T Y PROF I LE
The Community Profile section includes an overview of key statistics and demographic information
including population change, household income, and housing supply. This will set the stage for key
housing information, providing some context and overview of the situation in Maple Ridge.

P O P U L AT I O N C H A N G E
According to Statistics Canada, there were 76,052 people in Maple Ridge in 2011, an increase of 20
percent since 2001. Between 2001 and 2011, the population grew by almost 2 percent a year, at a faster
rate than the Greater Vancouver region, which grew by 16 percent overall at a rate of 1.5 percent per year
during this period.

Compared to Greater Vancouver, Maple Ridge has a relatively younger population. In 2011, there was a
greater share of the population under 14 years of age and slightly greater share of 15 to 24 year olds and
45 to 64 year olds. The most typical person in Maple Ridge in 2011 was 40 years old (median age)
compared to ten years previous when the most common age was 37 years.

FIGURE 2.1: Population by Age, 2011 (Statistics Canada)

                                                                 30%
                                                    29%                  29%
                                            26%

   18%
           15%
                       14% 13%
                                                                                             12%
                                                                                      11%

                                                                                                      2%   2%
      0-14                15-24                25-44                45-64               65-84          85+

                          Maple Ridge                                  Greater Vancouver

In the ten year period between 2001 and 2011, Maple Ridge saw a decline in the share of the population
that is in the 45 to 64 age group (from 32% to 26%) and among children under 14 years (from 22% to
18%). The declines in these two groups indicate a drop in the share of the population made up of families
with young children. This is supported by recent declines in school enrollment figures (9% decline in ten
years). By contrast, the Baby Boomer cohort (45 to 64 years olds) increased proportionally from 23
percent to 30 percent, while senior age groups increased as well.

MA P LE R I DG E H O U S I N G ACTI O N P L AN - S i t u at i o n Re p o r t | Ja n u a r y 2 0 1 4             5
FIGURE 2.2: Population Change by Age, 2001-2011 (Statistics Canada)
32% 30%
26%
22% 23%
18%
14%
13%
10% 11%
1% 2%
0-14 15-24 25-44 45-64 65-84 85+
2001 2011
BC Stats prepares annual population projections for local health area (LHA) regions including the Maple
Ridge LHA.7 According to BC Stats’ 2013 projections, the population in the Maple Ridge LHA is expected to
add 16,000 people and increase by 17 percent (1.6% per year) between 2011 and 2021 — at a slightly
faster rate then it had in the previous ten years. It is also expected to grow at a slightly faster pace than
the region as a whole (16% and 1.5% per year). During this time period, the population is expected to age
considerably, which will have important implications for future housing demand.
FIGURE 2.3: Population Estimates by Age, 2011-2021 (BC Stats)
30%
28% 28%
27%
18%
16%
14% 15%
11% 11%
2% 2%
0-14 15-24 25-44 45-64 65-84 85+
2011 2021 Estimate
Between 2011 and 2021, not only is the population under 25 expected to make up a smaller share of the
population (27% in 2021 compared to 32% in 2011), the number of children and youth under 25 are
projected to decline by 2 percent, a loss of approximately 700 children and youth over this time period. In
contrast, the over 65 groups will increase from 12 percent in 2011 to 17 percent of the population by
2021, adding approximately 7,600 people. By 2021, it is estimated that there will be more than 19,000
people in Maple Ridge over the age of 65.
7 Local Health Areas (LHAs) are geographic regions used for analytical purposes. They have no administrative function. Instead,
they aggregate up to Health Service Delivery Areas and Health Authorities. The Maple Ridge local health area corresponds to the
municipal boundaries of both the District of Maple Ridge and the City of Pitt Meadows. It is within the Fraser Health Authority.
MA P LE R I DG E H O U S I N G ACTI O N P L AN - S i t u at i o n Re p o r t | Ja n u a r y 2 0 1 4 6HOUSEHOLDS & I NCOMES
The majority of households in Maple Ridge consist of families (67.5%), including couple families with or
without children (57.5%) and lone parent families (10%). The remaining one third of households in the
Districts consists of single person households (33%), compared to 38 percent in Greater Vancouver as
a whole. 8
TABLE 2.1: Median Income by Household Types
Med ian In co me
H ou s eh o ld Type N u m be r
2 0 11 20 1 2 Esti m ate
Couple Families 18,200 $89,530 $91,137
Lone Parent Families 3,070 $40,720 $41,534
One Person Households 10,380 $26,150 $26,673
Source: Statistics Canada. 2011. Annual Estimates for Census Families and Individuals. Based on taxfiler-
reported figures. 2012 estimates based on adjustments reflecting BC average weekly wage rates (BC Stats).
Household income, when compared to house prices, is often used to determine what a typical household
can afford to rent or purchase in a community. In Maple Ridge, the median income shows considerable
variation in terms of potential housing choice among households. In 2012, the median income of couple
families was approximately $91,100, which would offer considerably more choice in the housing market
compared to single parents earning the median income ($41,500) or single persons ($26,700).9 Median
incomes in Maple Ridge are generally higher than those in the region as a whole, with couple families
earning 20 percent more than their counterpart in Greater Vancouver and lone parents and one-person
households earning 4 percent more.
CORE HOUSI NG N EED
In 2012, the BC Non-Profit Housing Association published a report that provided 10 and 25 year
projections for rental housing demand and core housing need in Greater Vancouver. The study
estimated that 16 percent of all households in Greater Vancouver were in core housing need in 2011.10
Renter households had a greater likelihood of being in core housing need than owner households —
28 percent of renter households were estimated to be in core housing need compared to 9 percent of
owner households.
8 Couple families refer to couples living together (whether married or common-law) at the same address and any children living at
the same address.
9 The median household income represents the midpoint of all household incomes. In other words, half of all households are earning
less than the median household income, while the other half are earning more.
10A household is said to be in core housing need if its housing falls below at least one of the adequacy, affordability or suitability
standards and it would have to spend 30% or more of its total before-tax income to pay the median rent of local housing that is
acceptable.
MA P LE R I DG E H O U S I N G ACTI O N P L AN - S i t u at i o n Re p o r t | Ja n u a r y 2 0 1 4 7Based on a scenario where the tenure split (owners to renters) does not change, the study projected that
the number of households in core housing need would increase by 22 percent between 2011 and 2021,
adding a total of 33,504 households in core housing need in the Greater Vancouver region. It is
anticipated that the increase in renter households in core housing need will be highest among seniors
because this age group had the highest incidence of core housing need and the number of seniors is
expected to increase into the future.
H O U S I N G S U P P LY
DWELLI NG TYPES
Compared to the region, Maple Ridge’s housing stock is predominantly ground oriented with 84 percent
of all units in this form. This includes single detached homes as well other multi-unit housing such as
duplexes and townhouses. The remaining stock consists of apartments (16%), largely in low-rise
apartment buildings of four storeys or less. While Greater Vancouver’s houses are predominantly ground
oriented as well, there is a greater proportion of units in apartment structures (40%).
TABLE 2.2: Structure Type
D wel l in g Ty p e Numb er %
Single Detached 16,650 59%
Other Ground-Oriented 6,900 25%
ApartmentsFIGURE 2.4: Dwelling Type 2011-2021 (BC Stats)
84%
60%
40%
16%
Maple Ridge Greater Vancouver
Ground Oriented Apartments
H O U S I N G STA RT S
Unlike Greater Vancouver where new construction was dominated by apartments (61%) between 2010
and 2012, Maple Ridge’s housing starts during this period continued to see a large proportion of single
detached units come on stream (49%).
FIGURE 2.5: Housing Starts, Maple Ridge and GVRD, 2010-2012 (CMHC)
100%
29% 61%
80%
60% 23%
40% 49%
17%
20%
22%
0%
Maple Ridge Greater Vancouver
Single Detached Duplex and Row Apartment
Overall, Maple Ridge had an average number of 480 new starts between 2010 and 2012, with small
incremental increases in the number of starts each year. In the past ten years, the share of new single
detached housing dropped considerably from 90 percent of all new construction in Maple Ridge in
2002 to 37 percent in 2012. Construction of semi-detached or duplex housing remained a very small
portion of housing starts, while row housing fluctuated marginally up and down over these years. There
were no apartment starts in 2002 or 2003 compared to 49 percent of new construction in the 2010 to
2012 period.
MA P LE R I DG E H O U S I N G ACTI O N P L AN - S i t u at i o n Re p o r t | Ja n u a r y 2 0 1 4 9FIGURE 2.6: Housing Starts, Maple Ridge, 2010-2012 (CMHC)
500
21 81
400
134 308
300 154
200 23
284
100 225 193
0
2010 2011 2012
Single Detached Duplex Row Apartments
Housing starts for Maple Ridge in 2012 indicate an increase in the construction of apartment units, with
308 apartment units anticipated to be coming on stream. However, given the number of apartment
starts in 2010 and 2011 (21 and 81 respectively), this is not yet evidence of a consistent shift in the
pattern of new development, with the greatest share of construction continuing to be in ground-
oriented housing forms in both those years.
The majority of new starts in Maple Ridge consisted of freehold (48%) and condominium (48%) units,
although a small proportion were intended to be rental housing (4%). By comparison, new construction in
Greater Vancouver saw the largest share of the units in condominiums (59%) and freehold (33%), but also
eight percent of new units were purpose-built as rentals (8%).
MA P LE R I DG E H O U S I N G ACTI O N P L AN - S i t u at i o n Re p o r t | Ja n u a r y 2 0 1 4 10NEIGHBOURHOODS
While the predominant housing form in Maple Ridge has been, and remains, ground-oriented, current
trends in new homes and neighbourhood development have seen an increase in more compact forms
(townhomes, small lot single-detached, and semi-detached or duplex housing). For example:
ALBION AREA
The prevalent housing form in Albion is single family detached housing with lot sizes between 2,300 and 4,000
square feet.
EAST OF ALBION AREA HAMMOND
Large lot/rural residential and estate suburban forms. Mature neighbourhood made up mainly of single
family homes on small to mid-sized lots, including
many heritage homes.
MA P LE R I DG E H O U S I N G ACTI O N P L AN - S i t u at i o n Re p o r t | Ja n u a r y 2 0 1 4 11COTTONWOOD VILLAGE SILVER VALLEY
Medium density, strata-titled townhome development. A mix of single family, semi-detached homes,
and townhomes, set in a clustered neighbourhood
layout.
TOWN CENTRE / HANEY
The Town Centre / Haney neighbourhood is home to a number of medium to higher density apartment buildings.
Apartments in Maple Ridge are located for the most part in the Town Centre and adjacent areas. The
Town Centre Area Plan and associated incentives have sought to increase development and densities in
this area, and have in recent years helped to increase the number of new apartment buildings being built
in this area. Since the program was launched in January 2011, 495 residential units were constructed and
an additional 366 units are currently in the project pipeline.
MA P LE R I DG E H O U S I N G ACTI O N P L AN - S i t u at i o n Re p o r t | Ja n u a r y 2 0 1 4 12I I I MAR KE T HOUS I NG
HOUSING TENURE
The 2011 tenure data is based on the National Household Survey, a voluntary survey. This information
had previously been collected as part of the mandatory long form survey of the census. As a result, the
two data sets cannot be directly compared without some caution. In 2011, households in Maple Ridge
were largely owner-occupied (81%), which is markedly higher than the share of owner-occupied
households in the region as a whole. Assuming that there are no data-related inconsistencies, this would
reflect little or no change in the percentage of households that are renting versus owning.
TABLE 3.1: Housing Tenure, 2011
M a p le Ri dge Gre ater Van co uver
H ou s eh o l d Ty p e
# % %
Owner Households 22,590 81% 65.5%
Renter Households 5,450 19% 34.5%
Source: Statistics Canada. 2011. National Household Survey.
According to the National Household Survey, 71 percent of owner households in Maple Ridge were
carrying a mortgage on their home in 2011, while 29 percent had no mortgage debt. A larger share of
owner households in Greater Vancouver (41%) were free of mortgage debt.
R E N TA L H O U S I N G
P U R P O S E - B U I LT R E N TA L B U I L D I N G S
According to CMHC, there were 1,523 purpose-built rental units in Maple Ridge in 2012, mostly in one
and two bedroom units (91%).11 This reflects a loss of 21 units since 2010 (a 1.4% decline). In contrast,
there were 559 units added to the purpose-built stock in Greater Vancouver in that three year period
(0.5% increase). The vacancy rate for purpose-built rental units in Maple Ridge increased slightly between
2010 and 2012, on average.
The total vacancy rate for Maple Ridge/Pitt Meadows in 2010 was 3.2 percent, while in 2012 this rate was
4.6 percent. While the increases in vacancy rates show that there is less pressure on the rental market,
the two and three bedroom units both had vacancies of less than 4 percent. The region as a whole had a
total vacancy rate of 1.8 percent — where the two and three bedroom units had vacancy rates over 2
percent and the studios and one-bedrooms under 2 percent.
11 Purpose-built rentals include apartment and townhouse complexes with three or more rented units.
MA P LE R I DG E H O U S I N G ACTI O N P L AN - S i t u at i o n Re p o r t | Ja n u a r y 2 0 1 4 13TABLE 3.2: Purpose-Built Rental Units, 2012
A pa r t m en t s & M a pl e R id ge / Pi tt Mead ows Gre at er Van cou ver
Tow n h o u s es # Vacancy R at e %
Studios 15 ** 1.1%
1 Bedrooms 840 5.8% 1.7%
2 Bedrooms 539 3.4% 2.4%
3 Bedrooms+ 129 3.1% 2.5%
Total 1,523 4.6% 1.8%
Source: CMHC Market Rental Reports
In 2012, the average rent in Maple Ridge/Pitt Meadows for units in purpose-built rental buildings was
$827. Average rents ranged from as low as $671 for a studio unit to as high as $1,224 for larger units of
three bedrooms or more. Compared to Greater Vancouver, rents are considerably lower in Maple Ridge
and Pitt Meadows, between $195 less for a studio unit and $345 less for a two-bedroom. Since 2010,
rents increased by an average of 3.4 percent per year (6.8% overall) in Maple Ridge and Pitt Meadows.
TABLE 3.3: Average Rents, Purpose-Built Rental Units, 2012
M a pl e R i dge / Pi t t
Apa r t m en t s & Tow n h o u se s Greater Vancouver
M eadows
Studios $671 $866
1 Bedrooms $709 $982
2 Bedrooms $922 $1,267
3 Bedrooms+ $1,224 $1,471
Total $827 $1,058
Source: CMHC Market Rental Reports
S E CO N DA RY R E N TA L M A R K E T
In Maple Ridge, as elsewhere, the average rents for rental units in the secondary market tend to be
higher than for purpose-built rental units, which are typically found in older buildings. In addition to the
survey of purpose-built rentals, Canada Mortgage and Housing Corporation undertakes a survey of
investor-owned condominiums and of other secondary rented units, such as secondary suites,
townhouses, duplexes, and houses in the private rental market. The sample sizes of these surveys do not
allow for them to include sub-regional level data and the data is only available on a region-wide basis.
MA P LE R I DG E H O U S I N G ACTI O N P L AN - S i t u at i o n Re p o r t | Ja n u a r y 2 0 1 4 14Rented condominium units in Greater Vancouver have had consistently low vacancy rates — 1.0 percent
in 2012, which is an increase from the 2.2 percent vacancy in 2010. Throughout the region, 26 percent of
all condominium units were rented.
Average rent for an investor-owned condominium was $1,499 ($1,299 for a one bedroom and $1,662 for
a two bedroom), which is 100% more than average rents in the purpose-built stock. By contrast, average
rents in the investor-owned rental market, not including condominiums (i.e. houses and basement
suites), more closely approximate rents in the purpose-built stock. In fact, one and two bedroom suites in
houses tend to rent for less than one and two bedrooms in the purpose-built stock.
TABLE 3.4: Average Rents, Secondary Market, Greater Vancouver, 2012
Un it Ty p e 1 B e d ro om s 2 B ed roo ms 3 B ed ro oms Total
Condo Units $1,299 $1,662 ** $1,499
Single Detached $934 $1,321 $1,820 $1,743
Semi-detached, Row,
** $1,138 $1,337 $1,150
Duplex
Other and Accessory
$764 $924 $1,429 $963
Suites
Source: CMHC Market Rental Reports
To supplement the data sources above, a scan of rental listings in various rental consumer sources
(e.g., Classified ads, Craigslist, etc.) was undertaken in September and October 2013. It presents a brief
snapshot of the cost of renting in Maple Ridge and provides an indication of what types of units that
were available. There were a total of 116 separate listings counted during a two week period. Based on
this rental snapshot, it can be estimated that the average rent for secondary market units in Maple Ridge
was $1,257.
TABLE 3.5: Secondary Market Listings by Number of Bedrooms, Maple Ridge, Fall 2013
Ren t s 1 Bd r ms 2 Bdrms 3 B drm s 4+ Bd rms Total
Average $834 $1,083 $1,655 $1,883 $1,257
Median $800 $1,025 $1,663 $1,800 $1,199
Number of Units 34 36 28 17 115
Source: Listings from Craigslist, Kijiji, Maple Ridge News, and Maple Ridge Times, September/October 2013
The available rental units were listed for as low as $818 on average for a one bedroom unit to as high as
$1,883 for units of 4 or more bedrooms. Rents for one and two bedroom units were listed for
approximately 17 percent more than a purpose-built rental. Units of three or more bedrooms were listed
for considerably more than those in the purpose-built stock, but those in the secondary market likely
MA P LE R I DG E H O U S I N G ACTI O N P L AN - S i t u at i o n Re p o r t | Ja n u a r y 2 0 1 4 15reflect larger houses and townhouses, which could not be reasonably compared to purpose-built units.
There were only two studio units available during the snapshot and these were excluded from the
summary in Table 3.4 due to the small number.
TABLE 3.6: Secondary Market Listings by Unit Type, Fall 2013
S ui te in
Ren t s A p a r t m en t s Town ho us e House
H ouse
Average $984 $865 $1,407 $1,776
Median $900 $825 $1,345 $1,790
Number of Units 38 28 14 37
Source: Listings from Craigslist, Kijiji, Maple Ridge News, and Maple Ridge Times, September/October 2013
When categorized by the type of unit, it can be noted that suites in houses in Maple Ridge appear to rent
for less than apartment units at an average of $865 per month. Just over half of the listings were in
apartments and suites in houses, while the remaining units were in townhouses and houses.
SENIORS’ RESIDENCES
CMHC distinguishes three broad types of seniors’ collective housing: independent living units, assisted
units, and heavy care. In its 2013 Seniors Housing Report for British Columbia, CMHC reports that, while
collective dwellings tend to be better equipped to provide the types of care needed by seniors as they
age, most seniors in Canada prefer to live in private dwellings rather than in any type of group setting.
• INDEPENDENT & SUPPORTIVE LIVING - Independent and
supportive living units are for seniors who can live WHERE ARE
independently, but need or want assistance in day to day SENIORS LIVING?
activities. In 2013, the average rent for independent and
supportive living units in Maple Ridge and Pitt Meadows • In Canada, 97% of seniors
is $2,250, which is notably lower than the Lower between 65 and 84, and 70%
Mainland average at $2,998. In 2011, average rent for of seniors over 85, live
these units in Maple Ridge and Pitt Meadows was independently in private
$2,461, which is 33% higher than the average rent in dwellings.
2013. Correspondingly, vacancy rates for these units
have also fallen over this period. In 2011, the vacancy • For those living in seniors
housing (collective dwellings),
rate was almost 30 percent, while in 2013 the rate
one third live independently in
was 19.5 percent.
seniors-specific housing with
• ASSISTED LIVING - Assisted living services, include little or no health care or
housing, hospitality services and one or two personal support, and two thirds are in
assistance services, such as assistance with daily living housing with heavy, long-term
activities or medication services. In the Fraser North care and support.
area, which includes Maple Ridge, there are a total of
587 assisted living units, 47 percent provided by non-
profit operators and 53 percent offered by for-profit
MA P LE R I DG E H O U S I N G ACTI O N P L AN - S i t u at i o n Re p o r t | Ja n u a r y 2 0 1 4 16providers.12 In the Lower Mainland as a whole, 55 percent of assisted living units are provided by
non-profits, while 45 percent are part of for-profit enterprises.13
• HEAVY CARE UNITS - In heavy care units, residents pay a premium to receive high-level care (1.5
hours or more of care per day) with health, mobility, or other issues that impede an individual’s
ability to live independently. As of 2013, the Fraser North area had 613 heavy care units, with a
vacancy rate of 0.8 percent. This vacancy rate includes both market and non-market units.
PRICE OF NEW HOUSING
According to sales listing data presented by the Greater Vancouver Real Estate Board, the benchmark
housing price (this includes all housing types) in Maple Ridge for 2013 was $385,800. This represents a
1.1 percent increase from 2012. However, over the previous five years, the benchmark price fell by 6.3
percent. By comparison, the benchmark price in Greater Vancouver as a whole increased by over 6.2
percent in five years. Prices for resale units in Maple Ridge are considerably lower than the regional
benchmarks — 52 percent or $200,000 less than the region.
TABLE 3.7: Benchmark Sale Prices, 2012
Map l e R i dge
Hou s eh ol d Typ e 1 Ye ar 3 Ye ar 5 Ye ar
$
Chan ge Chan ge C han ge
Maple Ridge $385,800 1.1% -2.6% -6.3%
Greater Vancouver $588,100 -2.8% 4.7% 6.2%
Source: Greater Vancouver Real Estate Board.
Note: The benchmark prices do not include pre-sales for units under construction
12 The Fraser North Area also includes Pitt Meadows, Burnaby, New Westminster, and the TriCities.
13 CMHC does not report on vacancy rates for seniors’ assisted living units.
MA P LE R I DG E H O U S I N G ACTI O N P L AN - S i t u at i o n Re p o r t | Ja n u a r y 2 0 1 4 17Prices for all housing types — detached, townhouse, and apartment — increased each year from 2005 to
2008, after which prices dipped down to pre-2007 levels in 2009. The following year, there was a small
price recovery that has since led to a plateau of prices that has lasted until today. In 2013, the average
price of a single detached house on the resale market was $464,000, $273,000 for a townhouse, and
$183,000 for an apartment.
Figure 3.1: Average Resale Prices, 2005-2013 (GVREB)
$500,000
$463,942
$420,000
$340,000
$273,417
$260,000
$182,750
$180,000
$100,000
2005 2006 2007 2008 2009 2010 2011 2012
Detached Townhouse Apartment
H O U S I N G A F F O R DA B I L I T Y
Given the median income for various household types, it is possible to estimate how much various
households have available for either housing purchase or rental. At a median income estimated at
$91,000, a couple family (with or without children) will typically have the greatest choice in the housing
market, depending on their debts and assets. At current rates, a couple family earning the median income
would be able to purchase a house valued at $397,000 with a 10 percent downpayment. In Maple Ridge,
this income would be just short of what is needed to buy the average-priced single detached house at
$464,000. However, single detached houses at less than average prices could be attainable. Also,
households that have more than ten percent downpayment would be able to purchase a single detached
house. It would be especially achievable for a couple household earning the median income to buy an
average priced townhouse (at $273,000) and build up equity in their home for a few years before moving
up the market over time.
Single parent families earning the median income ($41,534), have less than half the income of couple
family households and therefore can afford a unit that is priced at no more than $138,000. At ten percent
downpayment, there are only a few apartment units or mobile homes that would be available for
purchase at this price. Single persons have the least choice in the housing market, with the ability of an
individual earning the median income of $26,673 to purchase a place valued at no more than $64,000.
Other than a mobile home, there would be no opportunity at that median income level for a single
person to get into the ownership market in Maple Ridge, without a higher downpayment or other
financial assistance.
MA P LE R I DG E H O U S I N G ACTI O N P L AN - S i t u at i o n Re p o r t | Ja n u a r y 2 0 1 4 18TABLE 3.8: Purchase Price Estimates, 2012
Cou p le Fa m i l y Si n gl e Pare nt Si ng l e Pers on
Hou s eh ol d Ty pe
H ou s eh o l d Ho useh ol d Househ ol d
Median Income 2012 $91,137 $41,534 $26,673
Maximum Mortgage $357,571 $124,294 $57,580
Total Purchase Price - 10%
$397,302 $138,104 $63,977
Downpayment
Source: Statistics Canada, ING Direct
In terms of rental affordability, couple family households earning the median income would have the
most income available for rent. At 30% of gross (before-tax) income, a couple family could rent a home
for $2,300. Given average rents, a couple household earning the median income would have considerable
choice in the rental market in Maple Ridge.
A single parent earning the median income would afford to rent a unit for $1,040 at 30% of their total
income. Many households choose to spend more than 30% of their income on housing, making a wider
range of housing options available to them. Single parent households would have up to $1,730 available
for rent if they were to spend up to 50% of their monthly income on housing.
Single persons earning the median income could afford to rent a unit at $670 (at 30% of their income)
and $1,100 (at 50%). With the least choice in the rental market, individuals renting alone would be
looking at the lowest end of the rental spectrum, such as a studio or one bedroom unit in a purpose-built
rental complex. Considering shared accommodations or spending more than 30% of their income would
increase the options available to single persons.
At the median income, single parents would likely find a two bedroom apartment or townhouse to be a
reasonable option. A greater share of their income would be required if they wanted a bigger unit.
TABLE 3.9: Income Available for Rent, 2012
Cou p le Fa mi l y S i ngl e Paren t Si n gl e Pe rson
Ho u seh ol d Ty p e
Ho u se h o l d H ouseh ol d H ouseh ol d
At 30% of Median Income $2,278 $1,038 $667
At 50% of Median Income $3,797 $1,731 $1,111
Source: Statistics Canada, ING Direct
MA P LE R I DG E H O U S I N G ACTI O N P L AN - S i t u at i o n Re p o r t | Ja n u a r y 2 0 1 4 19I V N ON- MAR KET H OUS I N G &
HOMELES S N ES S
NON-MARKET HOUSING
Non-market housing refers to any housing that is not provided by the market. It includes social housing,
supportive housing, or any other form of housing where a public subsidy is provided. Non-market
housing can include temporary accommodation such as shelters and safe houses; low-income rental
housing with or without supports for residents; and it can also include below-market ownership housing.
NON-MARKET HOUSING UNITS
According to BC Housing, Maple Ridge has approximately 585 units in non-market housing plus 47
funded temporary beds in shelters and safe houses. In addition to this stock of units, there were 511 rent
subsidies made available to individuals and households living in scattered sites in Maple Ridge in 2013.
TABLE 4.1: Non-Market Housing Inventory, 2013
# Be ds / # Rent
Ty p e # B eds
U nits Su bs id ies
Emergency Shelters 25
TEMPORARY -
Transition House for Women 12
BEDS
Safe House/Beds for Youth 10
Special Needs 80
TRANSITIONAL
Seniors Supportive Housing 46
& SUPPORTIVE
Homeless/At-Risk 88
Low Income Seniors 182
INDEPENDENT
Low Income Families 189
Homeless Rent Supplements 35
Special Need Rent Supplement 1
RENT
SUPPLEMENTS
Shelter Aid for Elderly Seniors (SAFER) 294
Rental Assistance Program for Families 181
Total Beds, Units & Subsidies 47 585 511
Source: Adapted from inventory provided by BC Housing, Corporate Planning & Reporting (March 2013)
MA P LE R I DG E H O U S I N G ACTI O N P L AN - S i t u at i o n Re p o r t | Ja n u a r y 2 0 1 4 20T E M P O R A RY H O U S I N G
In Maple Ridge, there are a total of 47 beds, plus additional seasonal mats, available in shelters, transition
houses or safe houses to assist people who are homeless to get indoors, potentially stabilize from a crisis
situation, and act as a gateway to longer term housing and supports.
• Emergency Shelters - The Salvation Army Caring Place provides 25 beds for adults (14 for men, 10 for
women, and 1 flex bed). These spaces, especially those for men, are always at or near capacity. The
Caring Place also provides 15 cold/wet weather beds that are available from November to March in
response to extreme weather.
• Women and Children Fleeing Abuse - The Cythera Transition House has 12 beds for women and their
children who leave their homes due to abuse. The length of stay is up to 30 days. Cythera also
operates two units of second stage housing for women and children leaving an abusive relationship;
the length of stay is up to one year.
• Youth - Alouette Home Start Society operates the Iron Horse Youth Safe House which provides
shelter, meals and laundry for youth 13 to 18 who are dealing with issues of homelessness and/or
abuse. Allouette Homestart Society also operates the Route 29 program, which provides up to five
temporary beds for youth between 17 and 24 who are at risk of homelessness.
T R A N S I T I O N A L & S U P P O RT I V E H O U S I N G
Transitional housing is often designed as housing that can
assist clients to access the resources and supports that are
needed to be able to successfully move on to long-term
housing. They typically have a time limit attached to them,
although housing providers vary considerably in their
enforcement of these limits. Supportive housing refers to
housing with access to support services for individuals and
families with a wide range of needs or challenges. The
types and level of support services vary considerably.
• Special Needs Housing - The CMHA Simon Fraser
Branch operates two transitional houses in Maple Ridge
(12 units in total) for individuals with mental health
issues who want to live more independently. The typical
stay is two years. The MPA Society operates three
supportive housing buildings for people with mental
health issues in Maple Ridge (34 units in total).
• At-Risk of Homelessness - The Alouette Home Start
Society operates the Alouette Heights Supportive
Housing, a 45 unit complex of self contained studio
apartments, with onsite support staff. The target group
is low income singles at risk of homelessness. Alouette Heights Supportive Housing
• Seniors - For low-income seniors in Maple Ridge who
cannot live independently, there are 46 units of seniors
supportive housing at the Royal Crescent Gardens, a
facility operated through Fraser Health.
MA P LE R I DG E H O U S I N G ACTI O N P L AN - S i t u at i o n Re p o r t | Ja n u a r y 2 0 1 4 21In addition to the above, there are also several group homes and scattered units throughout Maple Ridge
that accommodate individuals with special needs, such as mental health issues or other disabilities.
PERMANENT SOCIAL HOUSING
In 2013, there were 371 units of permanent social housing in Maple Ridge for low-income families
(189 units) and low-income seniors (192 units) who live independently. This would include units operated
by non-profit housing providers, co-operative housing providers, or managed directly by BC Housing.
RENT SUPPLEMENT PROGRAMS
BC Housing manages a number of rent supplement programs.
• Homeless Rent Supplements - Since 2008, BC Housing has offered a homeless rent supplement in
conjunction with the Homeless Outreach Program for people who are homeless to access housing,
income assistance, and community-based support services. In 2013, 35 homeless individuals in
Maple Ridge received this supplement, but the number varies from month to month depending on
client needs.
• SAFER for Seniors - The Shelter AId for Elderly Residents (SAFER) program provides rent subsidies to
people who are over 60 years old and paying more than 30% of their gross monthly income for
housing. The rent subsidy is used towards rental housing secured on the private market. As of March
2013, 294 low-income seniors in Maple Ridge were receiving rent assistance through this program.
• RAP for Families - Under the Rental Assistance Program (RAP), working families that earn less than
$35,000 a year receive direct cash assistance to supplement their income and assist with the cost of
renting in the private market. In Maple Ridge, 181 households were receiving RAP subsidies.
H O M E L E S S N E S S & AT- R I S K P O P U L AT I O N S
Since 2002, Metro Vancouver’s Regional Steering Committee on Homelessness has conducted a homeless
count every three years. The count is a 24-hour snapshot intended to determine the minimum number of
people who are homeless in the region on a given day/night, usually in the middle of March. While the
approach for undertaking the homeless count aims to identify individuals who are staying in shelters,
transition houses, and youth safe houses, and those who are visibly homeless on the street or accessing
homelessness services, it is not designed to capture the hidden homeless or those who tend to stay
temporarily with friends and family and avoid services.
According to the 2011 count, there were 110 homeless individuals in Maple Ridge/Pitt Meadows. Among
them, 100 were surveyed. Through this survey, it was found that 47 were sheltered in an emergency
shelter, safe house, or transition house (43%). The remaining 63 were counted as being unsheltered,
sleeping rough in the streets, parks and green spaces of the community (57%). Among those surveyed,
men outnumbered women by a seven to one ratio. However, homeless women are often reported to be
less visible, relying on couch surfing and other means to stay off the streets and are often not counted.
MA P LE R I DG E H O U S I N G ACTI O N P L AN - S i t u at i o n Re p o r t | Ja n u a r y 2 0 1 4 22TABLE 4.2: Homeless Population, 2002-2011
Ch ange Ch ange
A rea /Regi o n 2002 2 00 5 20 0 8 2 01 1
2 00 8- 2 01 1 2 00 2- 2011
Maple Ridge/Pitt Meadows 66 44 90 110 22.2% 66.7%
Metro Vancouver 1,121 2,174 2,660 2,650 -0.4% 136.4%
Source: Greater Vancouver Regional Steering Committee on Homelessness, 2012
Overall, there was a 67 percent increase in the number of homeless people in Maple Ridge between 2002
and 2011. Compared to the 2008 count, there was a small reduction in the adult homeless population
counted in Maple Ridge, but this was offset by an increase in the number of homeless youth counted.
The increase in the youth count may be attributed, in part, to the implementation of a better technique
in counting and surveying homeless youth. The next count is scheduled for the Spring of 2014.
MA P LE R I DG E H O U S I N G ACTI O N P L AN - S i t u at i o n Re p o r t | Ja n u a r y 2 0 1 4 23V CON TEXT: LEGISL ATION & POLICY
FEDERAL ROLE
The federal government plays a much smaller role in housing than it has played in different periods of
Canadian history. Past initiatives of the 1970s and 1980s included funding programs for social housing
and incentives that led to the construction of purpose-built rental buildings, which had significant and
large scale impacts on new construction of both rental and lower income housing. Today, senior
government continues to contribute to local housing, but to a lesser capacity than earlier decades. Of
note here are the affordable housing funding programs and the role of Canada Mortgage and Housing
Corporation (CMHC) in providing guidelines and criteria to protect homeowners and financial
lending institutions.
• Canada Mortgage and Housing Corporation provides insurance for residential mortgage loans to
Canadian buyers and sets the lending rules for government-backed loans. Recent changes have re-
established the lending criteria for CMHC-backed mortgage insurance to what it was in 2006, when
CMHC and other lending institutions had been insuring mortgages with no down payments and 40
year amortization periods. Current criteria are:
• Maximum amortization period of 25 years for new mortgages.
• Maximum amount Canadians can borrow set at 80 percent of the value of their homes.
• Funding Programs
• The criteria and guidelines for CMHC’s Affordable Housing Initiative funding program has changed
every three or four years, but has typically been delivered in partnership with BC Housing.
• CMHC’s Investment in Affordable Housing 2011-2014 Framework Agreement targets affordable
housing through bilateral federal-provincial agreements. Initiatives can include new construction,
renovation, homeownership assistance, rent supplements, shelter allowances, as well as other types
of projects.
• Employment and Social Development Canada’s Homelessness Partnering Strategy delivers funding
to qualifying organizations for projects to help prevent and reduce homelessness. These include
funding streams that are regionally or nationally-delivered. As a designated community, Metro
Vancouver has to prepare a comprehensive community plan and eligible projects need to contribute
to meeting the goals of this plan.
• In Metro Vancouver, projects that target off-reserve Aboriginal homeless people may also be eligible
for funding under the Aboriginal homelessness stream.
PROVI NCIAL ROLE
FUNDING
The provincial government is involved in bilateral federal-provincial funding programs such as the
Investment in Affordable Housing 2011-2014 Framework. In British Columbia, the Agreement for
Investment in Affordable Housing has contributed to programs that increase the supply of affordable
housing such as the Affordable Rental Housing Initiative, the Aboriginal Housing Initiative, and others.
MA P LE R I DG E H O U S I N G ACTI O N P L AN - S i t u at i o n Re p o r t | Ja n u a r y 2 0 1 4 24These programs are administered by BC Housing alongside a number of provincial programs that fall
under the Housing Matters BC strategic plan. Examples of key BC Housing programs include:
• Rent supplement programs, including the Shelter Aid for Elderly Renters (SAFER) for seniors, Rental
Assistance Program for families, and other rent supplements that are available to homeless outreach
teams.
• Homelessness programs, such as the Emergency Shelter Program, the Homeless Outreach Program,
and the Aboriginal Homeless Outreach Program.
• The provision and funding of non-market housing that is operated by non-profit housing providers as
well as directly managed by BC Housing.
• Independent Living BC, which provides subsidized assisted living for seniors and people with
disabilities.
BC Housing has been a major partner in the development of new non-market housing projects for seniors
and populations at-risk of homelessness. Currently, however, there is some uncertainty regarding the
availability of provincial funding for new construction and renovation projects for non-market housing
projects in BC.
Par tnership Initiative - Alouette Heights Suppor tive Housing
The Alouette Heights supportive housing project was completed in 2012 in Maple Ridge. The 46-unit
development, which is operated by the Alouette Home Start Society, was constructed on land that is
leased from the District, with capital and operating funds from BC Housing.
L E G I S L AT I O N
In British Columbia, the power to regulate land use is delegated to local government. Through a number
of acts and codes, the Province has established the legislative parameters within which local government
can exercise its land use regulatory authorities. Most important among these are:
• The Local
Government
Act sets out the various authorities and responsibilities of local government,
including those related to its regulation of land use. All of the land use planning and regulation tools
used by the municipality - Official Community Plan, zoning, density bonusing, development permit
areas, and others - are set out in the Local
Government
Act.
• The Community
Charter
offers municipalities the power to provide any service that Council
considers necessary or desirable and the power to regulate and in some cases prohibit and/or impose
requirements in relation to a number of broad areas or "spheres". For example, if housing is a
significant issue, municipal councils can be proactive.
• The BC
Building
Code provides the rules pertaining to building construction. Municipal bylaws
regarding housing must be in compliance with the Code.
• Acts that establish regulations pertaining to particular segments of the housing landscape, which
include the Manufactured
Home
Park
Tenancy
Act, and the Strata
Property
Act.
MA P LE R I DG E H O U S I N G ACTI O N P L AN - S i t u at i o n Re p o r t | Ja n u a r y 2 0 1 4 25You can also read