DRAFT HOUSING ELEMENT 2021-2029 APPENDIX A - City of Chula Vista
←
→
Page content transcription
If your browser does not render page correctly, please read the page content below
DRAFT HOUSING ELEMENT 2021-2029
                                                               APPENDIX A

                    OVERVIEW:
1.0                 COMMUNITY PROFILE & HOUSING
                    NEEDS
                The City of Chula Vista used data that are the most reliable for assessing existing
                conditions. The Housing Element requires such information in order to implement
                future goals and meet the city’s needs. Furthermore, such standard sources
                provide a basis for consistent comparison with older data and provide the best
                basis for forecasts.

Primary Data Sources

American Community Survey (ACS)
The American Community Survey (ACS) is an ongoing survey that provides vital information yearly about
our nation and its people. The yearly report goes further into the livelihoods of people in the US, providing
more specific information than the census.

California Department of Finance
The State provides up-to-date numbers on population and housing. For housing, the State estimates total
and occupied housing units, household size, household population, and group quarters population. ACS
data are used to distribute 2010 census housing units into standard housing types (single detached units,
single attached units, two to four units, five plus or apartment units, and mobile homes). Housing units
are estimated by adding new construction and annexations and subtracting demolitions and adjusting for
units lost or gained by conversions.

California Employment Development Department (EDD)
The EDD Data Library provides access to view and download data and information related to California
industries, occupations, employment projections, wages, and labor force. The data can be used to better
understand California’s economy, to make informed labor market decisions, as a tool to direct efforts to
promote the state’s overall economic health, support workforce development, and much more.

Comprehensive Housing Affordability Strategy (CHAS)
Each year, HUD receives custom tabulations of ACS data from the U.S. Census Bureau. These data, known
as the "CHAS" data, demonstrate the extent of housing problems and housing needs, particularly for low
income households. On August 25, 2020 HUD released updated CHAS data for the 2013-2017 period,
which is used in this Element.

                                                                                  Page AA-1
DRAFT HOUSING ELEMENT 2021-2029
                                                               APPENDIX A

SANDAG
SANDAG 2030 and 2050 Regional Growth Forecast, Series 13. SANDAG produces growth forecasts of
population, housing, employment, income, and land use for jurisdictions in San Diego County. These
forecasts were used in the Housing Element to discuss future trends and needs.

U.S. Census
The Census data is information provided by the US population every ten years. It consists on information
such as social, economic, housing and demographic information. Unfortunately, the Census was last
updated in 2010, with data from the 2020 Census not available at this time. Because of this, 2010 Census
data is typically used for historic context.

Page AA-2      City of Chula Vista General Plan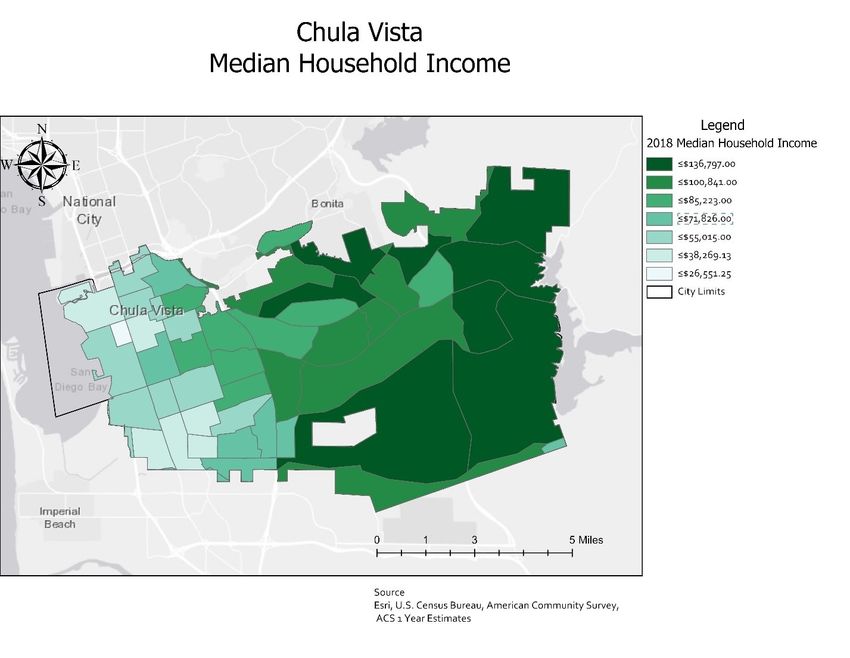
DRAFT HOUSING ELEMENT 2021-2029
                                                            APPENDIX A

                     COMMUNITY PROFILE
2.0
2.1 Population Trends and Characteristics
Understanding the characteristics of a population is vital in the process of planning for the future
needs of a community. Population characteristics affect the type and amount of housing need in
a community. Issues such as population growth, race/ethnicity, age, and employment trends are
factors that combine to influence the type of housing needed and the ability to afford housing.
The following section describes and analyzes the various population characteristics and trends
that affect housing need.

2.1.1       Historical, Existing & Forecasted Growth

In 2019, the City of Chula Vista is the second largest city in San Diego County and 14th largest in
California by population. The San Diego Association of Governments (SANDAG) has forecasted
that the City of Chula Vista’s population will increase by approximately 40 percent between 2010
and 2050 as shown in Table A-1. With this knowledge, the City of Chula Vista can begin to plan
and act with the certainty that there is a need for more housing. Additionally, analyzing where
future housing product is planned or currently in development as it compares to areas of
population growth (Figure A-1) aids in better planning practices.

                                              Table A-1
                     San Diego Region and City of Chula Vista Population Forecast

 Location                                                   2010-      2020-        2035-     2010-
              2010        2020        2035        2050
                                                            2020       2035         2050      2050
  Chula      243,916     286,744    320,297     343,752     42,828    33,553        23,455   99,836
  Vista
                                                                                             40.9%*
 % of the     13%         12%         12%         12%        8%         12%          9%       9%*
 county
   San      1,321,315   1,453,267   1,665,609   1,777,936   152,53    210,53        102,01   465,083
  Diego
                                                                                             35.7%*

                                                                               Page AA-3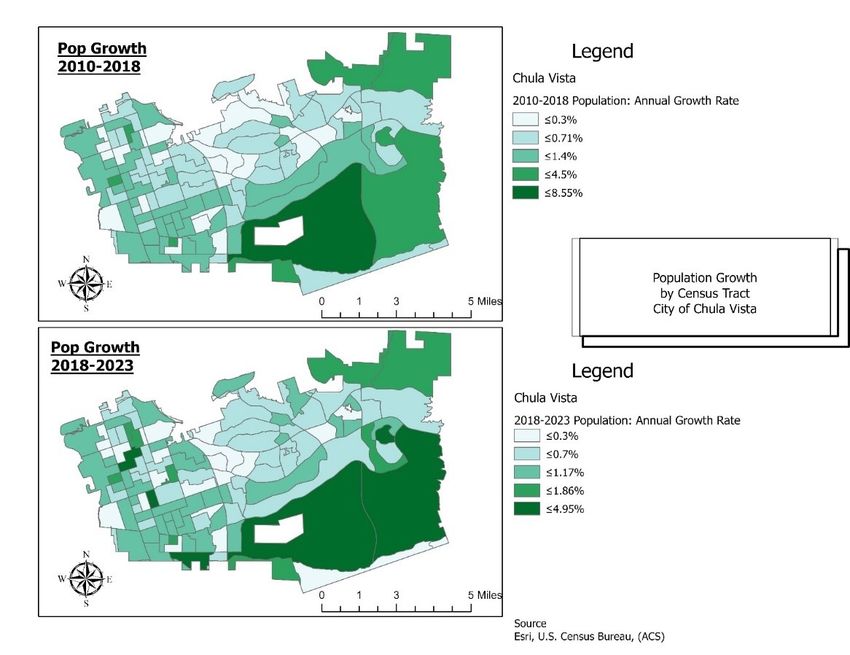
DRAFT HOUSING ELEMENT 2021-2029
                                                                  APPENDIX A

                                                Table A-1
                       San Diego Region and City of Chula Vista Population Forecast

 Location                                                            2010-        2020-        2035-     2010-
                2010         2020          2035         2050
                                                                     2020         2035         2050      2050
   San        3,143,429   3,435,713     3,853,698    4,068,759      340,400      417,985      215,061   973,446
  Diego
                                                                                                        31.4%*
 County
Notes: *Percent change from 2010 to 2050
Source: SANDAG. “2050 Regional Growth Forecast.” Series 13: 2050 Regional Growth Forecast, 2013.

                                           Figure A- 1
            Chula Vista Population Growth 2010-2018 and Projected Growth 2018-2023

Page AA-4        City of Chula Vista General Plan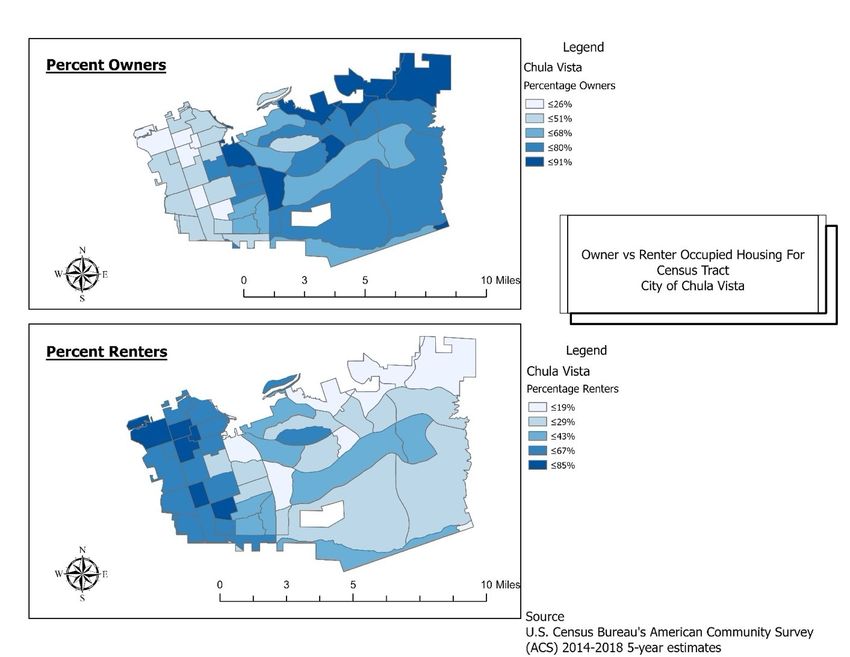
DRAFT HOUSING ELEMENT 2021-2029
                                                            APPENDIX A

2.1.2      Age Composition

Age is an important demographic factor for analyzing future housing needs and crafting policies
to help meet the specific demands of different age groups. Traditionally, both the young adult
population (20 to 34 years of age) and the elderly population tend to favor apartments, low- to
moderate-cost condominiums, and smaller single-family units. Persons between 35- and 65-
years old often provide the major market for moderate to high-cost apartments and
condominiums and larger single-family units because they tend to have higher incomes and
larger sized households.

With a median age of 35 years of age, Chula Vista residents are generally comparable in age to
those in the San Diego County region at 35.9 years of age. Table A-2 displays the age distribution
in Chua Vista and San Diego County using American Community Survey data from 2018. This
table shows that in 2018 the largest portion of the population was children aged zero to 14 years
of age accounting for 21.2% of the population, then followed by those aged 45 to 59 (18.8%),
younger persons aged 25 to 34 (14.5%), and then persons aged 35 to 44 (14.1%). Chula Vista’s
population can, therefore, be characterized predominately as being composed of families with
children. The age distribution in Chula Vista is similar to the region’s, showing larger population
groups of children and persons between 45 and 59 years of age.

                                              Table A-2
                                 Age Distribution Comparison (2018)
       Area           0-14    15-19     20-24      25-34   35-44      45-59      60-64     65+
    Chula Vista      21.2%    7.1%      7.3%       14.5%   14.1%      18.8%      4.9%     12.1%
    San Diego        19.3%    7.3%      8.7%       15.2%   13.6%      19.7%      4.8%     11.4%
      County
  Source: Bureau of the Census (2018)

                                                                              Page AA-5
DRAFT HOUSING ELEMENT 2021-2029
                                                                         APPENDIX A

2.1.3         Race and Ethnicity

Chula Vista is diverse community, predominately Hispanic, with differing cultures and
preferences. Figure A-2 shows that the largest portion of the population in Chula Vista is Hispanic
at 60%, then White (non-Hispanic) at 17%, Asian 15.2%, Black 4%, and Multiple/Other 3%. “2019
Race and Hispanic Origin .” GIS Mapping Software, Location Intelligence & Spatial Analytics, 2019.

                                                          Figure A-2
                                               Race/Ethnicity Distribution (2018)

                                          Hispanic    White    Black    Asian    Multiple Race

Page AA-6          City of Chula Vista General Plan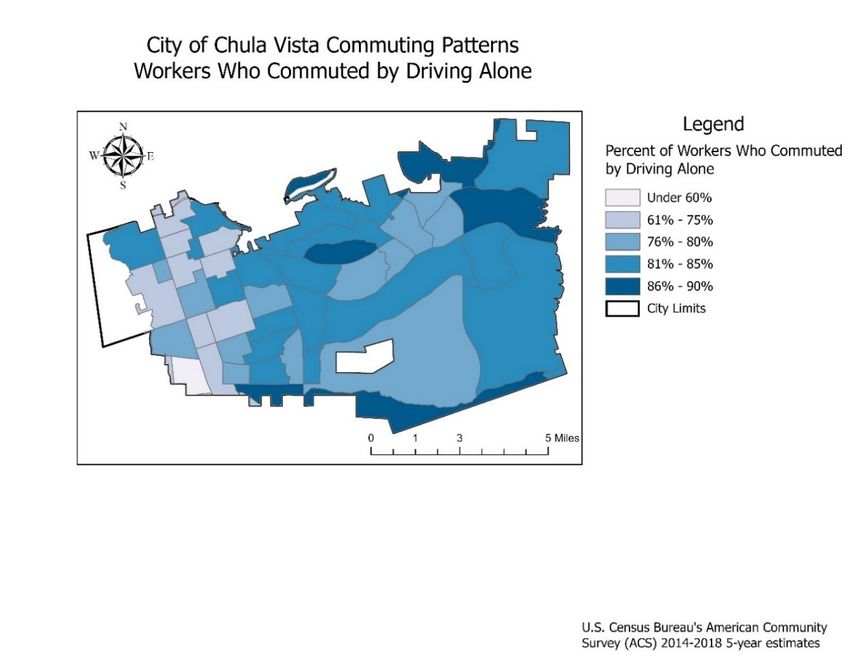
DRAFT HOUSING ELEMENT 2021-2029
                                                             APPENDIX A

                                             Table A-3
                        Race/Ethnicity in Chula Vista and San Diego County
     Area         White  Black     Asian       Native      Pacific   Other     Two or    Hispanic/
                  Only                       American Islander                  More      Latino
 % Chula Vista
                  17.8%      4.0%      15.5%   0.1%       0.5%       0.3%       3.0%      58.8%
  Population
 % San Diego
                  13.2%      20.1%     10.7%   20.2%      15.6%     23.1%      14.3%      19.6%
    County
  Population
 Source: ACS 5-year estimates (2018)

Table A-3 shows that the ethnic distribution of the Chula Vista population was predominantly
Hispanic or Latino with San Diego County exhibiting more ethnic diversity, with “some other race”
being the largest race/ethnicity followed closely by Native American, Black and Hispanic/Latino.
The race/ethnic composition of City residents has remained stable in Chula Vista from 2018
compared to the 2010 Census.

The racial and ethnic composition of a population may affect housing needs because of cultural
preferences associated with different racial/ethnic groups. Cultural influences may reflect
preference for a specific type of housing. For example, research has shown that some cultures
(e.g. Hispanic and Asian) tend to maintain extended families within a single household. This
tendency can lead to overcrowding or an increased demand for larger housing units. Ethnicity
also tends to correlate with other characteristics such as location choices, mobility, and income.

                                                                             Page AA-7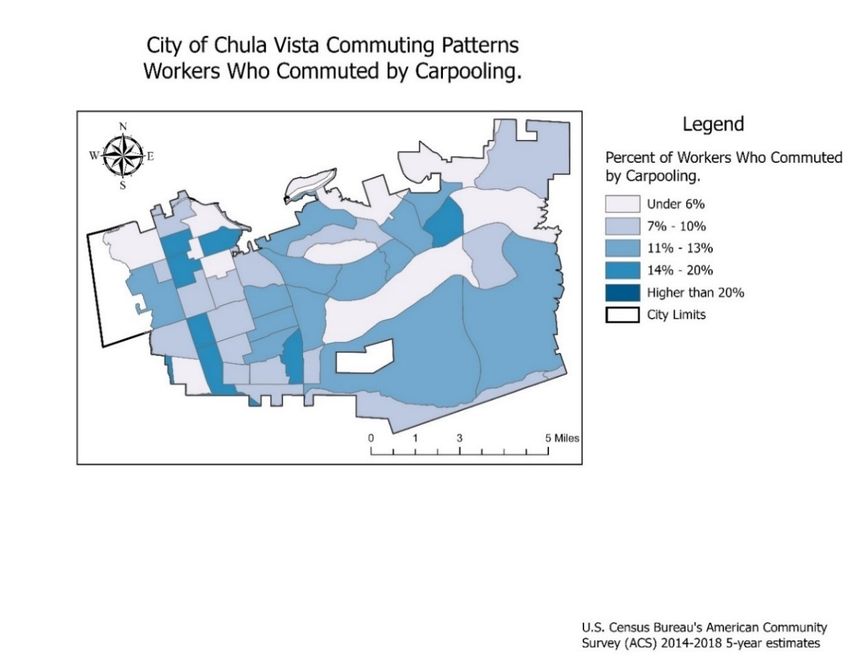
DRAFT HOUSING ELEMENT 2021-2029
                                                                     APPENDIX A

2.2 Employment Trends
Housing needs are affected by employment trends. Significant employment opportunities within
the City can lead to growth in demand for housing in proximity to jobs. The quality or pay of
available employment can determine the need for various housing types and prices.

In 2018, the City’s top industries included: Professional and Business Services, Government,
Education and Healthcare, Retail Trade, and Arts and Entertainment. These are expected to
continue to employ the highest proportions of the civilian population in 2035. Meanwhile,
agricultural and mining jobs continue to decline in the City.

Employment has a large impact on housing needs and the demand for different types of housing.
As shown in Table A-4, the City is projected to add a little over 31,000 jobs between 2020-2050.
These will likely include low- and high-skill jobs, so housing in the City will need to accommodate
a range of housing types at prices affordable to the range of household incomes. (“Economic
Characteristics.” Data.census.gov, 2018.)

                                                     Table A-4
                                            Employment Growth (2010-2050)
                                                                                       Numeric
                                                                            % change
   Jurisdiction              2010                2020          2050                     change
                                                                            2010-50
                                                                                        2010-50
   Chula Vista             64,035              82,966         114,435        78.7%     50,400
 Imperial Beach             3,592               4,556          4,830         34.5%      1,238
  National City            26,826              30,293          39,785        48.3%     12,959
   San Diego               764,671             867,567       1,009,177       32.0%     244,506
   San Diego              1,421,941           1,624,124      1,911,405       34.4%     489,464
     County
 Source: SANDAG Series 13 Subregional Growth Forecast (2013)

In addition to preference, households are limited on housing choices based on income and
resources. Incomes associated with different jobs and the number of individuals employed in a
household determines the type and size of housing a household can afford. Table A-5 shows that
the largest employers in Chula Vista are similar to those around the County, with the largest
employment sector being Education Services, Health Care and Social Assistance followed by
Professional, Scientific Management and Waste Management Services. This table is also an
example of the differences in income by industry with Information being one of the highest

Page AA-8          City of Chula Vista General Plan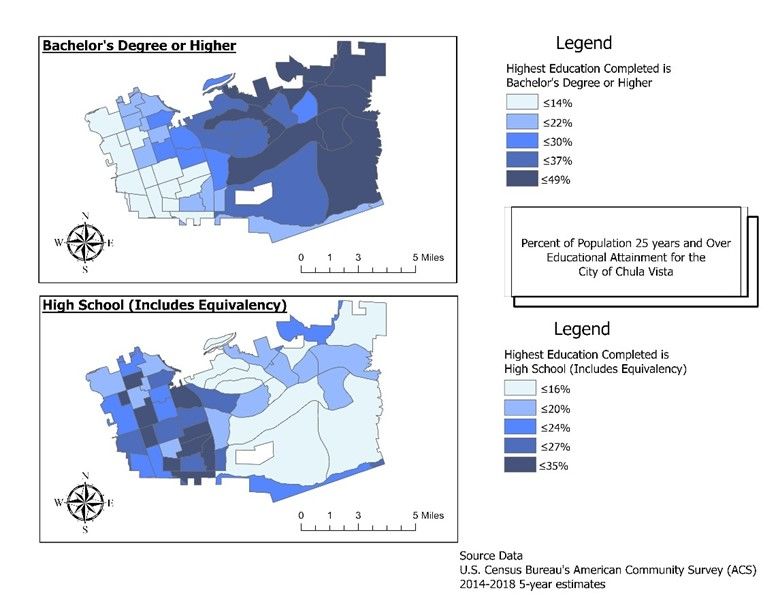
DRAFT HOUSING ELEMENT 2021-2029
                                                                APPENDIX A

paying employers but not a major industry in Chula Vista. In some cases, the types of jobs
themselves can affect housing needs and demand. For example, specific types of housing units
are preferred in communities with military installations, college campuses, and/or large amounts
of seasonal agriculture.

                                                Table A-5
                                    Number of Workers by Industry (2018)
                                                              San Diego        Mean Annual Wage in the
                Industry                     Chula Vista
                                                               County          Region (San Diego MSA)
 Agriculture, Forestry, Fishing,                 0.2%           0.9%              $29,798-$33,243
 Hunting and Mining
 Construction                                   6.1%             5.9%                $53,760-$60,047
 Manufacturing                                  8.3%             9.2%                $39,500-$94,969
 Wholesale Trade                                2.7%             2.4%                $65,599-$94,969
 Retail Trade                                   11.0%           10.5%                $37,650-$45,974
 Transportation, Warehousing and                5.4%            4.1%                 $31,976-$54,945
 Utilities
 Information                                     1.8%            2.2%               $79,899-$104,627
 Finance and Insurance, Real Estate,             5.6%            6.2%                $45,974-$70,103
 Rental and Leasing
 Professional, Scientific, Management           11.3%           15.1%               $72,840-$136,531
 and Waste Management Services
 Education Services, Health Care and            23.4%           21.3%               $30,481-$102,053
 Social Assistance
 Arts, Entertainment and Recreation,            10.7%           11.9%                    $61,614
 Accommodations and Food Service
 Other Services, Except Public                   4.7%            5.4%                $26,030-$47,927
 Administration
 Public Administration                          8.6%            5.0%                     $94,926
 Total Mean Annual Wage                         100%            100%                     $64,461
 Source: Census 2018 American Community Survey (2018) and California Employment Development Department (2010).
 Department, Employment Development. “Occupational Employment (May 2019) & Wage (2020 - 1st Quarter) Data.” OES
 Employment and Wages.

                                                                                     Page AA-9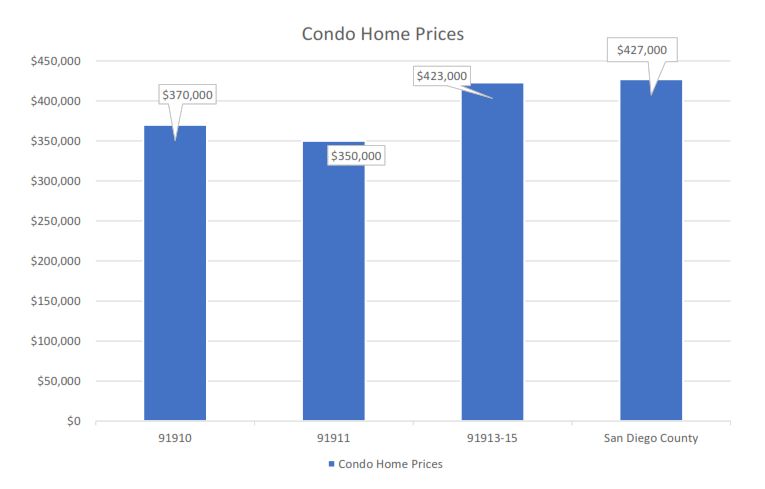
DRAFT HOUSING ELEMENT 2021-2029
                                                                  APPENDIX A

                                                     Table A-6
                                          Labor Force and Unemployment
                                                Employed
                           Population 16+                        Armed Forces     Unemployed       % Unemployed
         Jurisdiction                            Civilians
  Chula Vista                        92,430            49,806              494             6,850      12.0%
  National City                      48,150            23,993            4,192             2,284       7.5%
  San Diego (Central)              419,725            250,176           11,626            22,210      7.8%
  North Central                    537,127            332,286           16,008            20,193      5.5%
  North Coastal                    428,717            240,944           25,393            14,620      5.2%
  North Inland                     472,043            279,950            2,953            16,902      5.6%
  East                             388,512            222,113            3,099            20,151      8.2%
  San Diego County               2,636,785           1,536,073          72,524           116,758      6.8%
 Source: U.S. Census Bureau; 2013-2017 American Community Survey 5-Year Estimates, Table D03

SANDAG's Series 13 shows a region wide average of 1.2 workers per dwelling unit. In Chula Vista
this would result in 105,840 workers (1.2 x 88,200 dus) available for 83,000 jobs, a 1.27 worker-
to-jobs ratio. Employment growth typically leads to strong housing demand, and the reverse is
true when employment declines. The rate of unemployment has an effect on household income
and what is considered affordable. In accordance with the ACS 5-year estimates, as shown in
Table A-6, Chula Vista has the highest unemployment rates for all persons in the civilian
workforce at 12% likely giving residents less of a choice in location, quality, or type of housing.
In the San Diego County region, the unemployment rate is 6.8%, with rates in other areas ranging
from 5.5% in northern regions and 7.8% in the Central San Diego region and 8.2% in the east.

Page AA-10        City of Chula Vista General Plan
DRAFT HOUSING ELEMENT 2021-2029
APPENDIX A
As shown in Table A-7, the Sweetwater Union High School District is the top single employer in
Chula Vista. In aggregate, the education industry employs 12 percent of the employees on the
Top Ten Employer list. The health industry and retail and service industry are also very significant
employers. Retail and Service companies employ about 6 percent of employees in Chula Vista.
Hospitals that employ 5 percent of the total employees on the City’s major employers list. The
top ten employers have a total of 18,747 employees, which make up approximately 28.8 percent
of the City’s total employees.
Table A-7
Top Ten Employers in Chula Vista (2019)
Percent of
Business Business Type Employees
Employees
Sweetwater Union High School Education 4,133 6.36%
District
Chula Vista Elementary School Education 3,680 5.66%
District
Sharp Chula Vista Medical Center Medical 2,287 3.52%
Rohr Inc./Goodrich Aerospace Aerospace 1,928 2.97%
Manufacturing
Southwestern Community College Education 1,743 2.68%
Wal-Mart Retail 1,323 2.03%
City of Chula Vista Government 1,208 1.86%
Scripps Mercy Hospital Medical 1,073 1.65%
Aquatica Entertainment 698 1.07%
Costco Retail 674 1.04%
Target Retail - -
Vons Retail - -
Total - 18,747 28.84%
"Total Employment" as used above represents the total employment of all employers located within City
limits.
Source: State Employment Development Department
City Finance Department
Sweetwater Union High School District
Chula Vista Elementary School District
Southwestern Community College
EDD
Page AA-11DRAFT HOUSING ELEMENT 2021-2029
APPENDIX A
Employment rates are an indicator of economic trends in the City. Chula Vista’s labor force grew
from 119,700 in 2012 to 123,600 in 2019. Unemployment rates decreased from 11 to 3 percent
from 2012 to 2019. This pattern of decreasing unemployment is representative of the effect that
the economic is improving in the San Diego region, State, and Nation.
Table A-8
Labor Force Trends
Unemployment
Year Labor Force Employment Unemployment
Rate
2012 119,700 106,100 13,600 11.4%
2013 120,200 108,500 11,800 9.8%
2014 119,600 110,000 9,600 8.1%
2015 120,700 112,800 7,900 6.5%
2016 120,600 114,400 6,200 5.2%
2017 122,000 116,700 5,400 4.4%
2018 122,900 118,400 4,500 3.7%
2019 123,600 119,300 4,300 3.5%
Notes: Data cited are for the Chula Vista population, and does not represent the number of jobs in Chula Vista.
Source: State of California Employment Development Department (EDD) 2020
Page AA-12 City of Chula Vista General PlanDRAFT HOUSING ELEMENT 2021-2029
APPENDIX A
2.3 Education Characteristics
The ACS 5-year estimates, as shown in Table A-9, shows that the educational level of Chula Vista
residents is typically not as high as other regions within San Diego County. Approximately 29%
of Chula Vista residents have not graduated from high school. This is a significant portion of the
population when compared to the County average at 13%. Additionally, as seen in Table A-9,
Chula Vista ranks as having the lowest percentage of residents who have obtained a bachelor’s
degree with only 10.9%, and only 4.2% go on to complete a graduate degree. Once again, Chula
Vista ranks lower in educational achievement when compared to County averages of 23%
completing a bachelor’s degree and 14.4% obtaining a graduate degree.
Table A- 9
Educational Attainment Among Population 25+ Years of Age
Population Did NOT High School Some College Bachelor’s Graduate
Jurisdiction 25+ Graduate HS Graduate or AA Degree Degree
Chula Vista 76,245 29.5% 25.2% 30.2% 10.9% 4.2%
National City 37,765 27.2% 26.2% 32.3% 11.3% 2.9%
San Diego (Central) 343,499 19.8% 19.4% 29.1% 20.4% 11.3%
North Central 446,752 5.2% 12.4% 27.0% 31.2% 24.2%
North Coastal 352,761 10.7% 17.5% 31.1% 24.8% 15.8%
North Inland 403,926 13.0% 18.0% 29.9% 24.4% 14.7%
East 330,507 12.2% 25.0% 36.9% 17.2% 8.8%
San Diego County 2,197,045 13.3% 18.6% 30.7% 23.0% 14.4%
Source: U.S. Census Bureau; 2013-2017 American Community Survey 5-Year Estimates, Table DP02
Not only is there an overall lower educational achievement for residents of Chula Vista, the level
of education is also related to geographic location within the City. Figure A-3 shows the education
levels of residents over the age of 25 and there is an obvious divide between the west and east
halves of Chula Vista. A significant majority of residents in areas west of I-805 achieved a high
school diploma or equivalent while the majority of residents east of the I-805 have achieved a
bachelor’s degree or higher. The educational attainment by Chula Vista residents is consistent
with the number of residents who are employed in low skill/wage industries.
Page AA-13DRAFT HOUSING ELEMENT 2021-2029
APPENDIX A
Figure A- 1
Chula Vista Educational Level
Page AA-14 City of Chula Vista General PlanDRAFT HOUSING ELEMENT 2021-2029
APPENDIX A
2.4 Household Characteristics
This section provides an overview of the characteristics of Chula Vista’s households. The U.S.
Census Bureau defines a household as all persons living in a single housing unit. One person living
alone is considered a household as is a group of unrelated people living in a single housing unit.
A family is defined as related persons living within a single housing unit.
The Census defines a household as all persons who occupy a housing unit, which may include
single persons living alone, families related through marriage or blood and unrelated individuals
living together. Other group living situations, such as skilled nursing facilities, dormitories, etc.
are not considered households. The household characteristics described in this section are size
and income, and these contribute to the diverse need for housing. According to the 2010 Census,
there were 1,086,865 households (equal to occupied housing units) in all of San Diego County.
2.4.1 Household Formation & Composition
Chula Vista has experienced a rapid increase in the number of households. Between 2010 and
2020 Chula Vista saw a 13 percent increase in the number of households. From 2010 to 2035, the
City will see an increase of 26 percent of households.
Table A-10
Total Households Percentage of Increase 2010-2018
% Increase 2010 -
Area 2010 2020 2035
2035
Chula Vista 78,384 89,063 98,924 26%
San Diego 515,426 559,197 640,194 24%
San Diego County 1,158,076 1,249,654 1,394,688 20%
Source: SANDAG SERIES 13 REGIONAL GROWTH FORECAST
Different household types generally have different housing needs. Seniors or young adults usually
comprise the majority of the single-person households and tend to reside in apartments,
Page AA-15DRAFT HOUSING ELEMENT 2021-2029
APPENDIX A
condominiums or smaller single-family homes. Families with children likely prefer single-family
homes. Household size is a significant factor in housing demand.
Often, household size can be used to predict the unit size that a household will select. For
example, small households (one and two persons per household) traditionally can find suitable
housing in units with zero to two bedrooms while larger households (three or more persons per
household) can usually find suitable housing in units with two to four bedrooms. However,
individual choice also reflects preference and economics.
According to the U.S. Census, Chula Vista’s population grew by 41% from 2000 to 2010, while the
San Diego County population grew by 10%. Similarly, the number of Chula Vista households
increased 40%, whereas, San Diego County households increased by 10%. Chula Vista’s
population growth is due to the rapid growth and continued development of master planned
communities in the developing areas east of I-805.
Table A-11
Changes in Household Types
2010 2018 Change
Household Types
# % # % %
Families 59,408 44% 62,537 40% 5.3%
Married with Children 42,153 31% 44,913 29% 6.5%
Other Family (No Spouse) 17,255 13% 17,624 11% 2.1%
Non-Families 16,107 12% 16,403 11% 1.8%
Single 13,064 8%
Total Households 75,515 78,940 4.5%
Source: Bureau of the Census (2000 and2010). US Census Bureau 2018 ACS Housing Characteristics
Page AA-16 City of Chula Vista General PlanDRAFT HOUSING ELEMENT 2021-2029
APPENDIX A
For 2020, Chula Vista’s averaged 3.3 persons per household. The average number of persons per
household in the South County San Diego region ranged from 3.47 in National City to 2.88 in
Imperial Beach, with a region-wide average of 2.82 persons per household. SANDAG estimates
that average household size in the region will remain stable through 2050, as shown in Table A-
12.
Table A-12
Average Persons per Household (2018)
Average Household Size Projected Average Household Size
Jurisdiction
(2020) (2050)
Chula Vista 3.3 3.28
National City 3.47 3.41
Imperial Beach 2.88 2.89
San Diego 2.66 2.64
San Diego County 2.82 2.81
Source: SANDAG Series 13 Regional Growth Forecast
2.4.2 Jobs to Housing Balance
There often is a mismatch between the location of housing and jobs in Southern California. One
way of determining if Chula Vista’s households commute out of the City to work is by looking at
the jobs-to-housing balance. The jobs-to-housing balance is the number of jobs in Chula Vista
divided by the number of housing units in Chula Vista. In 2010, Chula Vista had 0.8 jobs to
household ratio, slightly up in 2020 at 0.9. Although there was a slight increase in the jobs-to-
housing ratio from 2010 to 2020, the growing number of households, coupled with high
unemployment rates in previous years in the City, indicates that many households have to
commute out of the City for their work.
Table A-13
Jobs-Household Ratios
Description 2010 2020
Employment 64,035 82,966
Housing Units 78,384 89,063
Jobs/Household Ratio 0.8 0.9
Page AA-17DRAFT HOUSING ELEMENT 2021-2029
APPENDIX A
Source: SANDAG, 2013 & U.S. Census 2018 American Community
Survey 5-Year Estimates
2.4.3 Commuting Patterns
Commuting patterns give an insight into the relationship of housing to employment opportunities
and are a component in the allocation resources and development opportunities.
The City of Chula Vista has a moderately higher travel time (29.7 minutes) compared to the rest
of San Diego County residents. As seen in Table A-8, there are approximately 119,112 employed
residents in Chula Vista and 79% of them drove alone to work compared to almost 10% who
carpooled, and about 6% either walked, biked to work, or used public transportation. These
numbers are close to the San Diego Region average, the most notable differences being the
number of people working from home – 4% in Chula Vista and 7% in the region as a whole – and
the number of people who drive alone to work.
Table A-14
Means of Transportation to Work (2018)
Chula Vista San Diego Region
Industry #of Workers
% of Total #of Workers 16+ % of Total
16+
Car, Truck, or Van – Drove Alone 94,669 79.5% 1,223,159 76.3%
Car, Truck, or Van – Carpooled 11,319 9.5% 138,748 8.7%
Public Transportation 3,602 3.0% 46,506 2.9%
Walked 1,493 1.3% 46,313 2.9%
Other means 2,452 2% 36,799 2.3%
Worked at home 5,577 4.7% 111,961 7.0%
TOTAL 119,112 100% 1,603,486 100%
Source: US Census Bureau, 2013-2017 American Community Survey 5-Year Estimates, Table DP03
Page AA-18 City of Chula Vista General PlanDRAFT HOUSING ELEMENT 2021-2029
APPENDIX A
As with other demographic contributors in Chula Vista, commuting behaviors differ between
those living east and west of I-805. Figures A-4 and A-5 show more than 76% of residents living
east of I-805 are commuting to work by driving alone. Comparatively, less than 75% of residents
who live west of I-805 are driving alone to work. On commonality is that on either side of the I-
805, very few residents choose to commute by carpooling.
Figure A- 2
Page AA-19DRAFT HOUSING ELEMENT 2021-2029
APPENDIX A
Figure A- 3
In addition, the residents choosing public transportation as their mode of transportation is higher
west of I-805 (generally over 6%, and in some census tracts over 13%). However, east of I-805,
less than 3.4% of residents are utilizing public transportation for their work commute.
2.4.4 Household Income
The Federal Department of Housing and Urban Development (HUD) generates an annual median
income for the purpose of determining program eligibility. The San Diego County Metropolitan
Statistical Area (MSA), for which HUD set the 2020 median family income (MFI) at $92,700 for a
four-person household.
Page AA-20 City of Chula Vista General PlanDRAFT HOUSING ELEMENT 2021-2029
APPENDIX A
The State of California uses four income categories to determine housing affordability. These
categories are as follows:
▪ Very Low-income – Less than 50% of the median income;
▪ Low-income – 51% to 80% of the median income;
▪ Moderate-income – 81% to 120 % of the median income; and,
▪ Above Moderate-income – Greater than 120% of the median income.
Table A-15 shows the income ranges for each income category based on the 2020 HUD MFI for
Chula Vista.
Income directly affects the range of housing costs and influences housing affordability, as well as
type and whether housing is owner or renter occupied. As household income increases, it is more
likely that the household is a homeowner. As household income decreases, households tend to
pay a disproportionate amount of their income for housing and the number of persons occupying
overcrowded housing increases.
The state and federal government classify household income into several groupings based upon
the relationship to the San Diego Region Area Median Income (AMI), adjusted for household size.
The State of California utilizes the following income groups:
Table A-15
San Diego County Income Limits
Income Category Annual Income (Family of 4)
Extremely Low: 0-30% AMI < $34,650
Very Low: 31-50% AMI $34,651 - $57,750
Low: 51-80% AMI $57,751 - $92,400
Moderate: 81-120% AMI $92,401 - $111,250
Above Moderate: 120%+ AMI > $111,250
Median Income $92,700
Source U.S. Department of Housing and Urban Development 2020
Household income in Chula Vista is varied and consistent with the San Diego region average. In
2017, the median household income in Chula Vista was approximately $76,354 and
Page AA-21DRAFT HOUSING ELEMENT 2021-2029
APPENDIX A
approximately 12.3% households were considered to be in the Extremely Low-Income category,
earning 30% or less of the AMI, as shown in Table A-16.
Table A-16
Median Household Income Estimates (2017)
% Above/Below
Jurisdiction Median Household Income
Regional Median
Chula Vista $76,354 2%
Coronado $101,520 26%
National City $46,032 -63%
Imperial Beach $51,838 -44%
San Diego $75,456 1%
San Diego Region $74,855
Source: US Census Bureau, 2018 American Community Survey 5-Year
Estimates, Table DP03
Those households with incomes less than the San Diego County median of $74,855 reside
primarily in the western area of Chula Vista in zip codes 91910 and 91911, where housing is older
and lower in cost. Higher income households are residing in those areas east of I-805 in the City’s
newer master planned communities, as shown in Figure A-6.
Page AA-22 City of Chula Vista General PlanDRAFT HOUSING ELEMENT 2021-2029
APPENDIX A
Figure A-6
Page AA-23DRAFT HOUSING ELEMENT 2021-2029
APPENDIX A
The median income for Chula Vista residents more drastically demonstrates the difference in
income by tenure and by ethnicity. As shown in Table A-17, Chula Vista’s median income of
$76,354 in 2017 was slightly higher than that of San Diego County as a whole at $74,855. When
comparing income by tenure, a large difference is seen between owner-occupied households and
renter occupied households.
Table A-17
Household Income Levels
Renter- Owner- Total Percent of
Income Level Household Household
Households Households
s s
Extremely Low-income (0-30%
7,855 3,880 11,735 15.0%
AMI)
Very Low-income (31-50% AMI) 6,585 3,635 10,220 13.0%
Low-income (51-80% AMI) 7,735 6,085 13,820 17.6%
Moderate and Above Moderate
3,190 4,940 8,130 10.4%
(>80% AMI)1
100 % AMI 7,560 27,000 34,560 44.0%
Total 32,925 45,540 78,465 100.0%
Source: U.S. Dept HUD CHAS, based on 2013-2017 ACS (5-year estimates).
Note 1: HUD programs are available only to households with incomes at or below 80% AMI. Therefore, the CHAS data groups
all households above that income threshold (both moderate and above moderate-income) into one income group. HUD CHAS
2012-2016
Page AA-24 City of Chula Vista General PlanDRAFT HOUSING ELEMENT 2021-2029
APPENDIX A
2.5 Housing Inventory and Market Conditions
A City’s housing stock is the collection of all housing units located within that jurisdiction. The
characteristics of these including growth, type, age and condition, tenure, vacancy rates, housing
costs, and affordability. These are all important factors in determining the housing needs of a
community. This section details the housing stock characteristics of the City of Chula Vista to
identify how the current housing stock meets the needs of residents.
2.5.1 Housing Stock Profile
Table A-18 shows that, between 2008 and 2050, Chula Vista is expected to grow by 38% in
housing stock which is 29,515 more units. This growth is slightly higher than the San Diego
County region’s expected growth.
Table A-18
Projected Housing Units
Location 2008 2020 2035 2050 2010-50
Chula Vista 77,484 88,186 98,262 106,999 29,515
(38%)
San Diego County 1,140,654 1,262,488 1,417,520 1,529,090 388,436
(34%)
Source: SANDAG, 2013 & U.S. Census 2018 American Community Survey 5-Year Estimates
Page AA-25DRAFT HOUSING ELEMENT 2021-2029
APPENDIX A
Unit Type
Household size is a significant factor in housing demand. Different household types generally
have different housing needs. Seniors or young adults usually comprise the majority of the single-
person households and tend to reside in apartments, condominiums or smaller single-family
homes. While families with children often prefer single-family homes.
Figure A-7 shows that in 2019, the largest percentage (53%) of housing units in Chula Vista was
single-family detached units. Approximately 10% were single-family attached units, 6% were
small multi-family developments with two to four units, 26% were large multi-family
developments with five or more units, and 5% were mobile homes/trailers. Housing types in
Chula Vista are comparable to those within the San Diego County region.
Figure A-7
Page AA-26 City of Chula Vista General PlanDRAFT HOUSING ELEMENT 2021-2029
APPENDIX A
2.5.2 Tenure
Housing tenure and vacancy rates are indicators of the supply and cost of housing. Housing
tenure refers to whether a housing unit is owned or rented. Vacancy rates are indicative of
whether or not there is a sufficient supply of available housing at a given point in time. A healthy
vacancy rate is considered to be at around 5%, which demonstrates that there are desirable
housing options available.
The ratio of owner-occupied units vs. renter-occupied units is an indicator of financial stability.
In the City of Chula Vista, there are a total of 78,940 occupied housing units. Owner-occupied
dwellings account for 46,060 units (58.3%), renter-occupied dwellings account for 32,880 units
(41.7%), and the average household size is 3.2-4. US Census Bureau 2018 ACS Housing Characteristics
With single family product dominating the landscape of master planned communities located
east of I-805, most of those units are owner-occupied. However, areas west of I-805 are
predominately renter-occupied.
Page AA-27DRAFT HOUSING ELEMENT 2021-2029
APPENDIX A
Figure A-8
Page AA-28 City of Chula Vista General PlanDRAFT HOUSING ELEMENT 2021-2029
APPENDIX A
2.5.3 Vacancy Rates
Vacancy rates are an indicator of supply and demand. Low vacancy rates suggest households
may have trouble finding housing with an affordable monthly payment. A high number of vacant
units indicate an over-supply of housing units. A four to six percent vacancy rate is considered
“healthy”. A balanced vacancy rate for a community is typically around 5%. Vacancy rates lower
than 5% favor landlords and can signal a shortage of choice for renters, while vacancy rates above
5% favor renters. As seen in Table A-19, Chula Vista has lower than typically healthy vacancy
rates.
Table A-19
Chula Vista Vacancy Rates and Property Age
91907,09,10,11,12,13,14,15
Zip Codes
Percent Vacant 3.10%
Total Units 3333
All Units Number Vacant 104
Percent Vacant 4.10%
Total Units 684
Over 25 Years Number Vacant 28
Percent Vacant 2.80%
Total Units 356
6 to 25 Years Number Vacant 10
Percent Vacant 2.80%
Total Units 177
Less Than 6
Number Vacant 5
Years
Percent Vacant 3.00%
Property Age Total Units 1685
Undefined
Number Vacant 51
Source: “San Diego 2019 Vacancy & Rental Rate Survey.” Socalrha.org,
2019.”
Page AA-29DRAFT HOUSING ELEMENT 2021-2029
APPENDIX A
Table A-20 shows the vacancy rate by household types in Chula Vista.
Table A-20
Chula Vista Vacancy Rate by Housing Type
Description Total Housing Units Households Vacancy Rate
Single Family – Detached 40,954 39,589 3.3%
Single Family – Attached 9,656 9,235 4.4%
Multi-Family 28,499 27,755 2.6%
Mobile home or Other 3,685 3,635 1.4%
Total Housing Units 82,794 80,214 3.1%
Source: SANDAG Demographic and Socioeconomic Estimates Chula Vista
Page AA-30 City of Chula Vista General PlanDRAFT HOUSING ELEMENT 2021-2029
APPENDIX A
2.5.4 HOUSING PROBLEM CHARACTERISTICS
The Comprehensive Housing Affordability Strategy (CHAS) provides detailed information on
housing needs by income level for different types of households in Chula Vista. Detailed CHAS
data based on the 2012-2016 ACS is displayed in Table A-21. Housing problems considered by the
CHAS include:
- Units with physical defects (lacking complete kitchen or bathroom);
- Overcrowded conditions (housing units with more than one person per room);
- Housing cost burden, including utilities, exceeding 30 percent of gross income; or
- Severe housing cost burden, including utilities, exceeding 50 percent of gross income.
63% of Chula Vista renters are experiencing at least one housing problem, with 43% experiencing
at least one severe housing problem.
Table A- 21
Owner Renter Total
Housing Problems No. % No. % No. %
Household has at least 1 of 4 Housing Problems 17,685 39% 20,545 63% 38,230 49%
Household has NONE of 4 Housing Problems 27,210 60% 11,660 36% 38,870 50%
Cost burden not available - no other problems 325 1% 380 1% 705 1%
Total Households 45,220 32,585 77,805
Severe Housing Problems Owner Renter Total
Household has at least 1 of 4 Severe Housing Problems 8,310 18% 14,055 43% 22,365 29%
Household has NONE of 4 Severe Housing Problems 36,585 81% 18,150 56% 54,735 70%
Cost burden not available - no other problems 325 1% 380 1% 705 1%
Total Households 45,220 32,585 77,805
Source: CHAS, based on 2012-2016 ACS (5-year estimates).
1. The four housing problems are: incomplete kitchen facilities, incomplete plumbing facilities, more than 1 person per room, and cost
burden greater than 30%.
2. The four severe housing problems are: incomplete kitchen facilities, incomplete plumbing facilities, more than 1.5 persons per room,
and cost burden greater than 50%.
Page AA-31DRAFT HOUSING ELEMENT 2021-2029
APPENDIX A
2.5.5 Age of Housing Stock
The age of housing is often an indicator of housing conditions. In general, housing that is 30 years or older
may need minor repair. Housing over 50 years old is considered aged and more likely to generate major
repairs. Approximately, 48% of the housing stock is over 40 years old, and 20% of the housing stock is
approaching 50 years of age or older and more likely to require major rehabilitation. Housing that is not
maintained can discourage investment, reduce neighboring property values, and negatively impact the
quality of life in a neighborhood. The age of the City’s housing stock indicates a potential need for
continued code enforcement, property maintenance and housing rehabilitation programs. US Census Bureau
2018 ACS Housing Characteristics
Table A-22
Age of Housing
Year Built No. of DUs
2014-2017 2,819
2010-2013 1,198
2000-2009 18,204
1980-1999 22,371
1960-1979 23,758
1940-1959 15,832
1939 or earlier 926
TOTAL 85,108
Source: US Census Bureau, 2018 American
Community Survey 5-Year Estimates
A high estimate of the number of units in need of rehabilitation, based solely on the age of the
housing stock is approximately 40,516 units. The low estimate for the number of housing units in
the City in need of rehabilitation is approximately 17,000 units; this low estimate considers unit
age, overcrowding, financial resources of homeowners, and plumbing facilities.
Page AA-32 City of Chula Vista General PlanDRAFT HOUSING ELEMENT 2021-2029
APPENDIX A
PRE-1940 HOUSING
The U.S. Department of Housing and Urban Development (HUD) may consider units substandard
if they were built before 1940. There are 926 units in Chula Vista that were built before 1940,
approximately 1.1% of the total housing in the City. Regionwide, 5% of units were built before
1940. US Census Bureau 2018 ACS Housing Characteristics
2.5.6 Housing Conditions
Housing is considered substandard when it is below the minimum standard of living conditions
defined in the Uniform Housing Code, Section 1001.
In addition to structural deficiencies and standards, the lack of infrastructure and utilities often
serves as an indicator for substandard conditions. Another measure of the City’s housing
condition is the number of substandard housing units. Housing is considered substandard when
conditions are below the minimum standards of living as defined by Section 1001 of the Uniform
Housing Code. Households living in substandard housing may be exposed to health or safety
threats, which, in turn, could adversely affect the safety and quality of life of neighborhoods.
Such households are considered in need of housing assistance to correct any serious health or
building safety issues such as structural, plumbing, mechanical or electrical problems, and
presence of unhealthy conditions or materials, (e.g. asbestos and lead-based paint). In addition
to structural problems (sagging roofs, walls or porches, lack of or failing building foundation,
termite infestation, etc.), the lack of certain basic facilities may also indicate substandard
conditions. The United States Department of Housing and Urban Development (HUD) includes
the lack of kitchen facilities and lack of plumbing facilities as two out of four housing problems in
their Comprehensive Housing Affordability Strategy (CHAS) data.
According to the 2018 American Community Survey (ACS) 5-Year Estimates, there were 84 (0.1%)
units in the City that lacked complete plumbing facilities. For Census purposes, complete
plumbing facilities included: (1) hot and cold piped water; (2) a flush toilet; and (3) a bathtub or
shower. All three must be located inside a unit to be recognized as having full plumbing facilities.
According to the 2018 ACS data, 147 (0.2%) units lacked complete kitchen facilities. The U.S.
Census defines a complete kitchen as a unit with a sink & faucet, a stove, and a refrigerator. There
were 2,038 units with no heating source, and 383 units that relied on heating oil, kerosene, coal,
wood, or other heating fuel.
Page AA-33DRAFT HOUSING ELEMENT 2021-2029
APPENDIX A
2.5.7 Housing Costs & Rents
This section discusses the price of new and existing housing as well as average costs of rental
housing in Chula Vista.
Housing costs are indicative of housing accessibility to all economic levels of a community.
Typically, if housing supply exceeds housing demand, housing costs fall. Inversely, if housing
demand exceeds housing supply, housing costs will rise. Housing affordability is dependent upon
income and housing costs. The Federal standard of rental affordability is that a household should
spend no more than 30% of its gross monthly income on monthly housing costs and utilities. In
Chula Vista, housing costs tend to be a little lower when compared to the San Diego County. The
high cost of housing can be attributed to factors such as higher land costs and suburban
community. This section summarizes the cost and affordability of the housing stock to Chula Vista
residents.
New and Resale Housing
The median household value in 2010 was $337,000. The median household value increased by
59% to $565,000 by 2020 and housing values are expected to continue to grow. Shown in Table
A-23, the median sales price in 2019 for a single-family home in Chula Vista was approximately
$614,000, lower than the San Diego County median sales price. Zillow, Inc. “Chula Vista CA Home Prices &
Home Values.”
Page AA-34 City of Chula Vista General PlanDRAFT HOUSING ELEMENT 2021-2029
APPENDIX A
Table A-23
Median Sales Price of Homes Sold in 2019
Detached (Single-Family) Attached (Condo/Townhome)
Zip Market Area Sold Median
Sold Listings Median Price
Listings Price
91910 Chula Vista North 366 $561,000 134 $370,000
91911 Chula Vista South 325 $516,000 144 $350,000
Chula Vista
91913 445 $614,000 317 $410,000
Eastlake
91914 Chula Vista NE 179 $755,000 54 $418,250
91915 Chula Vista SE 267 $615,000 253 $440,000
TOTAL 1582 $614,000 902 $410,000
San Diego County $649,000 $427,000
Source: San Diego Association of Realtors 2019 San Diego County Summary Statistics
Both, the total price of a home and monthly payment amounts are important indicators of
affordability. Lenders typically require homebuyers to demonstrate that the total monthly loan
payment will not exceed 30% of gross monthly household income. With a median household
income in Chula Vista at approximately $76,354 annually and a calculated affordability of a home
at $250,200, homeownership is not affordable to most residents.
Page AA-35DRAFT HOUSING ELEMENT 2021-2029
APPENDIX A
Figure A-9
Source: San Diego Association of Realtors 2019 San Diego County Summary Statistics
Page AA-36 City of Chula Vista General PlanDRAFT HOUSING ELEMENT 2021-2029
APPENDIX A
Figure A-10
Source: San Diego Association of Realtors 2019 San Diego County Summary Statistics
Page AA-37DRAFT HOUSING ELEMENT 2021-2029
APPENDIX A
Rental Prices
Table A-24 shows that in the Spring of 2019 average monthly rents in Chula Vista ranged from
$1,134 for a studio apartment to $1,820 for a two-bedroom apartment and $2,213+ for three-
bedroom apartments. To be able to afford the average two-bedroom apartment, a household
would need to earn $6,070 a month or over $35.00 an hour.
Table A-24
Rental Prices by Unit Type
Fall 2018 Spring 2018
Spring 2019 Spring 2019
Average Average
Zip Codes City/Area Unit Type Units/Properties Average
Monthly Monthly
Surveyed Monthly Rent
Rent Rate
Studio 12/6 $1,134 $1,210 $1,157
91907, 1Bedroom 1314/32 $1,487 $1,539 $1,425
Chula
09,10,11,
Vista 2Bedroom 1728/38 $1,820 $1,850 $1,685
13,14,15
3+Bedroom 279/12 $2,213 $2,299 $2,000
Source: “San Diego 2019 Vacancy & Rental Rate Survey.” Socalrha.org, 2019.”
Page AA-38 City of Chula Vista General PlanDRAFT HOUSING ELEMENT 2021-2029
APPENDIX A
Affordability Gap Analysis
Housing affordability can be calculated by comparing the cost of renting or owning a home in a
community with the maximum affordable housing costs for households at different income
levels. Together, this information generally shows what types of households can afford what
types of units. This is also an indication of the type of households most likely to experience
overcrowding and overpayment.
The federal Department of Housing and Urban Development (HUD) conducts annual household
income surveys nationwide to determine a household’s eligibility for federal housing assistance.
Based on this survey, the California Department of Housing and Community Development (HCD)
developed income limits that can be used to determine the maximum price that could be
affordable to households in the upper range of their respective income category. The maximum
affordable home and rental prices for residents in San Diego County are shown in Table A-25.
Table A-25 shows the maximum amount that a household at each income level can afford for
housing each month without overpaying. This amount can be compared to current housing
prices and market rental rates to determine what types of housing opportunities a household
can afford in a community. Based upon the housing sales prices in Chula Vista as seen in Table
A-23 and A-24, there are no homes (rental or for-sale) in Chula Vista’s market that are considered
affordable to lower-income households.
For a condo priced at $370,000 in the 91910 zip code as shown in Figure A-9, a household would
need to earn $54/hour or $112,350/year to afford this condo. Similarly, a household would need
to earn $81/hour or $168,250/year to afford a single family home priced at $561,000 in the
91910 zip code. The dream of owning a home and building equity is unattainable to most without
some sacrifice such as incurring a housing cost burden, making a significant cash down payment,
or multi-generational living.
Lower-income renters must also make difficult choices related to the condition of housing,
overcrowding, or overpaying in order to maintain housing. The affordable rental rate for a 2-
bedroom unit to house a low income family is $1,029/month far exceeding the average
$1,820/month rent in Chula Vista, a gap of approximately $800/month. Larger households face
a more difficult time finding appropriately sized housing that is affordable. With a low income
family only able to afford to pay $1,154/month and an average 3-bedroom unit renting for
$2,213/month, the affordability gap is even greater at $1,059/month.
Page AA-39DRAFT HOUSING ELEMENT 2021-2029
APPENDIX A
Table A-25
Affordable Housing Costs (2020) San Diego County
Income Bedroom(s) Affordable Monthly Utility Taxes/ Affordable
Group Cost Allowance Insurance
Rent Sale Rent Sale Sale Rent Purchase
Price
0 (Studio) $486.68 Same $119 $180 $91 $368 $46,532
Extremely 1 Bedroom $556.20 Same $152 $220 $104 $404 $50,096
Low 2 Bedrooms $625.73 Same $222 $261 $117 $404 $53,447
Income 3 Bedrooms $695.25 Same $237 $323 $130 $458 $52,264
HH 4 Bedrooms $750.87 Same $271 $364 $140 $480 $53,261
0 (Studio) $811.13 Same $119 $180 $152 $692 $103,370
Very 1 Bedroom $927.00 Same $152 $220 $173 $775 $115,208
Low 2 Bedrooms $1,042.88 Same $222 $261 $195 $821 $126,616
Income 3 Bedrooms $1,158.75 Same $237 $323 $217 $922 $133,492
HH 4 Bedrooms $1,251.45 Same $271 $364 $234 $980 $140,979
0 (Studio) $973.35 $1,135.58 $119 $180 $243 $854 $118,735
Low 1 Bedroom $1,112.40 $1,297.80 $152 $220 $277 $960 $132,770
Income 2 Bedrooms $1,251.45 $1,460.03 $222 $261 $312 $1,029 $146,372
HH 3 Bedrooms $1,390.50 $1,622.25 $237 $323 $347 $1,154 $155,444
4 Bedrooms $1,505.74 $1,752.03 $271 $364 $374 $1,231 $164,773
0 (Studio) $1,784.48 $2,081.89 $119 $180 $292 $1,665 $283,161
Moderate 1 Bedroom $2,039.40 $2,379.30 $152 $220 $334 $1,887 $320,468
Income 2 Bedrooms $2,294.33 $2,676.71 $222 $261 $376 $2,072 $357,561
HH 3 Bedrooms $2,549.25 $2,974.13 $237 $323 $417 $2,312 $390,337
4 Bedrooms $2,753.19 $3,212.06 $271 $364 $451 $2,482 $418,155
Source: Source: California Department of Housing and Community Development, 2020 Income limits; and Assumptions: 2020
HCD income limits; 30% gross household income as affordable housing cost; 15% of monthly affordable cost for taxes and
insurance; 3% down payment; and 3% interest rate for a 30year fixed-rate mortgage loan.
Utilities based on San Diego County Utility Allowance. *Utilities Allowances and Taxes and Insurance costs are included in
Affordable Monthly Housing Costs
Chula Vista has a median income slightly higher than the average for the County of San Diego.
However, the growing number of households, increase in household size, and income disparity
between renter-occupied households and owner-occupied households has provided further
challenges to Chula Vista households seeking affordable housing options. Data indicates that
lower-income families and large households have limited options in finding affordable rental
housing. In addition, the median price of resale housing in Chula Vista exceeds the affordability
Page AA-40 City of Chula Vista General PlanDRAFT HOUSING ELEMENT 2021-2029
APPENDIX A
range for all income categories except above-moderate income households. Very low-, low-, and
moderate-income households may have trouble finding affordable housing that they can afford
to purchase.
Page AA-41DRAFT HOUSING ELEMENT 2021-2029
APPENDIX A
This page is intentionally blank.
Page AA-42 City of Chula Vista General PlanDRAFT HOUSING ELEMENT 2021-2029
APPENDIX A
HOUSING NEEDS
3.0
This section provides an overview of existing housing needs in the City of Chula Vista. Housing
need can be described in four categories:
▪ Housing need resulting from households overpaying for housing;
▪ Housing need resulting in overcrowding;
▪ Housing need resulting from population growth and demolition of the existing housing
stock; and,
▪ Housing need of “special needs groups” such as elderly persons, large households,
female-headed households, disabled persons, homeless persons, and farm workers.
3.1 Households Overpaying for Housing
The term “over payers” refers to households paying an excessive amount of their income for
housing. Generally, households that overpay for their housing have less disposable income
available for other needs. Calculating overpayments for housing is important as it measures local
housing conditions and reflects affordability of housing in a community.
State and federal programs typically define over payers as those lower-income households that
pay over 30% of household income for housing costs. A household is considered to experience a
severe cost burden if it spends more than 50% of its gross income on housing.
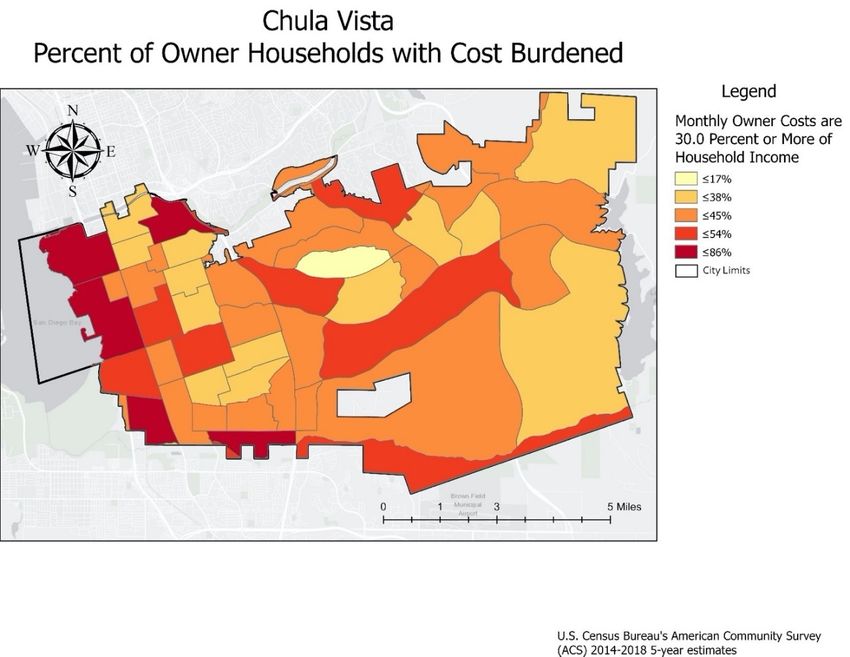
A significant number of households living west of I-805 are paying more than 30% of their income
towards housing costs in comparison to households east of I-805, as shown in Figure A-11. This
is consistent with lower-income households living primarily in the western area of the City, with
older housing stock and more multifamily housing.
Page AA-43DRAFT HOUSING ELEMENT 2021-2029
APPENDIX A
Figure A-11
Approximately, 46% of households in the San Diego region were paying over 30% of their income
toward monthly owner housing costs. Table A-26 & A-27 summarizes the 2013-2017 American
Community Survey 5-Year Estimates and shows that renters were more likely to overpay than
owners. In the region, 57% of renters overpaid; and similarly, 57% of renters in Chula Vista. In
addition, 47% of Chula Vista households were overpaying monthly homeownership costs.
Page AA-44 City of Chula Vista General PlanDRAFT HOUSING ELEMENT 2021-2029
APPENDIX A
Table A-26
Cost Burden by Income Levels-Renters
Income Level >30% >50% TOTAL
Extremely Low-income (0-30% AMI) 6,525 5,750 7,855
Very Low-income (31-50% AMI) 5,690 3,385 6,585
Low-income (51-80% AMI) 4,455 1,150 7,735
Moderate and Above Moderate (>80% AMI)1 1,070 115 3,190
100 % AMI 930 - 7,560
TOTAL 18,670 10,400 32,925
Source: U.S. Dept HUD CHAS, based on 2013-2017 ACS (5-year estimates)
Table A-27
Cost Burden by Income Levels - Owners
Income Level >30% >50% TOTAL
Extremely Low-income (0-30% AMI) 2,675 2,345 7,855
Very Low-income (31-50% AMI) 2,150 1,530 6,585
Low-income (51-80% AMI) 3,395 1,700 7,735
Moderate and Above Moderate (>80% AMI) 2,515 645 3,190
100 % AMI 4,735 250 7,560
TOTAL 15,470 6,470 32,925
Source: U.S. Dept HUD CHAS, based on 2013-2017 ACS (5-year estimates).
Figure A-12 provides more overpayment detail by income group for Chula Vista. Over 58% of the
lower-income renter households are paying more than 30% of their income towards housing,
with 26% of those households paying over 50% of their income. For those very low and low-
income households, a significant number of these households are paying more than 30%. For
those households with higher incomes, only 34% of moderate and above moderate-income
households are cost burdened.
In the case of homeownership, the opposite is true, with 79% of moderate and above moderate
households paying more than 30% of their income towards housing costs while 34% of very low-
income households and 44% of lower-income households are facing a cost burden. The
availability of affordable housing for ownership is likely the cause of the cost burden discussed in
the Housing Affordability section.
Page AA-45DRAFT HOUSING ELEMENT 2021-2029
APPENDIX A
Figure A-12
3.2 Overcrowding
A combination of low-incomes and high housing costs has forced many households to live in
overcrowded housing conditions. “Overcrowding” is generally defined as a housing unit occupied
by more than one person per room in house (including living room and dining rooms).
Overcrowding can be an indication of an inadequate supply of affordable housing, especially for
large families and households whose incomes fall below AMI.
As seen in Table A-28, 6% of households had more than one occupant per room and only 3% had
more than 1.5 occupants per room.
Table A-28
Overcrowded Households
Description No. %
Overcrowded
5,072 6%
(1.01 to 1.50/room)
Severe Overcrowding
2,468 3%
(1.51 or more/room)
TOTAL Occupied housing units 78,940
Source: US Census Bureau, 2018 American Community Survey 5-Year Estimates, Table DP04
Page AA-46 City of Chula Vista General PlanDRAFT HOUSING ELEMENT 2021-2029
APPENDIX A
The data in Table A-29 shows that overcrowding affects lower-income renter households
disproportionately, with 15% low-income renters experiencing overcrowding and approximately
39% of very low and extremely-low-income renters.
Table A-29
Overcrowding by Housing Type and Income Levels
Renter Owner
Description 0-30% >30-50% >50-80% 0-30% >30-50% >50-80%
AMI AMI AMI AMI AMI AMI
Single-family
1,355 1,125 860 254 255 220
households
Multiple, unrelated-
160 170 260 40 80 220
family households
Other, non-family
- - 14 - 10 -
households
Total need by 1,515 1,295 1,134 294 345 440
income 19% 20% 15% 8% 9% 7%
TOTAL
7,855 6,585 7,735 3,880 3,635 6,085
HOUSEHOLDS
Source: U.S. Dept HUD CHAS, based on 2013-2017 ACS (5-year estimates).
3.3 2010-2020 Growth Needs
The State Department of Finance (DOF) is responsible for projecting the total statewide housing
demand, with the State Department of Housing and Community Development (HCD)
apportioning this demand to each of the state’s regions. This demand represents the number of
additional units needed to accommodate the anticipated growth in the number of households,
to replace expected demolitions and conversions of housing units to non-housing uses, and to
achieve a future vacancy rate that allows for healthy functioning of the housing market.
Page AA-47You can also read