ENERGY CHAMPION CLG (ENERGY CORK) ENERGY MASTER PLAN - CORK CITY and COUNTY
←
→
Page content transcription
If your browser does not render page correctly, please read the page content below
CORK ENERGY CHAMPION - ENERGY MASTER PLAN

                ENERGY CHAMPION CLG (ENERGY CORK)
             ENERGY MASTER PLAN – CORK CITY and COUNTY
   Report on Baseline Energy Balance, Renewable Energy Potential and
                        Register of Opportunities

Report prepared by: Kevin Curtin, Survey and Design Services, Shay Kavanagh, Fuinniv
                              Independent Consulting

                                                        21st JUNE 2019

                                                                                       1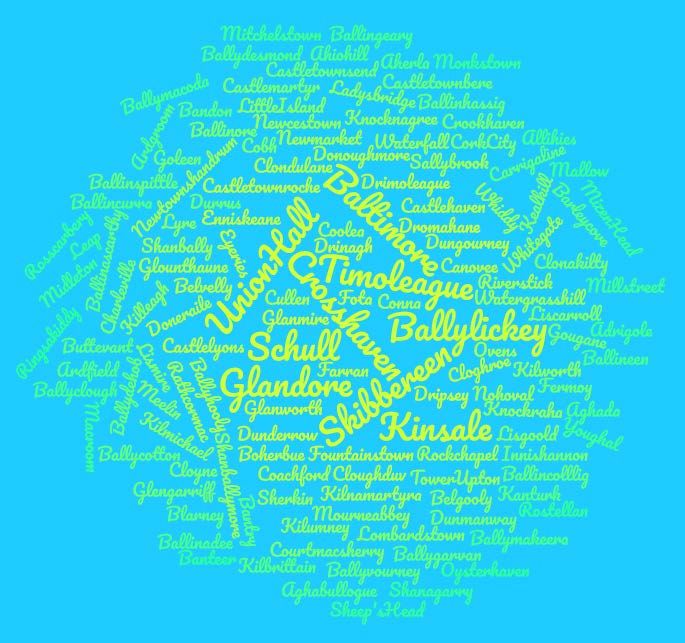
CORK ENERGY CHAMPION - ENERGY MASTER PLAN

Contents

1      Introduction and Overview ............................................................................................................. 4
2      Legislation and Policy Background .................................................................................................. 9
    2.1        EU LEVEL.................................................................................................................................. 9
    2.2        NATIONAL LEVEL ................................................................................................................... 10
    2.3        LOCAL LEVEL.......................................................................................................................... 11
3      Baseline Energy Usage (2016) ....................................................................................................... 19
    3.1        Introduction .......................................................................................................................... 19
    3.2        Methodology and Findings – Residential Sector .................................................................. 19
    3.3    Methodology and Findings – Non-Residential (Private Tertiary, Public/Schools, Non-ETS
    Industry) ............................................................................................................................................ 21
    3.4        Methodology and Findings – Municipal and Local Authority ............................................... 22
    3.5        Methodology and Findings– Fisheries and Agriculture ........................................................ 23
    3.6        Methodology and Findings – Transport ................................................................................ 24
    3.7        Summary of Final Energy Consumption and Related Emissions ........................................... 26
    3.8        Summary of Final Energy Fuel Mix and Energy Costs ........................................................... 30
4      Contribution of Renewable Technologies (Existing) ..................................................................... 32
    4.1        Grid-Connected Onshore Wind Power Plants (Fully Connected) ......................................... 32
    4.2        Grid-Connected Hydroelectric Power Plants ........................................................................ 33
    4.3        Grid-Connected Power Plants (Bioenergy) ........................................................................... 34
    4.4        SUMMARY – CONTRIBUTION FROM RENEWABLE TECHNOLOGIES ..................................... 34
5      Register of Opportunities.............................................................................................................. 35
6      Commentary on Register of Energy Demand Reduction Opportunities....................................... 38
    6.1        Residential............................................................................................................................. 38
    6.2        Non-Residential..................................................................................................................... 39
    6.3        Municipal and Local Authority .............................................................................................. 39
    6.4        Fisheries and Agriculture ...................................................................................................... 40
    6.5        Transport............................................................................................................................... 40
    Summary – Energy Demand Reduction Measures ........................................................................... 41
7      Commentary on Register of Renewable Energy Contribution Opportunities .............................. 42
    7.1        Residential............................................................................................................................. 42
    7.2        Non-Residential..................................................................................................................... 42
                                                                                                                                                           2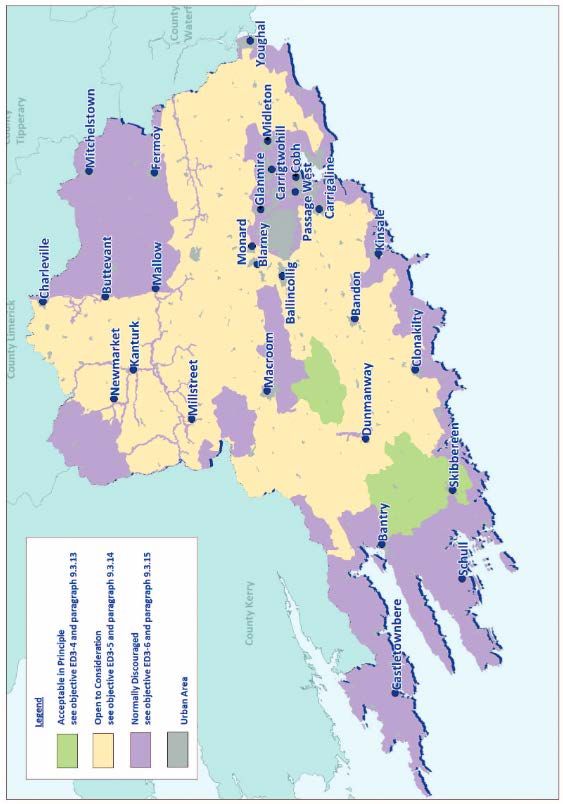
CORK ENERGY CHAMPION - ENERGY MASTER PLAN

    7.3        Municipal and Local Authority .............................................................................................. 42
    7.4        Fisheries and Agriculture ...................................................................................................... 43
    7.5        Transport............................................................................................................................... 43
    7.6        Large-Scale Deployment ....................................................................................................... 43
8      NEXT STEPS ................................................................................................................................... 46
9      APPENDICES .................................................................................................................................. 49
    9.1        APPENDIX 1: RESOURCE MAPS ............................................................................................. 50
Acronyms .............................................................................................................................................. 52

                                                                                                                                                        3
CORK ENERGY CHAMPION - ENERGY MASTER PLAN

1 Introduction and Overview
Energy Champion (Energy Cork), a registered member of the Sustainable Energy Authority of
Ireland’s (SEAI) Sustainable Energy Communities (SEC) Network, has entered into a three-year
Partnership Agreement with SEAI. The objectives of the SEC program are to:
        ∼ Increase energy efficiency
        ∼ Use renewable energy
        ∼ Develop decentralised energy supplies
Step 2 of this 5-step process involves the preparation of an Energy Master Plan (EMP) for the
SEC territory (Study Area) to establish the baseline energy consumption for an agreed year,
and the formulation of a Register of Opportunities that will deliver significant energy demand
reductions and contributions from renewable energy sources. In this particular case, the
Study Area consists of all of Cork City and County (pop.519,032). For the purposes of this
study, the city boundary is assumed to be that in place up to 2019.
Energy Champion has set the EMP baseline year at 2016. They would also like to commit to
ambitious energy demand reduction and renewable contribution targets by 2030. From the
analysis detailed below, the projected achievable out-turns for these targets by 2030 are
34.6% energy demand reduction and 53.51% renewable energy contribution.
The main suggested energy demand reduction actions involve:
    ∼ a medium energy retrofit of 75% of all dwellings in the city and county
    ∼ energy retrofit of buildings in the non-residential section to deliver 40% energy
       demand reduction
    ∼ deployment of EV/CNG vehicles, modal shift and efficient driving in the transport
       sector
    ∼ the above actions have the potential to deliver 42.2%, 37.8% and 17% respectively of
       the overall energy demand reduction target of 34.6%.
The main suggested renewable energy contribution actions involve:
    ∼ deployment of heat pumps in 75% of all dwellings in the city and county (as part of
       the medium retrofit mentioned above).
    ∼ deployment of currently contracted onshore wind generation capacity of 285.36MW.
       (For the purposes of this study, deployment of additional onshore wind generation
       capacity, in excess of the currently contracted capacity of 285.36MW, was not
       considered).
    ∼ 20% renewable gas on gas grid by 2030.
    ∼ Biofuels Obligation Scheme
    ∼ deployment of PV by non-residential sector to deliver 30% of electricity demand
    ∼ the above actions have the potential to deliver 20.6%, 14.3%, 10.4%, 6.7% and 6.5%
       respectively of the overall 2030 energy demand.
    ∼ It is projected that the currently-deployed renewable generation capacity of
       488.1MW will meet 16% of the 2030 energy demand.

                                                                                            4
CORK ENERGY CHAMPION - ENERGY MASTER PLAN

The view was taken that offshore wind, wave and tidal power renewable technologies are not
likely to be deployable on the southern seaboard by 2030. This is primarily due to the long
lead-times involved. However, it is also submitted that initial roll-out of such technologies in
Ireland is likely to be located closer to the high electricity demand that exists adjacent to the
Irish Sea on the eastern seaboard; tamer weather conditions also prevail on the eastern
seaboard which is more conducive to early adoption of this relatively developmental
technology.
The projected capital expenditure required to deploy the required energy demand reduction
and renewable contribution measures amounts to €8,225.5M and €1,664.7M respectively.
This latter amount does not include provisions for expenditure in relation to grid-scale
onshore wind, grid-scale PV or renewable gas initiatives.
It is projected that the energy demand reduction and renewable technology initiatives
detailed below can deliver an annual energy spend saving of €476M approx (excluding
increases in fuel/carbon prices or impacts of carbon fines).
The baseline energy balance is prepared on the basis of final energy usage (delivered energy),
by fuel type, (using the methodologies detailed in Section 3 hereunder) for each of the
following sectors:

                                          SECTORS
                  1                     Residential Buildings
                  2                       Non-Residential
                         Commercial and Public Buildings (schools, health
                                            facilities, etc)
                  3                Municipal and Local Authority
                          (this section includes local authority buildings,
                             transport, public lighting, water supply &
                                        wastewater services)
                  4                   Fisheries and Agriculture
                  5          Transport (excl local authority transport)

                                                                                               5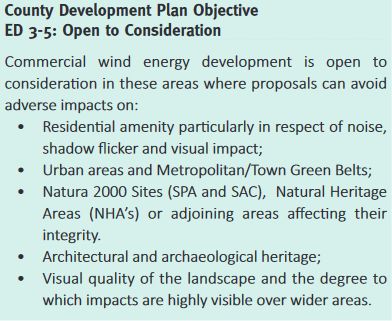
CORK ENERGY CHAMPION - ENERGY MASTER PLAN

         TOWNS IN COUNTY CORK

                                            6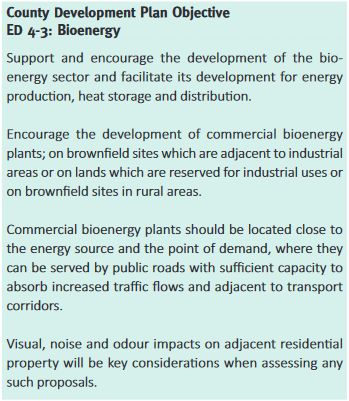
CORK ENERGY CHAMPION - ENERGY MASTER PLAN

The Baseline Energy Balance and Register of Opportunities for the residential and non-residential
sectors are prepared on the basis of standard occupancy. Standardised occupancy is the approach used
in calculating energy usages in Ireland’s Building Energy Rating programmes and CIBSE benchmarking. It
enables a fair “like with like” comparison between baseline and retrofitted buildings and enables use of
energy modelling tools in calculating the associated savings.
The impacts of seasonality are not considered.
In respect of the Register of Opportunities, the three main actions that will deliver the required energy
demand reduction are:
    1. Medium-depth energy retrofit of 75% of all dwellings (42.31% of overall energy demand
       reduction).
    2. Energy retrofit across the non-residential buildings sector to achieve 40% energy demand
       reduction (37.89% of overall energy demand reduction).
    3. Deployment of EV’s/CNG vehicles (cars, busses, trucks) and also electric rail on the main
       Cork/Dublin line (16.83% of overall energy demand reduction).
The methodologies outlined in this document could potentially be shared with SEC’s throughout the City
and County, in order to help build knowledge and capacity within such community groups. It will also
assist them to get an understanding of the types of measures and impacts that an energy transition
within their territory will require.
Given the enormity of the scale of interventions required to delivery change, it is submitted that the
following barriers need to be addressed as a matter of urgency (nationally and locally):
    1. CALLS TO ACTION: Current inertia must be overcome in order to accelerate activity and create a
       non-reversible momentum towards change in energy performance of buildings; creation of new
       and novel channels of communications (preferably bottom-up, rather than continuation of top-
       down channels), as well as minimisation of market uncertainties, will be crucial.
    2. HUMAN CAPITAL: There are serious supply chain issues in terms of trained personnel (professional
       and trades-based) which are very significant impediments in the drive towards broad and deep
       retrofit.
    3. HUMAN CAPITAL: Resources to monitor and maintain new technologies are currently noticeably
       scarce – this is a major barrier to deployment of new technologies.
    4. FINANCIAL CAPITAL: It is apparent that mobilization of the necessary financial capital to fund the
       required sea-change in retrofit activity will be a major issue among property-owners. Innovative
       interventions by the energy supplier community, and energy technology suppliers, will be required
       to deploy performance-based solutions with appropriate distribution of risk.
It should be noted that Energy Cork is already involved in a number of very worthwhile initiatives:
    ∼ Drive4Zero. This project aims to facilitate enhanced uptake of EV’s in the following manner:
          o Zero car fuel costs through increased deployment of free charging units at places of
             employment
          o Zero car parking costs at certain car-parks.
          o Zero interest-rate financing & zero deposit financing for purchase of certain EV’s
    ∼ Ireland’s Greenest Bus Fleet. This project initially aims to introduce 20 no. CNG fueled busses,
      and a re-fueling infrastructure, to the Bus Eireann city bus fleet in Cork for use on certain bus
                                                                                                          7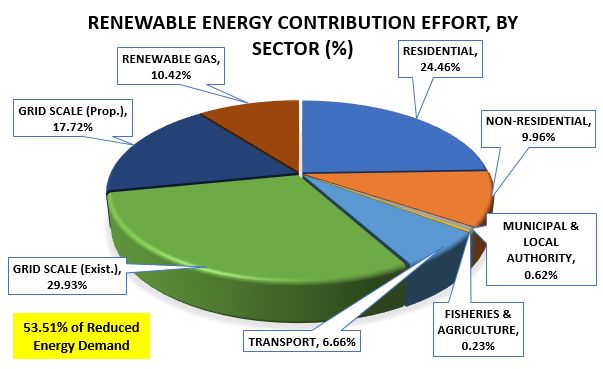
CORK ENERGY CHAMPION - ENERGY MASTER PLAN

routes. The longer-term aim is to integrate the entire city service bus fleet to CNG fuel, subject
to funding availability. The adoption of a CNG bus fleet will create a pathway for the use of
Renewable Natural Gas (RNG) as a transport fuel, thus enabling near carbon-zero public bus
transport. The current projection is that there will be 20% renewable on the gas grid by 2030.

                                                                                                     8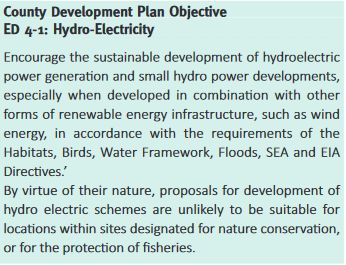
CORK ENERGY CHAMPION - ENERGY MASTER PLAN

2 Legislation and Policy Background
2.1   EU LEVEL

ENERGY PERFORMANCE OF BUILDINGS DIRECTIVE
A revised Energy Performance of Buildings Directive was published by the EU in Summer 2018 and must
be transposed into law in EU Member States by March 2020. The main changes will be:
    ∼ Targets: Member States must achieve decarbonized building stock by 2050 using a cost-effective
        combination of energy efficiency and decarbonized energy supply. This must be guided by national
        milestones for short-term (2030), mid-term (2040) and long-term (2050) objectives.
    ∼ ICT/Smart Technologies: Promotion of ICT/smart technologies, communications and building
        automation/control systems. The “smart readiness factor” will measure the building’s ability to
        use ICT to adapt building operation to the needs of the grid. This should help occupants understand
        energy usage and savings achieved by installed smart technologies.
    ∼ E-Mobility: Promotion of electromobility (i.e. promotion of electric cars)
    ∼ Renovation Strategies: The reference to national long-term building renovation strategies has
        been moved to and strengthened in the EPBD (this originally resided in the Energy Efficiency
        Directive). “Each Member State shall set out a roadmap with measures and domestically
        established measurable progress indicators, with a view to the long-term 2050 goal of reducing
        greenhouse gas emissions in the Union by 80-95% compared to 1990”.
    ∼ Financing: The EPBD seeks to mobilise financing/investment from public and private sources.
ENERGY EFFICIENCY DIRECTIVE (2012)
A 2016 update of this Directive establishes a set of binding measures towards helping the EU to reach a
30% energy efficiency target by 2030. National measures to be adopted include the following:
   ∼ Energy distributors/sales companies to drive 1.5% energy savings per year through energy
      efficiency measures
   ∼ Public sector to procure energy efficient buildings, products and services
   ∼ Governments to carry out energy efficient renovations to at least 3% of the buildings they
      own/occupy per year
   ∼ Easy and free access to energy data to be provided to energy consumers
   ∼ Incentivize energy audits for SME’s
   ∼ Mandatory energy audits for large companies
RENEWABLE ENERGY DIRECTIVE
A 2016 update of this Directive requires the EU to fulfill at least 27% of its total energy needs with
renewables by 2030.
EU CLIMATE AND ENERGY FRAMEWORK
This Policy sets the following 2030 targets (from 1990 levels):
    ∼ At least 40% GHG emission reductions (binding)
    ∼ At least 27% share for renewable energy (binding)
    ∼ At least 27% improvement in energy efficiency (endorsed)

                                                                                                         9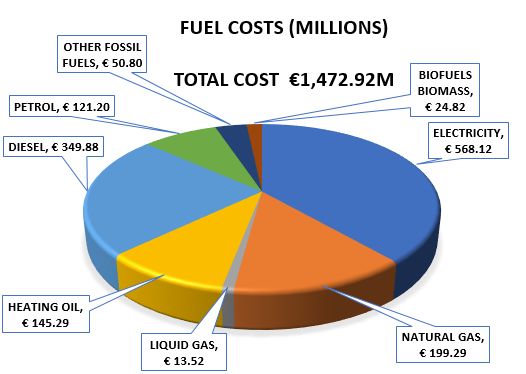
CORK ENERGY CHAMPION - ENERGY MASTER PLAN

2.2   NATIONAL LEVEL

CLIMATE ACTION AND LOW CARBON DEVELOPMENT ACT (2015)
This is the first ever climate legislation in Ireland and provides a statutory basis for the national objective
of transitioning to a low carbon economy by 2050. It enshrines the commitment of the State to GHG
mitigation and adaptation measures as well as providing approval for the plans underpinning this
transition, namely the National Mitigation Plan and National Adaptation Framework.
IRELAND’S TRANSITION TO A LOW CARBON ENERGY FUTURE 2015-2030
This White Paper sets out the framework to guide energy policy to 2030, with the long-term vision of
reducing GHG emissions by 80%-95% by 2050 (compared to 1990 levels). The Plan envisages the Citizen
being at the center of the required energy transition: the change “from passive consumer to active citizen”
and citizen engagement are key principals of this Plan.
NATIONAL ENERGY EFFICIENCY ACTION PLAN (NEEAP4) 2017-2020
NEEAP4 sets a target of 20% improvement in energy efficiency by 2020 and a more ambitious target of
33% in respect of the public sector. It sets out the scale of energy and emission savings achieved per sector
by 2016 and projects the levels of savings envisaged by 2020 under various scenarios. It also sets out
details of measures and programs that will deliver towards the savings targets in each sector.
NATIONAL MITIGATION PLAN 2017
This first whole-of-government plan sets out the multiple measures requires across several Government
Departments to enable the required transition “to a low carbon, climate resilient and environmentally
sustainable economy by 2050”. In particular, it sets out measures to facilitate the decarbonization of
electricity generation, built environment, transports and agriculture/forestry/land use.
NATIONAL RENEWABLE ENERGY ACTION PLAN 2010
This sets out national targets in respect of the share of energy from renewable sources to be consumed
in transport, electricity and heating/cooling in 2020.

National Headline Energy and Emissions Targets        Source: Ireland’s Energy Projections, 2017 (SEAI)

                                                                                                            10
CORK ENERGY CHAMPION - ENERGY MASTER PLAN
CLIMATE ACTION PLAN 2019
This document openly acknowledges, at the very outset, that ”Ireland is way off course” in respect of
arresting it’s GHG emissions. Furthermore, this gap-to-target is currently widening due to recent growth
in emissions. This plan commits to detail the changes required to provide a pathway to 2030, which will
be consistent with achieving a net zero emissions target by 2050. The following sets out a number of the
objectives included in the Plan:
∼ Electricity
o Increase share of renewable electricity from 30% to 70%, with peat and coal plants closing
o Support scheme for micro-generation
∼ Buildings
o Introduce stricter requirements for new buildings and substantial refurbishments
o 500,000 homes to be upgraded to B2 (BER)
o Heat pumps to be fitted to 400,000 existing homes
o Increase attention to Energy and Carbon ratings in all aspects of managing property
assets
∼ Transport
o Target of 950,000 EV’s on road by 2030
o Make the economy less transport-intensive
o Increase biofuel content for motor fuels
o Conversion of public transport fleet to zero carbon alternatives
∼ Agriculture
o Deliver verifiable GHG abatement through improved farming practices
o Carbon abatement through increased forestry planting and soil management
∼ Enterprise and Services
o Embed energy efficiency, replacement of fossil fuels, careful management of materials and
waste across all enterprises and public service bodies.
o Create centres of excellence for the adoption of low carbon technologies
∼ Waste and the Circular Economy
o Reduction strategies for plastics, food waste and resource use
o Increased levels and quality of recycling
o Reduced reliance on landfill
2.3 LOCAL LEVEL
CORK COUNTY DEVELOPMENT PLAN 2014
ENERGY (Chapter 9.1)
Cork plays a strategic role in energy provision in Ireland, in terms of conventional fossil fuel power stations
and hydroelectric plants: in 2010, it produced 24% of Ireland’s energy end-use requirements.
Whitegate, in East Cork, nationally plays a strategic role in energy supply with 25% of all national energy
produced in one square mile. Also, 90 per cent of the oil reserves held in the state are stored here and
elsewhere in the Cork region. The Kinsale Field off the south west coast of Cork was, until relatively
recently, the States sole natural gas field. This is also the location of Ireland’s only strategic gas storage
facility with gas imports used to refill this storage facility in addition to site production.
11CORK ENERGY CHAMPION - ENERGY MASTER PLAN
“Energy generation and energy related activity in Cork is likely to change significantly over the coming
years as the oil finds in Cork become operational and as the move to a low carbon economy increases”.
The Whitegate area, on the eastern shore of Cork Harbour has a nationally important role in this sector
and is the location for three gas–fired power stations. Whitegate is also the location of the country's only
oil refinery - the refinery has potential to facilitate the delivery of national bio substitution targets; it also
has additional potential for future gas storage and carbon capture facilities.
RENEWABLE ENERGY (Chapter 9.2)
The development of renewable energy sources is central to overall energy policy in Ireland. This Plan aims
to support the sustainable development of renewable energy sources.
In order to highlight the benefits of a move towards reduced greenhouse gas emissions, the Council will
require all renewable energy developments to indicate clearly the overall net carbon benefit arising from
their proposed developments.
Through the delivery of a low carbon energy framework, the County Council aims to attract inward
investment to the County and the wider Southwest Region. County Cork is well positioned to become self-
sufficient in renewable energy. It is important therefore that Cork County sets out its ambitions with
regard to renewable energy in this context and shows its ability to help contribute to achieving these
national targets. This would build on successes to date in the provision of renewable energy from hydro
power and onshore wind energy generation.
This Plan sets out a plan-led approach to onshore wind energy development in County Cork and identifies
suitable areas for sustainable wind energy development.
County Cork has the largest wind energy capacity in the Country at present with 283MW from 20wind
farms which is approximately 13.8% of Ireland's overall wind energy production. The wind farms are
currently concentrated in three main locations in the county; south of Millstreet in the Derrynasaggart
Mountains; east of Millstreet in the Boggeragh Mountains and South of Dunmanway. There is
considerable potential for additional wind energy capacity if all the granted and pending wind farm
developments are constructed. (This data is now out-of-date as evident from findings below).
12CORK ENERGY CHAMPION - ENERGY MASTER PLAN
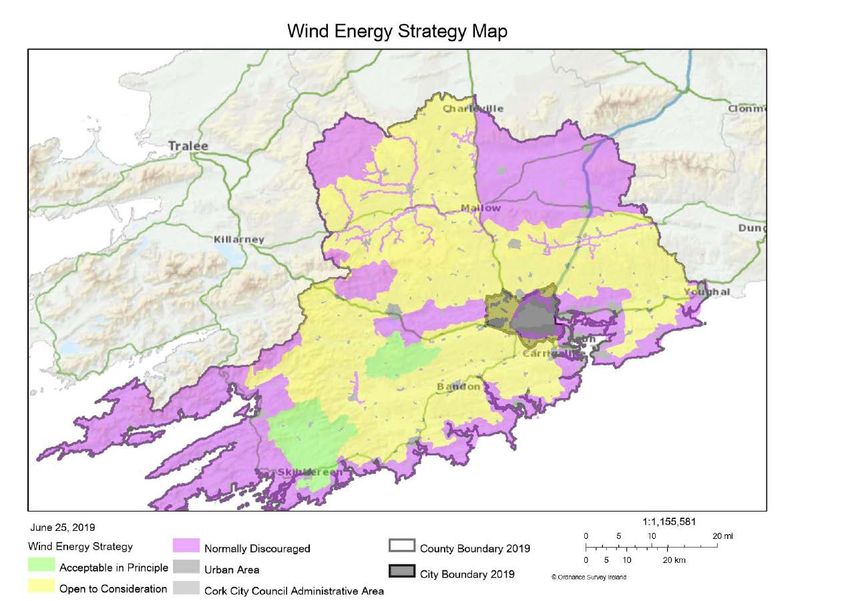
COUNTY DEVELOPMENT PLAN 2014 (Figure 9.3) WIND ENERGY STRATEGY MAP
13CORK ENERGY CHAMPION - ENERGY MASTER PLAN
This policy refers to optimal locations for wind farm development (north of Skibbereen and south of
Macroom)
This policy refers to almost 50% of the County area.
14CORK ENERGY CHAMPION - ENERGY MASTER PLAN
15CORK ENERGY CHAMPION - ENERGY MASTER PLAN
CORK COUNTY SUSTAINABLE ENERGY ACTION PLAN 2010 - 2020
The Actions proposed within this Plan are largely inwardly focused on activities within the control of Cork
County Council only, and have been identified under the following headings:
∼ Procurement
∼ Transport
∼ Water Production
∼ Wastewater Treatment
∼ Buildings/ICT
∼ Public Lighting
∼ Fleet
CORK CITY DEVELOPMENT PLAN 2015 - 2021
This is the main strategic planning policy document for the city of Cork and is set within the framework
provided by the National Spatial Strategy 2002-2020 and South West Regional Planning Guidelines 2010-
2022. It has also been prepared having regard to a number of policies/guidelines including the National
Climate Change Strategy 2007-2012 and The National Climate Adaptation Framework.
“The vision for Cork City over the period of this Development Plan and beyond is to be a successful,
sustainable regional capital and to achieve a high quality of life for its citizens and a robust local
economy…”
16CORK ENERGY CHAMPION - ENERGY MASTER PLAN
CORK CITY SUSTAINABLE ENERGY AND CLIMATE ACTION PLAN 2018
This document sets out to establish a framework within which strategic national and local targets on
energy and energy related carbon emissions can be addressed in a Sustainable Energy and Climate Action
Plan. The objectives of the plan are primarily under the topic of Energy Efficiency and Conservation. In
particular, 6 themes were identified that relate directly to the National Energy Efficiency Action Plans:
Residential Buildings, Municipal Buildings, Tertiary Buildings, Public Lighting, Transport and Local
Electricity/Heat/Cold Production.
A total of 23 no. Mitigation Actions were identified to enable achievement of the required 40% CO2
emission reduction target by 2030. These Actions are further categorized into actions required over the
2018-2022, 2018-2026 and 2018-2030 periods, to reinforce the criticality of early and ongoing progress if
the stated emission reduction target is to be met. A number of the approaches in the Cork City SECAP are
relevant to, and used in, the development of this EMP.
CORK METROPOLITAN AREA TRANSPORT STRATEGY (CMATS) 2040
This draft transport strategy for the Cork Metropolitan Area (CMA), which is currently in a consultation
period, is being developed by the National Transport Authority, Cork City Council and Cork County Council.
The key premise of the strategy is that the population of the CMA is projected to increase by 50% to 60%
by 2040 (current CMA population 305,000 1). The current transport mode shares are: car (74%), walking
(20%), public transport (5%) and cycling (1%). The key proposed strategies of CMATS are as follows:
∼ LAND USE
o Increased density of future residential and employment developments in central locations
o Consolidated development in the short term that can avail of exist transport infrastructure
o Encouragement of mixed-use development to minimize travel distances
o Encouragement development in locations that prioritises walking and cycling, while also
enabling efficient public transport provision
∼ WALKING (90M annual trips)
o A 63% increase in walking trips, with a focus on the AM peak period
o 24,000 daily car trips transferred to walking
o Age-friendly town centres; safer routes to school
∼ CYCLING (19.5M annual trips)
o 24,000 daily car trips transferred to cycling, with a focus on the AM peak period
o Development of primary, secondary, inter-urban and greenway cycling network
o Enhancement of bicycle-sharing & end-of-trip facilities
∼ BUS CONNECTS (carrying 85M passengers pa)
o Target of carrying 49,000 passengers in AM peak period
o Creation of Douglas and Summerhill North bus corridors (3-minute frequency)
o Creation of cross-city, orbital and radial routes.
∼ SUBURBAN RAIL (16M passengers pa)
o 62km suburban rail network between Midleton, Cobh and Mallow
o Development of 8 no. new stations
1
CSO, 2016
17CORK ENERGY CHAMPION - ENERGY MASTER PLAN
∼ LIGHT RAIL (46M passengers pa)
o Development of 17km of east-west routes Ballincollig-Cork City Centre-Kent Station-Cork
Docklands-Mahon Point
o 27 no. trams, 5-minute intervals
∼ ROADS
o 50km National Road network improvements, Dunkettle Interchange upgrade, M28 (Cork-
Ringaskiddy), N27 (Cork Airport) dedicated public transport corridor, Cork North Ring Road,
N40 demand reduction management
o 70km Regional Road improvements, Northern & Southern Distributor roads, HGV
restrictions in City Centre
∼ PARKING
o No car-parking requirement for new development
o Reduction of on-street car-parking
o Provision of 6 no. park & ride sites
18CORK ENERGY CHAMPION - ENERGY MASTER PLAN
3 Baseline Energy Usage (2016)
3.1 Introduction
The Baseline Energy Usage (BEU) for 2016 in the Study Area includes the key sectors of the local economy
i.e. residential, non-residential (private tertiary/public/industry), local authority, agriculture/fisheries and
transport. The energy usage profile of each sector was developed using bottom up data that reflect local
conditions, wherever possible. Where localized data was insufficient, we leveraged sectorial national
energy usage statistics published by SEAI and CSO, and applied socio-economic multipliers reflecting the
size of local sectorial activity.
3.2 Methodology and Findings – Residential Sector
The approach to dwellings is based on use of the RetroKit Version 1.0 www.retrokit.eu software analysis
tool. RetroKit was developed by XD Sustainable Energy Consulting Ltd (XDC) to make optimal energy
retrofit investment decisions on a multi-unit dwelling stock basis, across a region or community. RetroKit
extracts Building Energy Rating assessment data and carries out analysis to:
∼ Determine the baseline energy performance of housing stock in terms of energy use and
expenditure, CO2 emissions and BER rating, at whole stock level and per relevant dwelling cohorts;
∼ Model and compare a range of energy retrofit scenarios, with a view to establishing optimal energy
retrofit packages for the stock, considering technical requirements as well as financial and
environmental criteria.
RetroKit results can be used towards formulating an energy retrofit action plan, defining packages of
energy conservation measures tailored to each element of the stock.
The type of analysis for Cork City and County is based on each of the housing stocks broken down into city
and county using CSO SAP MAP (small area population maps) data, coupled with typical archetype
dwellings based on countywide and citywide BER data from SEAI.
RetroKit is then used to carry out baseline building energy calculation for each archetypal dwelling to
derive the total delivered and primary energy, energy costs, CO2 emissions, and renewable energy
contribution per dwelling.
For the purposes of the Register of Opportunities (see Section 6 below), RetroKit uses the baseline energy
information to develop a set of retrofit scenarios (Shallow, Medium and Deep) in order to establish the
optimum approach to meet a significant energy reduction target. The following is a summary of the
various measures:
∼ Shallow: Basic air tightness, insulate cavity and ceiling, cylinder lagging jacket, LEDs, wood stove
∼ Medium: Shallow, plus fully zoned controls, factory insulated cylinder, air source heat pump
∼ Deep: Medium, plus advanced air tightness, demand-controlled ventilation, EWI and floor and
rafter insulation, triple glazing, external doors, insulated pipework, underfloor heating, PV system
In the case of this study area, the medium energy retrofit scenario was proven to be cost-optimal.
19CORK ENERGY CHAMPION - ENERGY MASTER PLAN
Findings (based on standard occupancy):
∼ Total Final Energy Consumption (Residential) = 4,734.02GWh (34.39% of Total
Final Consumption)
∼ Estimated Energy Cost = €476.72M
∼ Total Emissions (Residential) = 1,391.00ktCO2eq. (34.81% of Total Emissions)
∼ Total Final Energy Consumption (Residential – Cork City) = 1,066.9GWh (22.5%)
∼ Total Final Energy Consumption (Residential – Cork County) = 3,667.1GWh (77.5%)
20CORK ENERGY CHAMPION - ENERGY MASTER PLAN
3.3 Methodology and Findings – Non-Residential (Private Tertiary, Public/Schools, Non-ETS Industry)
Energy usage in this sector tertiary sector is based on the combination of several data sources:
∼ Anonymised data from the non-domestic Building Energy Rating (NDBER) assessment database for
Cork County and Cork city (separately) from which were derived average figures for treated floor
area and the relative proportions of non-electrical fuel usages for buildings/facilities belonging to
a certain category (e.g. schools, warehouses, retail units, etc.).
∼ An inventory of the all the non-residential buildings/facilities within the study area. In the case of
Cork City, this is from Cork City Council rates data provided during the Cork City SECAP study. In
the case of Cork County, this is from the CSO (for the entire county) giving a summary list of the
number of different types of enterprises, with the number of buildings of each type from city rates
data subtracted so the non-city area can be identified on its own.
∼ TM46 benchmarks for different building types used to rationalise energy estimates derived from
the countywide BER data. TM46 benchmarks delivered energy usage per m2 for a range of building
types. The BER data average specific energy per m2 for each fuel type under each building type are
adjusted using the TM46 /m2 benchmarks. Relative difference of electricity vs non-electricity is
based on national SEAI figures.
∼ The above data are combined to determine usage of different fuel types in different building types,
and then scaled to city and non-city to calculate total usage of each fuel in non-domestic buildings.
The split between public / tertiary-private / industrial depends on the building type.
∼ Schools energy data from SEAI’s public sector programme, and total list of schools and pupil count
based on Department of Education and Skills data for the city and county. Where any school does
not report on SEAI’s system, the energy per fuel type per pupil is calculated based on the available
data to generate a complete data set.
∼ For both city 3rd level education and city hospitals, the primary data source is SEAI’s M&R reporting
facility. Where data is not available, then fuel usage per bed (hospitals) and per student (3rd level)
is calculated to generate a complete data set.
Findings (based on standard occupancy):
∼ Total Final Energy Consumption (Non-Residential) = 4,506.01GWh
(32.73% of Total Final Consumption)
∼ Estimated Energy Cost = €463.87M
∼ Total Emissions (Non-Residential) = 1,432.95ktCO2eq. (35.86% of Total
Emissions)
∼ Total Final Energy Consumption (Non-Residential – Cork City) =
1,040.7GWh (23.1%)
∼ Total Final Energy Consumption (Non-Residential – Cork County) =
3,465.3GWh (76.9%)
Consideration of energy consumption in the ETS sector (Emission Trading Scheme) is outside the scope
of this report. However, for information purposes, a final energy consumption figure of 1,099GWh has
been estimated for County Cork (City & County areas) for the ETS sector, which represents just under
20% of the total final energy consumption in the Non-Residential Sector.
21CORK ENERGY CHAMPION - ENERGY MASTER PLAN
3.4 Methodology and Findings – Municipal and Local Authority
3.4.1 Cork City Council
∼ Figures primarily taken from SEAI public sector monitoring and reporting system to identify overall
fuel uses and Electricity vs thermal vs transport usage.
∼ Figures on SEAI system expressed as primary energy converted to delivered energy.
∼ Split of electricity to identify street lighting based on calculations from Cork City SECAP work
(2018).
∼ As part of the Cork City SECAP work (2018), BER data was available for 3,252 of the total City
Council housing stock of 8,948. Results of this study are provided in the document “Cork City
Sustainable Energy and Climate Action Plan“ (January 2018).
3.4.2 Cork County Council
∼ Figures primarily taken from SEAI public sector monitoring and reporting system to identify overall
fuel uses and Electricity vs thermal vs transport usage.
∼ This is combined with data directly from Cork County Council showing energy required for different
end uses.
∼ Figures on SEAI system expressed as primary energy converted to delivered energy.
∼ BER or other energy data on the County Council housing stock was not available.
3.4.3 Irish Water
∼ National Irish water electricity usage from M&R (SEAI) reporting system.
∼ Scaled to Cork County from CSO data for number of meters in Cork and average consumption per
meter relative to national figures.
∼ This is then scaled down to Cork city and non-city based on their relative populations.
Findings:
∼ Total Final Energy Consumption (Municipal and Local Authority) = 144.83GWh
(1.05% of Total Final Consumption)
∼ Estimated Energy Cost = €22.88M
∼ Total Emissions (Municipal and Local Authority) = 60.40ktCO2eq. (1.51% of Total
Emissions)
∼ Total Final Energy Consumption (Municipal and Local Authority – Cork City) =
48.9GWh (33.8%)
∼ Total Final Energy Consumption (Municipal and Local Authority – Cork County) =
95.9GWh (66.2%)
22CORK ENERGY CHAMPION - ENERGY MASTER PLAN
3.5 Methodology and Findings– Fisheries and Agriculture
3.5.1 Fisheries
∼ National diesel for fisheries sourced from SEAI Energy in Ireland.
∼ Figures from Dept Agriculture, Fisheries and Marine (DAFM) provided registered addresses of all
fishing boats nationally.
∼ Fishing boats > 10tonnes and registered in Cork County were identified (assuming main fishing
ports are outside of city for refuelling purposes).
∼ Engine rating (kW) of all boats > 10 tonnes nationally and in Cork were identified to determine
ratio of national energy usage in fishing fleet relative to that in Cork.
3.5.2 Agriculture
∼ National electricity and diesel usage for agriculture and fisheries sourced from SEAI Energy in
Ireland.
∼ Gross Added Value (GVA) for agriculture and fisheries sourced from CSO 2, minus GVA from sea
fishing landings, to give state agriculture GVA only. Likewise, for SW region, to give GVA for
agriculture in state and SW region.
∼ Then GVA is used to scale energy from state to SW region.
∼ Scale from SW region (Cork/Kerry), to scale to Cork alone, based on CSO Number of farms
classified by economic size (SO).
∼ This provides energy usage in agriculture for Cork alone (diesel and electricity).
Findings:
∼ Total Final Energy Consumption (Fisheries) = 53.05GWh
∼ Estimated Energy Cost (Fisheries) = €3.30M
∼ Total Emissions (Fisheries) = 14.00ktCO2.
∼ Total Final Energy Consumption (Agriculture) = 344.72GW
∼ Estimated Energy Cost (Agriculture) = €31.26M
∼ Total Energy Related Emissions (Agriculture) = 108.49ktCO2.
∼ Total Final Energy Consumption (Fisheries and Agriculture combined) = 397.77GWh
(2.89% of Total Final Consumption)
∼ Estimated Energy Cost (Fisheries and Agriculture combined) = €34.56M
∼ Total Emissions (Fisheries and Agriculture combined) = 122.49ktCO2eq. (3.07% of
Total Emissions)
2
CSO RAA01 (GVA by region, year and statistic)
23CORK ENERGY CHAMPION - ENERGY MASTER PLAN
3.6 Methodology and Findings – Transport
3.6.1 Private car
∼ Worked out per year based on average age of cars and diesel and petrol annual avg. car
efficiency in L/100km (similar approach to Cork City SECAP work).
∼ Average car age in a given year based on figures worked out in previous SECAP report for Cork
City.
∼ Efficiencies per year and overall averages for diesel and petrol in kWh/km and gCO2/km.
∼ Electric car efficiencies derived from SEAI EV data.
∼ Traffic in kM and number of private cars is derived from CSO transport omnibus for Cork
(including City and County).
∼ Split of distances by fuel type based on national data from CSO.
∼ Efficiency per kM used for each of diesel, petrol and electric cars.
∼ RES-T biofuel value used to split petrol and diesel into unblended fossil fuel + biofuel.
∼ Number of cars for Cork City derived from CSO SAP MAP data. Average distance travelled by Cork
City cars is assumed to be similar to another city (Dublin). Accordingly, calculation of the fuel
usage for Cork City cars is based on above efficiency figures, city car-population and distances
travelled.
∼ Number of cars for Cork County (non-city) is derived from CSO SAP MAP data. Average distance
travelled by Cork County cars is based on the total County distance travelled, less the distance
travelled by City cars (see above). Fuel usage for Cork County cars based on above efficiency
figures, county car-population and distances travelled.
3.6.2 Small Public Service Vehicles (PSVs), such as taxi’s etc
∼ Distance travelled (kM) by small PSVs is taken from CSO transport omnibus for Cork (including
city and county).
∼ Split of fuel type based on national data from CSO.
∼ Engine efficiencies etc assumed to be same as private cars to derive usage of each fuel.
∼ RES-T biofuel value used to split petrol and diesel into unblended fossil fuel + biofuel.
∼ Distances travelled in City by small PSVs assumed to be as per Dublin, and the number of small
PSVs in City is assumed to be the same per capita as Dublin. Fuel usage for Cork City by small
PSVs is based on above efficiency figures and these Cork City small PSV population and distances
travelled.
∼ The remaining number of small PSVs outside Cork City is the total number of PSV’s (sourced from
the county CSO omnibus figure), less the number in Cork City. The average distance travelled by
Cork County small PSVs is based on total distance travelled, less distance travelled by City small
PSVs as derived above. Fuel usage for Cork County (non-city) by PSVs is based on the above
efficiency figures and these Cork County small PSV population and distances travelled.
3.6.3 Freight (Heavy and Light Goods Vehicles)
∼ Million tonne KM (MIO T.KM) data is obtained from the CSO transport omnibus, scaled down
from southwestern region to Cork (City/County) based on the number of hauliers in the county.
∼ National energy for freight based on SEAI Energy in Ireland (including LGVs and HGVs).
∼ The energy per MioTKM derived for the State is applied to Cork (City+County) MioTKM, to derive
the total Cork freight energy, scaled using CSO data on number of hauliers in the county. (Note
24CORK ENERGY CHAMPION - ENERGY MASTER PLAN
that earlier (2011) national freight energy usage from SEAI didn’t include LGVs. 2016 figure
included LGVs and HGVs).
∼ The number of hauliers, scaled to Cork City vs County, is derived using the number of employees
in transportation sector taken from SAPMAP data. The number of hauliers is used to scale down
energy usage, from total county to city vs non-city.
∼ Freight vehicles assumed to use diesel (blended from pure diesel and biofuel component from
RES-T for 2016).
3.6.4 Public Transport and Large PSV’s (busses etc)
∼ Bus Eireann city data is taken directly from data provided by Bus Eireann (Dec 2017), including
volume of diesel to derive MWh. This is then split into diesel (fossil) and biofuel based on RES-T.
∼ Bus Eireann county data directly from data provided by Bus Eireann (March 2019), including
volume of diesel to derive MWh. This is then split into diesel (fossil) and biofuel based on RES-T.
∼ Other Large PSVs:
o Efficiency of large PSVs is based on State energy usage, the number of national large PSVs
and the associated distance travelled.
o The number of large PSVs in city and county is split based on the number of employees in
the transport sector (CSO SAP MAP data). The number of Bus Eireann busses is
subtracted from this figure to give the number of large PSVs (non-Bus Eireann).
o The fuel usage of large PSVs is based on the above efficiencies, the number of PSV’s in the
county and the distances travelled. The split into diesel and biofuel is based on RES-T.
∼ Irish Rail (county only, as train distance travelled in the city is miniscule)
o Based on data received from Irish Rail April 2019 for CO2 from trains in Cork County.
o Used to derive diesel (blended), which is then split into unblended diesel and biofuel
based on RES-T.
Findings:
∼ Total Final Energy Consumption (Transport) = 3,984.27GWh (28.94% of Total Final
Consumption)
∼ Consumption breakdown by transport category: public transport (3.32%), all other
transport (excl municipal fleet) (96.68%)
∼ Estimated Energy Cost (Transport) = €474.88M
∼ Total Emissions (Transport) = 989.26ktCO2eq. (24.76% of Total Emissions)
∼ Total Final Energy Consumption (Transport – Cork City) = 796.2GWh (20%)
∼ Total Final Energy Consumption (Transport – Cork County) = 3,188.0GWh (80%)
25CORK ENERGY CHAMPION - ENERGY MASTER PLAN
3.7 Summary of Final Energy Consumption and Related Emissions
Sector/User Group Final Energy Consumption CO2 Emissions (kt)
(GWh)
Residential 4,734.02 1,391.00
Non-Residential 4,506.01 1,432.95
Municipal and Local Authority 144.83 60.40
Fisheries and Agriculture 397.77 122.49
Transport 3,984.27 989.26
TOTALS 13,766.90 3,996.10
TABLE 1: Final Energy Consumption, per user group
It is estimated that the total Final Energy Consumption increases from 13,766.90GWh to 14,866.9GWh
when ETS-related energy consumption is included.
Sector/User Group Final Energy Consumption Final Energy Consumption
(GWh) - CITY (GWh) - COUNTY
Residential 1,066.95 (22.5%) 3,667.07 (77.5%)
Non-Residential 1,040.68 (23%) 3,465.33 (77%)
Municipal and Local Authority 48.95 (33.7%) 95.88 (66.3%)
Fisheries and Agriculture 0 (0%) 397.77 (100%)
Transport 796.24 (20%) 3,188.03 (80%)
TOTALS 2,952.82 (21.4%) 10,814.08 (78.6%)
TABLE 2: Final Energy Consumption, per user group (City v County)
FIGURE 1: Final Energy Consumption, per user sector (CITY & COUNTY) (%)
26CORK ENERGY CHAMPION - ENERGY MASTER PLAN
FIGURE 2: Final Energy Consumption, per user sector (CITY ONLY) (%)
FIGURE 3: Final Energy Consumption, per user sector (COUNTY ONLY) (%)
∼ Energy consumption data in the residential sectors has been acquired predominantly on a
bottom-up basis. It should be noted that these calculations are based on standardised DEAP
occupancy metrics as used in Building Energy Rating calculations. As is evident from Figure 1
above, the proportion of final energy consumption attributable to the residential sector at
34.39% is above average in this study area, compared to a national residential share of 23.2% in
2016. By way of illustration: the average dwelling in Ireland in 2016 consumed 13,885kWh of
27CORK ENERGY CHAMPION - ENERGY MASTER PLAN
direct fuels and 4,638kWh of electricity, 18,524kWh in total 3. However, the corresponding 2016
figures for the study area are 17,990kWh and 4,600kWh respectively, 22,590kWh in total. The
breakdown of this consumption by sub-area is 20,730kWh & 23,196kWh for city and county
dwellings respectively. One possible reason for this is that energy from solid fuel in the county is
16%, compared to 13% in the city (14% national average)) - solid fuel heating systems are
typically a less efficient means of converting delivered fuel to heat than electricity or other fuels.
Furthermore, the proportion of pre-1970 dwellings in the City area is particularly high at over
55%, compared to the national average of 31% - older dwellings typically use more energy per
m2 in standardised calculations referenced above.
∼ The proportion of final energy consumption attributable to transport is quite low in this study area
at 28.94% (26.97% in City area, 29.48% in County area): the proportion of final energy
consumption attributable to transport nationally in 2016 was 42.4% 4.
∼ The proportion of final energy consumption attributable to Non-Residential and Municipal/Local
Authority is 33.78%; this compares well with the national final energy consumption attributable
Industry and Commercial/Public in 2016 of 32.5% 5.
∼ The proportion of final energy consumption attributable to Fisheries and Agriculture is 2.89%; this
is somewhat higher than the national final energy consumption attributable to this sector in 2016
of 1.9% 6.
∼ Total Final Consumption per capita in the study area in 2016 is calculated at 26.52MWh approx.,
6.6% lower than the national average Total Final Consumption per capita nationally in 2016 of
28.39MWh approx.
∼ Validation of results: while several automatic checks are carried out throughout baseline
development calculations to ensure data is correctly used within the calculations, it is worth
outlining some comparisons with external / existing data:
o Non-Residential buildings proportion of electricity total is 40% in Cork City and 39% in Cork
County. The national average is 39%, thereby showing close correlation to calculated figures.
o Non-Residential buildings calculated gas usage in the entire county was compared to CSO data
(non-domestic) for the county and is within 6% of the metered figure. Note that the metered
figure includes ETS, whereas this is not included in the calculated figure. Therefore, ETS tallies
for Cork are estimated and discounted as part of this process.
o The calculated total delivered energy for Cork City is 13% greater than that calculated in the
Cork City SECAP (after a simple approximation is used on the SECAP data to bring it from 2011
to 2016 based on the change to national energy usage during the same period).
o The calculated total primary energy for Cork SEAP 2010 (County only) is within 5.9% of the
figure calculated in this new Cork Energy Master Plan baseline
o Simple check of national energy usage scaled by population relative to Cork: while the national
figure (scaled) is 11% greater than the calculated figure, this is offset somewhat as it includes
ETS.
3
SEAI: ENERGY IN THE RESIDENTIAL SECTOR – 2018 REPORT
4
SEAI: ENERGY IN IRELAND – 2017 REPORT
5
SEAI: ENERGY IN IRELAND – 2017 REPORT
6
SEAI: ENERGY IN IRELAND – 2017 REPORT
28CORK ENERGY CHAMPION - ENERGY MASTER PLAN
FIGURE 4: CO2 Emissions, per user sector (City & County) (%)
29CORK ENERGY CHAMPION - ENERGY MASTER PLAN
3.8 Summary of Final Energy Fuel Mix and Energy Costs
FIGURE 5: Final Energy Consumption (GWh), by energy carrier
FIGURE 6: Final Energy Consumption (%), by energy carrier
30CORK ENERGY CHAMPION - ENERGY MASTER PLAN
FIGURE 7: Fuel Cost, by energy carrier
31CORK ENERGY CHAMPION - ENERGY MASTER PLAN
4 Contribution of Renewable Technologies (Existing)
There is considerable existing deployment of renewable generation capacity, primarily onshore wind.
There is also a significant amount of capacity powered by hydro & bioenergy sources. As is evident from
the wind resource map below (see Appendices), there are multiple opportunities for further deployment
of onshore wind into the future. However, other than currently contracted generation capacity, it is
considered likely that further development of onshore wind generation will not be extensive once
offshore deployment becomes economically feasible.
4.1 Grid-Connected Onshore Wind Power Plants (Fully Connected) 7
TSO CONNECTED ONSHORE WIND (Fully Connected)
LOCATION MAX EXPORT CAPAC. 2016 NATIONAL CAPAC. OUTPUT (GWh)
(MW) FACTOR. 8
Coomacheo 41.23 27.6% 99.68
Coomacheo 18 27.6% 43.52
Boggeragh 57 27.6% 137.81
Knockacummer 100 27.6% 241.78
Boggeragh (Connected 65.7 27.6% 79.43
June 2016)
TOTAL 602.22
DSO CONNECTED ONSHORE WIND (Fully Connected)
LOCATION MAX EXPORT CAPAC. 2016 NATIONAL CAPAC. OUTPUT (GWh)
(MW) FACTOR. 9
Kealkil Wind Farm 8.5 27.6% 20.55
DePuy 3MW 2.5 27.6% 6.04
Garranereagh, Bandon 8.75 27.6% 21.16
Ballybane, Ballylickey 19.55 27.6% 47.27
Kilvinane, Bandon 4.5 27.6% 10.88
Pluckanes, Kilbarry 0.85 27.6% 2.06
Crocane, Midleton 1.7 27.6% 4.11
Carraigcannon, 20 27.6% 48.36
Boggeragh
Lahanaghthill, 4.25 27.6% 10.28
Dunmanway
Ballybane, Ballylickey 11.5 27.6% 27.80
Knocknatallig, Charleville 18.3 27.6% 44.25
Knockearagh 4.5 27.6% 10.88
Taurbeg, Glenlara 26 27.6% 62.86
Ballybane, Ballylickey 8.4 27.6% 20.31
Reenascreena, 4.5 27.6% 10.88
Dunmanway
Bawnmore, Macroom 24 27.6% 58.02
7
ESB NETWORKS: TSO CONNECTED RENEWABLES (01-June-2019)
8
SEAI: ENERGY IN IRELAND REPORT 2018
9
SEAI: ENERGY IN IRELAND REPORT 2018
32CORK ENERGY CHAMPION - ENERGY MASTER PLAN
Dromdeeveen, Glenlara 10.5 27.6% 25.39
Coomatallin, Dunmanway 5.95 27.6% 14.39
Gneeves, Knockearagh 9.35 27.6% 22.63
Currabwee, Dunmanway 4.62 27.6% 11.17
Milane Hill, Dunmanway 5.94 27.6% 14.36
Janssen, Barnahely 2 27.6% 4.84
TOTAL 498.47
4.2 Grid-Connected Hydroelectric Power Plants
TSO CONNECTED HYDRO POWER PLANTS (Fully Connected)
LOCATION MAX EXPORT CAPAC. 2016 NATIONAL CAPAC. OUTPUT (GWh)
(MW) FACTOR. 10
Lee - Inniscarra 15 33% 43.36
Lee – Inniscarra 4 33% 11.56
Lee- Carrigadrohid 8 33% 23.13
TOTAL 78.05
DSO CONNECTED HYDRO POWER PLANTS (Fully Connected)
LOCATION MAX EXPORT CAPAC. 2016 NATIONAL CAPAC. OUTPUT (GWh)
(MW) FACTOR. 11
Bruree Hydro, Charleville 0.132 33% 0.38
ESB Valoren, Ballylickey 0.768 33% 2.22
Owenbeg, Ballylickey 0.80 33% 2.31
Ashgrove Mill, 0.60 33% 1.73
Knockearagh
Coolfadda, Bandon 0.079 33% .23
Borlin Valley, Ballylickey 0.365 33% 1.06
Glenlough, Ballylickey 0.41 33% 1.19
Lee Rd., Cork 0.265 33% .77
Slaheny, Ballylickey 0.485 33% 1.40
TOTAL 11.29
10
SEAI: ENERGY IN IRELAND REPORT 2018
11
SEAI: ENERGY IN IRELAND REPORT 2018
33CORK ENERGY CHAMPION - ENERGY MASTER PLAN
4.3 Grid-Connected Power Plants (Bioenergy)
DSO CONNECTED GENERATION PLANTS – BIOENERGY (Fully Connected)
LOCATION MAX EXPORT CAPAC. 2016 NATIONAL CAPAC. OUTPUT (GWh)
(MW) FACTOR. (est)
Timoleague (Biogas) 1.10 30% 3.97
Adamstown, 3.00 30% 10.84
Knockearagh (Biomass)
Portgate, Barnahely 0.10 30% .36
(Biomass)
Graingers, Bandon 2.70 30% 9.76
(Biomass)
CMP, Bandon (Biogas) 6.00 30% 21.68
TOTAL 46.61
4.4 SUMMARY – CONTRIBUTION FROM RENEWABLE TECHNOLOGIES
GWh Share
TSO ONSHORE WIND 602.22 41.78%
DSO ONSHORE WIND 498.47 34.58%
TSO HYDRO 78.05 5.41%
DSO HYDRO 11.29 0.78%
DSO BIOENERGY 46.61 3.23%
DEMAND-SIDE BIOFUELS and 204.78 14.21%
BIOMASS (see Figure 5 above)
TOTAL 1,441.42
The total renewable contribution of 1,441.42GWh (2016) represents 10.47% of the overall energy
demand of 13,766.90GWh (2016) per Table 1 above. This compares to a national renewable energy
contribution of 9.5% in 2016 12.
12
Energy in Ireland (1990-2016) SEAI
34CORK ENERGY CHAMPION - ENERGY MASTER PLAN
5 Register of Opportunities
The following tables list the proposed actions under User Sector headings for the 2019-2030 period for
Energy Demand Reduction and Renewable Energy Contribution respectively. In particular, we have set
out a series of recommendations/proposals under the following sectors:
∼ Residential
∼ Non-Residential
∼ Municipal and Local Authority
∼ Fisheries and Agriculture
∼ Transport
35CORK ENERGY CHAMPION - ENERGY MASTER PLAN
ENERGY DEMAND REDUCTION ACTIONS COST PROJECTED ENERGY EXISTING ENERGY %
DEMAND REDUCTIONS DEMAND REDUCTION
(GWh/a) (GWh/a)
RESIDENTIAL ACTIONS (2019-2030)
1. Deployment of medium-depth retrofit of 75% of €3,820.43M 2,012.75 4,734.02 43%
dwellings
NON-RESIDENTIAL ACTIONS (2019-2030)
1. Deployment of energy retrofit measures to deliver 40% €3,421.16M 1,802.40 4,506.01 40%
reduction in energy demand across entire non-
residential sector
MUNICIPAL and LOCAL AUTHORITY ACTIONS (2019-2030)
1. Public lighting: 30% energy demand reduction by €8.86M 9.13 30.43 30%
replacing 17,044 lamps with LED lighting
2. Water services: 30% energy demand reduction €42.1M 18.29 60.97 30%
3. Municipal Buildings, etc: 30% energy demand reduction €19.85M 10.46 34.87 30%
(Municipal Transport included below)
FISHERIES and AGRICULTURE ACTIONS (2019-2030)
1. 30% energy demand reduction across agriculture sub- €106.80M 103.42 397.77 26%
sector
TRANSPORT ACTIONS (2019-2030)
1. Deployment of EV’s, CNG (cars, busses, trucks) and €25.90M/yr 346.14
electric rail (Actions T3, T18, T19 NMP)
2. Modal shift to non-motorised and public transport – €40.38M/yr 107.99
Cork City only (Actions T1, T2 NMP)
3. Smart Driving Program across all sectors (Action T22 €0.91/yr 354.86
NMP)
Total - Transport 809.08 4,002.85 20%
TOTAL - OVERALL 4,765.53 13,766.9 34.6%
36You can also read