ALEXANDRIA TRANSIT COMPANY (DASH) TRANSIT DEVELOPMENT PLAN - FY 2020 - FY 2025 - DRAFT - March 14, 2019 - DASH Bus
←
→
Page content transcription
If your browser does not render page correctly, please read the page content below
FY 2020 – FY 2025
ALEXANDRIA TRANSIT COMPANY (DASH)
    TRANSIT DEVELOPMENT PLAN

         DRAFT – March 14, 2019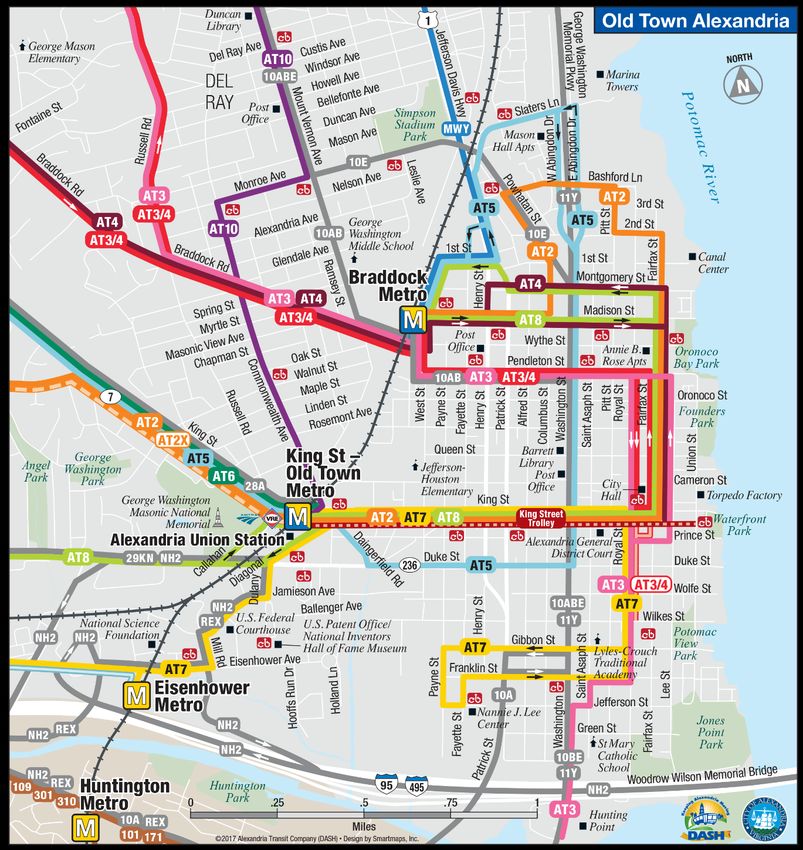
FY 2020 - FY 2025 ATC TRANSIT DEVELOPMENT PLAN
                                                 TABLE OF CONTENTS

1.0 / Executive Summary .................................................................................................................... 1
          1.1 System Performance .................................................................................................................. 1
          1.2 FY 2020 Service & Fare Changes ................................................................................................ 1
          1.3 FY 2021 – FY 2025 Service & Fare Changes ............................................................................... 2
          1.4 ATC Capital Program .................................................................................................................. 2
2.0 / TDP Background......................................................................................................................... 4
          2.1 Purpose & Format ...................................................................................................................... 4
          2.2 Process & Timeline ..................................................................................................................... 4
          2.3 Alexandria Transit Vision Plan.................................................................................................... 6
3.0 / System Summary ....................................................................................................................... 7
          3.1 Service Area ............................................................................................................................... 7
          3.2 Routes ........................................................................................................................................ 7
          3.3 Other Transit Providers ........................................................................................................... 11
          3.4 Passenger Facilities .................................................................................................................. 11
          3.5 Bus Fleet ................................................................................................................................... 12
          3.6 Fares ......................................................................................................................................... 13
          3.7 Funding .................................................................................................................................... 13
4.0 / System Performance ................................................................................................................ 15
          4.1 Service Provided....................................................................................................................... 15
          4.2 System Ridership...................................................................................................................... 15
          4.3 Ridership by Route .................................................................................................................. 17
          4.4 Cost Efficiency .......................................................................................................................... 19
          4.5 Operating Ratio ........................................................................................................................ 19
          4.6 Service Reliability ..................................................................................................................... 20
          4.7 Access & Mobility ..................................................................................................................... 21
          4.8 System Performance Summary................................................................................................ 23
5.0 / Service & Fare Recommendations ............................................................................................ 24
          5.1 FY 2020 Service Recommendations ......................................................................................... 24
          5.2 FY 2020 Fare Recommendations ............................................................................................. 25
          5.3 FY 2021 – FY 2025 Service & Fare Recommendations ............................................................ 26

0 | FY2020 – FY2025 ATC Transit Development Plan (DRAFT – Version 1)
6.0 / ATC Capital Program ................................................................................................................ 28
          6.1 FY 2020 – FY 2029 Capital Improvement Plan (CIP)................................................................. 28
          6.2 Fleet Replacement Plan ........................................................................................................... 28
          6.3 Fleet Expansion ........................................................................................................................ 30
          6.4 Battery Pack Replacement ....................................................................................................... 30
          6.5 Electric Bus Program ................................................................................................................ 33
          6.6 DASH Facility Expansion ........................................................................................................... 34
          6.7 Technology Improvements ...................................................................................................... 34
          6.8 Other Capital Outlay Items ...................................................................................................... 35

0 | FY2020 – FY2025 ATC Transit Development Plan (DRAFT – Version 1)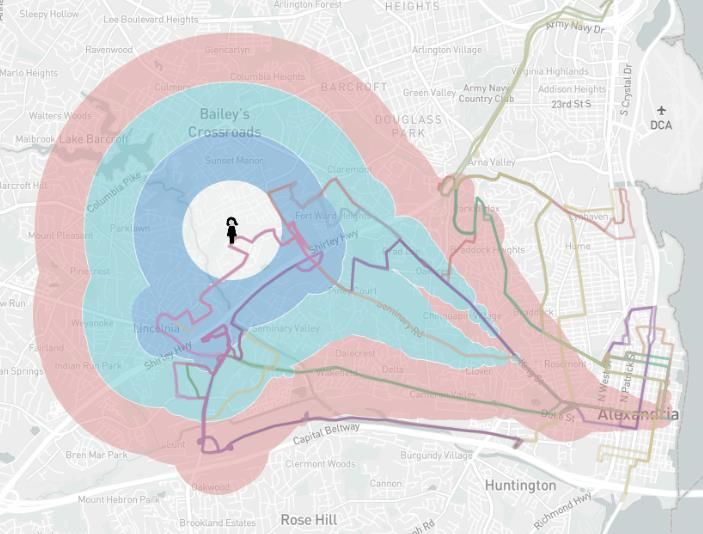
1.0 / Executive Summary

This document represents the FY 2020 – FY 2025 Transit Development Plan (TDP) for the Alexandria
Transit Company (ATC). The Alexandria Transit Company is responsible for the management, operation
and maintenance of the DASH bus system in Alexandria, Virginia.

The Transit Development Plan (TDP) provides a comprehensive vision of future service development,
fare adjustments, and capital investments based on recommendations from the General Manager, ATC
Board of Directors and DASH staff. More specifically, it evaluates current DASH system performance,
outlines projected service levels for the fiscally-constrained FY 2020 operating budget, and provides
fiscally-unconstrained guidance on future service changes and capital improvements for the remaining
five years of the six-year plan cycle (FY 2021 – FY 2025). The TDP is updated each year by DASH staff and
is subject to annual review, amendment, and adoption by the ATC Board of Directors. The document
also serves as a resource for the city staff as they consider future ATC requests for financial assistance.

The FY 2020 Transit Development Plan addresses the period beginning July 1, 2019 and ending June 30,
2025. The document has been prepared in accordance with board-adopted procedures, and is divided
into four main sections – System Overview (Section 3), System Performance (Section 4), Service & Fare
Change Recommendations (Section 5), and Capital Budget (Section 6).

The key findings and recommendations of these four sections are summarized below:

1.1 / System Performance

    •   In FY 2018, DASH operated over 215,000 revenue hours of service, up 1.5 percent from FY 2017.

    •   DASH recorded nearly 3.9 million boardings in FY 2018, a 1.9 percent decrease from FY 2017.
        Although this represents a ridership loss, the ridership drop for each of the two preceding years
        was four percent per year. For comparison purposes, Fairfax Connector, Arlington Transit,
        Fairfax CUE, Loudoun County Transit and PRTC/Omniride each experienced declines of between
        4 percent and 13 percent from FY 2017 to FY 2018, so DASH experience the least decline of all
        bus agencies in Northern Virginia during that period.

    •   The FY 2017 Operating Ratio was 32.2 percent, or 1.6 percent lower than FY 2017.

    •   DASH On-Time Performance was 82.1% in CY 2018. In November 2017, DASH began calculating
        OTP with a new methodology based on CAD/AVL technology which is expected to yield more
        accurate OTP statistics. FY 2019 will be the first full fiscal year with data from the new method.

1.2 / FY 2020 Service & Fare Change Recommendations

    •   At the direction of the ATC Board of Directors, the following FY 2020 fare changes are planned:
            o Increase base fare from $1.75 to $2.00, effective September 1, 2019.
            o Increase cost of monthly DASH Pass from $45 to $50, effective September 1, 2019.

    •   Due to city subsidy funding constraints, no major service improvements are planned in FY 2020,
        other than those which are tied to I-395 Commute Choice Program funding.

1 | FY2020 – FY2025 ATC Transit Development Plan (Draft – Version 1)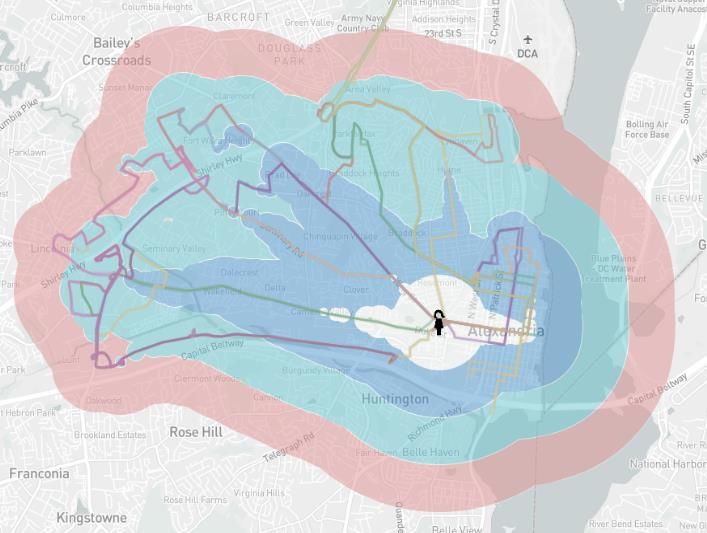
•   Excluding the I-395 Commuter Choice program improvements and additional service provided in
       response to WMATA’s Summer 2019 Platform Improvement Project, DASH projects that FY 2020
       service levels for regular DASH routes and the King Street Trolley will remain flat as compared to
       FY 2019 (237,000 annual platform hours).
   •   The FY19 Projected Operating Ratio of 31.7% is down from 33.7% in the FY 2019 adopted
       budget. This reflects a projected passenger revenue deficit in FY19 driven by declining ridership,
       the federal government shutdown in January, the King Street Metro Access Improvement
       Project, and expected effects of the Summer 2019 Metro Platform Improvement Project.

   •   DASH has agreed to operate shuttle service during the first phase of WMATA’s Platform
       Improvement Project, which will result in a shutdown of all Metrorail stations south of National
       Airport from Memorial Day to Labor Day 2019. DASH will be operating the Blue Line Shuttle
       seven days per week during this shutdown period, and will provide enhanced service on the
       AT3, AT4 and King Street Trolley on weekdays to help mitigate the impact of the closure.

   •   As part of the inaugural I-395 Commuter Choice program for disbursement of toll revenues from
       the new I-395 Express Lanes, DASH will be submitting applications to enhance service on several
       DASH routes that provide local and/or express bus service along the I-395 corridor. The selected
       improvements will be compatible with the anticipated recommendations from the Alexandria
       Transit Vision Plan and will likely serve as a precursor to the West End Transitway. If selected,
       DASH would be able to implement the proposed service enhancements in October 2019.

1.3 / FY 2021 – FY 2025 Service & Fare Change Recommendations

   •   Based on the future recommendations of the Alexandria Transit Vision (ATV) Plan, DASH will
       implement a set of comprehensive service adjustments beginning in FY 2021. The ATV study
       kicked off in Spring 2018 and is expected to be completed by mid-2019. Findings and
       recommendations will be finalized by Fall 2019 and will be implemented as part of the FY 2021
       Transit Development Plan, which takes effect July 1, 2020. As noted above, some initial
       weekday frequency improvements that align with anticipated ATV recommendations may be
       implemented as early as October 2019 if DASH is awarded funding from the I-395 Commuter
       Choice inaugural program.

   •   No additional future fare changes for FY 2021 or beyond are being considered at this time.

1.4 / ATC Capital Program Summary

   •   Over the last 12 months, DASH has purchased and received 27 new clean diesel buses to replace
       older diesel buses that had reached the end of their useful life.

   •   DASH will receive $3.5 million in FY 2020 for replacement buses as part of the City of
       Alexandria’s FY 2020 CIP budget cycle. The total approved FY 2020 – FY 2029 CIP award for
       replacement bus purchases was $21 million.

   •   Beginning in FY 2018, DASH changed its practice for replacement buses and now purchases
       clean diesel buses instead of hybrid vehicles to meets its fleet replacement needs. This will

2 | FY2020 – FY2025 ATC Transit Development Plan (Draft – Version 1)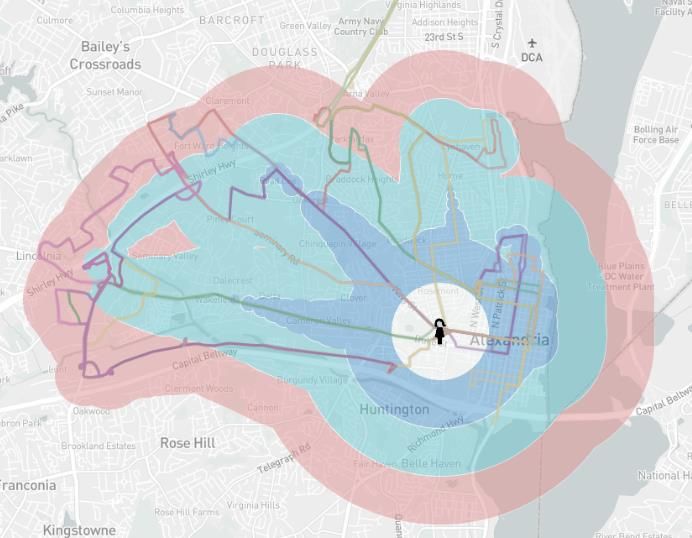
enable DASH to achieve State of Good Repair (SGR), maintain an acceptable spare ratio, and
       limit the number of buses that remain in revenue service beyond their useful 12-year life cycle.
       It will also ensure that DASH has a reliable core fleet of buses during its upcoming transition to
       less proven, zero-emission propulsion technology.

   •   DASH is planning to purchase 14 buses in FY 2020, including six electric buses through the VW
       Mitigation Trust program and eight clean diesel buses. If DASH is awarded VW funding, the six
       electric buses will arrive no later than Spring 2021 and replace six older diesel buses. The eight
       clean diesel buses will be purchased through DRPT’s minor enhancement program and will allow
       DASH to improve its spare ratio to industry standards by late 2020.

   •   Additional FY 2020 – FY 2029 CIP funds are allocated for hybrid powertrain replacement, the
       DASH Facility Expansion project, electronic fare payment, and other DASH technology needs.

3 | FY2020 – FY2025 ATC Transit Development Plan (Draft – Version 1)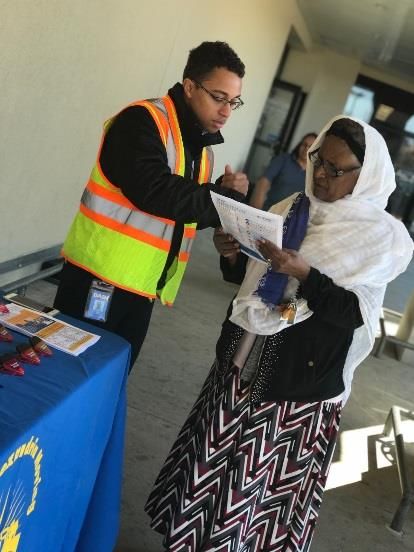
2.0 / TDP Background

The Transit Development Plan is prepared each year to document and present the General Manager’s
recommendations relating to service, fares and the capital budget for the upcoming fiscal year. The plan
also serves as a planning and budgetary road map for the following five years. To this end, the TDP
provides an evaluation of the existing DASH bus service and a corresponding outline for future service
development and capital investment. The plan aligns with the budgetary assumptions for the upcoming
fiscal year, and will be used as a starting point for budget discussions in future fiscal years.

2.1 / Purpose & Format

Based on feedback from the ATC Board of Directors, City staff and DASH management, the format of the
FY 2019 - FY 2024 Transit Development Plan was shifted to focus on service planning, fares, and capital
program considerations, and less on the historic and budgetary narrative that had been included in
previous TDP documents.

The newly-formatted Transit Development Plan (TDP) provides a comprehensive vision of future service
development, fare adjustments, and capital investments based on recommendations from the General
Manager, ATC Board of Directors and DASH staff. More specifically, it evaluates current DASH system
performance, outlines projected service levels for the fiscally-constrained FY 2020 operating budget, and
provides fiscally-unconstrained guidance on future service changes and capital improvements for the
remaining five years of the six-year plan cycle (FY 2021 – FY 2025). The TDP is updated each year by
DASH staff and is subject to annual review, amendment, and adoption by the ATC Board of Directors.
The document also serves as a resource for the city staff as they consider future ATC requests for
financial assistance

2.2 / Process & Timeline

The TDP approval process is designed to run in parallel with the City of Alexandria’s annual budget
timeline. As shown in Table 2-1, the basic TDP assumptions are developed by DASH management in the
late fall and early winter. A preliminary draft of the TDP is typically submitted to the Board of Directors
and released for public review in March. This release marks the beginning of a month-long public
comment period that culminates with a formal public hearing at the April meeting of the ATC Board.
The public comment period includes multiple community meetings, online engagement and the
opportunity for comments to be submitted via phone, email, or in person at the Board of Directors
meeting in April. DASH staff reviews all feedback and modifies the document as needed to incorporate
feedback, and align with the final city budget. The final ATC Transit Development Plan is then reviewed
and adopted by the ATC Board of Directors in May so that the plan may be implemented for the
subsequent fiscal year on July 1st.

4 | FY2020 – FY2025 ATC Transit Development Plan (Draft – Version 1)
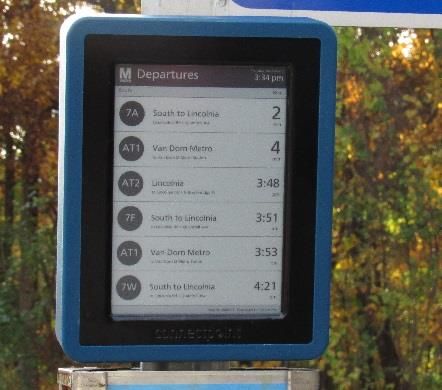
Table 2 – 1 / Annual TDP Timeline

            Month                      ATC/DASH Activity                         City Activity
              July                            No Actions                            No Actions
             August                           No Actions                            No Actions
                                      DASH Finance Department
           September                Develops and Distributes Budget      (TYP) City Develops Budget Process
                                        Process to internal staff
                                                                            (TYP) City Manager releases
                                     Budget and TDP Assumptions
             October                                                         Priorities and Instructions
                                       developed by DASH Staff
                                                                                   Memorandum
                                   Budget Assumptions and Scenarios
                                                                         DASH Assumptions and Reduction
                                   presented to DASH Board inclusive
            November                                                     Actions (if required) submitted to
                                      of Council Priorities and City
                                                                                    City Manager
                                         Manager’s Instructions
                                    Preliminary Budget submitted to       Budget Request submitted to City
            December
                                        DASH Board for Approval          Manager using Preliminary Budget
                                     DASH Staff begin draft TDP (in      City Manager Develops Budget and
             January               years 2-6 this is the TDP update) –    holds meetings with Department
                                      No Board Action this Month                      Heads
                                                                         City Manager Releases Budget and
            February                           No actions
                                                                                presents to Council
                                     Draft TDP is presented to Board
              March                                                            City Budget Hearings
                                    and released for public comment
                                   DASH Board holds Draft TDP Public
              April                Hearing (in years 2-6, updates are      City Budget Hearings ongoing
                                      provided for public comment)
                                    DASH Board Adopts Final Budget
              May                                                               City Adopts Budget
                                                 and TDP
              June                             No Actions                           No Actions

5 | FY2020 – FY2025 ATC Transit Development Plan (Draft – Version 1)
2.3 / Alexandria Transit Vision Plan
The ATV Plan is an ambitious, consultant-led study that takes a
non-traditional, data-driven approach to re-designing the city’s
transit network from scratch. The final product will be a new,
fiscally-unconstrained bus network to be implemented by 2030,
which more accurately reflects current and future transit
demand, and is better aligned with community transit priorities. A near-term, fiscally-constrained
implementation scenario will also be developed as a first step towards the ultimate transit vision. The
near-term implementation scenario will be designed with a fiscally-constrained approach and will be
implemented as early as July 2020. Consequently, the service, fare, and capital improvement
recommendations for next year’s FY 2021 – FY 2025 Transit Development Plan will be guided almost
exclusively by the findings and recommendations in the Alexandria Transit Vision (ATV) Plan.
The first round of public outreach for the Alexandria Transit Vision Plan
focused on key transit choices and was conducted in September 2018.
The outreach campaign included public meetings, pop-up events,
leadership briefings, stakeholder workshops, technical advisory
committees, online surveys and extensive digital outreach using email
and social media. The results of this outreach indicated a strong
preference on the part of the community, stakeholders and city officials
towards a more ridership-centric network and a willingness to walk
further and transfer between buses, if it meant better access to high-
frequency, all-day bus service. Although the community expressed a
strong desire towards ridership goals, some also expressed concerns for
the impact of service reductions in low-density areas on persons with
limited mobility that may not be able to walk further to get to the
nearest bus stop.
With this guidance in mind, the project team developed two draft network concepts that represented
potential directions for the future transit network – one network called the “Coverage” network
represent a moderate shift towards a ridership-centric network, while the second network, the
“Ridership” network outlines a more dramatic shift towards the goal of ridership maximization. After
sharing these two concepts with the
community, stakeholders and key city
officials in March, the project team
will design the final network in April
based on the feedback that is
received. One final round of outreach
will be conducted in Summer/Fall
2019 before the final plan is adopted.
Since the final ATV plan will not be
determined until after the FY 2020-FY2025 Transit Development Plan is adopted, the proposed service
and fare changes for FY 2020 – FY 2025 contained in this TDP will be relatively minor and open-ended in
deference to the forthcoming ATV Plan. Several potential service improvements to the AT 1, AT 2 and
AT-9, which align with anticipated ATV recommendations, are being pursued through I-395 Commuter
Choice program funding and are discussed in Section 5.
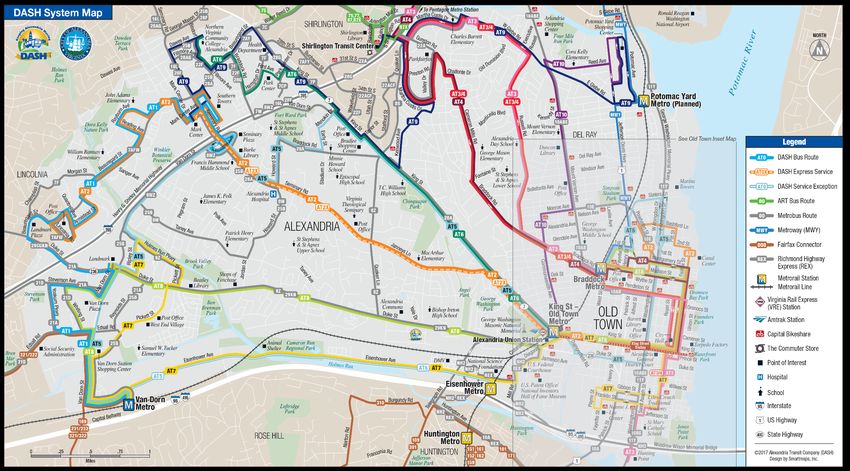
6 | FY2020 – FY2025 ATC Transit Development Plan (Draft – Version 1)3.0 / System Summary DASH operates traditional fixed-route bus service on eleven regular bus routes, and the King Street Trolley. The primary DASH service area covers approximately 15 square miles and generally aligns with the jurisdictional boundaries of the City of Alexandria. A map of the DASH bus system is included as Figure 3-1. An inset map depicting bus service in Old Town Alexandria is shown as Figure 3-2. 3.1 / Service Area The majority of DASH service operates within the City of Alexandria, however, two routes – the AT-3 and AT-4 – also provide service along Interstate 395 between Alexandria and the Pentagon during weekday peak hours. As shown in Figures 3-1 and 3-2, the DASH bus system design follows a modified hub-and- spoke network design model with Old Town as the “hub”, and the major east-west arterials (King Street, Seminary Road, Duke Street, and Eisenhower Avenue) serving as the “spokes”. Several “crosstown routes” also provide connections between outlying areas and major trip generators on the West End and northern Alexandria. All but one of the twelve DASH routes connect to at least one of the four Metrorail Stations within the City of Alexandria. Based on a geospatial analysis of the DASH network, approximately 145,000 Alexandria residents (96% of all residents) are within short walking distance (¼ mile) of a DASH bus stop. Roughly 80,000 jobs (90% of all jobs) in or around Alexandria are within short walking distance of a DASH bus stop. 3.2 / Routes The DASH bus system consists of 11 regular bus routes and the King Street Trolley. The basic characteristics of each route are summarized in Table 3-1. All twelve bus routes operate on weekdays, however, only eight routes run on Saturday, and only seven routes are available on Sundays. On most routes, weekday service runs from roughly 6:00 AM to 10:00 PM, Saturday service from 7:00 AM to 10:00 PM, and Sunday service from 8:00 AM to 8:00 PM. Weekday peak service for most routes runs every 15-30 minutes. Weekday off-peak service typically runs every 30-60 minutes during mid-days and evenings. Of the eight Saturday routes, four run with minimum 30-minute headways, while on Sundays, six of the seven routes only run once every hour. DASH also operates the iconic King Street Trolley, a free service running between the King Street Metro and the Old Town Waterfront. The trolleys run every 10-15 minutes, 365 days per year. Daily service starts at 10:30 AM and typically ends at 10:30 PM, with extended late-night service on Thursdays, Fridays, and Saturdays. Additional information on the destinations, service levels and operating characteristics for specific DASH routes is provided in Table 3-1. 7 | FY2020 – FY2025 ATC Transit Development Plan (Draft – Version 1)
Figure 3 – 1 / DASH System Map

8 | FY2020 – FY2025 ATC Transit Development Plan (Draft – Version 1)
Figure 3 -2 / Old Town Alexandria Inset Map

9 | FY2020 – FY2025 ATC Transit Development Plan (Draft – Version 1)
Table 3-1 / DASH Service Characteristics by Route
Span/Frequency Service Hour Breakdown Peak Vehicle Req's Avg. Daily Boardings Daily Rev. Hours
Route Route Description Weekday Saturday Sunday (October 2018) (Approx) (Oct. 2018) (Oct. 2018)
Span Peak Off-Peak Night Span Freq. Span Freq. Rev Hrs DH Hrs LO Hrs Wky Sat Sun Wky Sat Sun Wky Sat Sun
Seminary Plaza to Van Dorn Metro via 6am - 7am -
AT1 Beauregard & Duke 10pm
15 30 60
10pm
30 8am - 8pm 60 95.4 6.33 23.2 8 3.5 2 1,736 737 493 95.4 37.4 22.1
6am -
Lincolnia to Braddock Road Metro via Seminary,
AT2 King Street Metro & Old Town
10pm (6 - 20/30
30 60
8am -
60 8am - 8pm 60
86.13 8.16 15.72
12 3 2.5 1,567 425 475 86.1 35.3 28.1
(2X) 9am & (10/20) 11pm (21.94) (1.75) (7.17)
(2X - Mark Center Express)
3 - 6pm)
Hunting Point to Pentagon Metro via Old Town, 6 - 9am &
AT3 Braddock, Russell, Glebe and I-395 4 - 8pm
20 - - - - - - 37.01 5.12 5.64 5 - - 742 - - 37.0 - -
City Hall to Pentagon Metro via Old Town, 6 - 9am &
AT4 Braddock Road Metro, Cameron Mills, and I-395 4 - 7:30pm
20 - - - - - - 36.87 5.08 8.52 5 - - 558 - - 36.9 - -
10:30am -
City Hall to Parkfairfax Loop via Old Town, 3pm &
AT3/4 Braddock Road Metro, Braddock, Glebe & Russell 8:30 -
- 60 60 9am - 8pm 60 9am - 6pm 60 5.67 0.25 2.07 0 1 1 58 58 53 5.7 11.9 10.2
10:30pm
Van Dorn Metro to Braddock Road Metro via 6am - 7:30am -
AT5 Landmark Mall, Van Dorn, King & Old Town 10:30pm
20/30 30 60
10:30pm
30 8am - 8pm 60 88.62 5 14.7 7 6 2.5 1,673 961 399 88.6 92.5 36.3
6am -
AT6 King Street Metro to NVCC via King
10pm
15 30 30 - - - - 52.93 4.3 13.23 5 - - 1,004 - - 52.9 - -
Landmark Mall to Lee Center via Van Dorn Metro, 6am -
AT7 Eisenhower Metro, King Street Metro & Old Town 10pm
30 60 60 - - - - 57.42 3.4 11.55 5 - - 696 - - 57.4 - -
Braddock Road Metro to Van Dorn Metro via Old 5:30 am - 7am - 7am -
AT8 Town, King Street Metro, Duke & Landmark 12 am
10/20 30 60
11:30pm
30
11pm
20/40 126.85 9.74 31.4 10 3.5 3 2,933 1,311 916 126.9 61.4 50.9
Potomac Yard to Mark Center via Glebe, 7:30am -
AT9 Shirlington, King & NVCC
7am - 9pm 30 30 60
9:30pm
60 - - 55.11 2.34 11.55 4 2 - 618 211 - 55.1 30.5 -
Potomac Yard to King Street Metro via Mt. Vernon, 7am - 7am -
AT10 Del Ray & Commonwealth 10pm
30 30 60
10pm
30 9am - 7pm 60 29.92 2.25 8.75 2 2 1 432 330 139 29.9 29.5 10.8
10:30/11a
m- 10am - 10am -
KST King Street Trolley
10:30pm/
10-15 10-15 10-15
12am
10-15
10:15pm
10-15 44.69 2.0 16.31 4/5 4/5 4/5 1,978 3,007 2,400 44.7 54.0 46.1
12am
10 | FY2020 – FY2025 ATC Transit Development Plan (Draft – Version 1)3.3 / Other Transit Providers
The DASH bus network in Alexandria provides a local complement to the regional transit network.
Regional operators that provide service to/from Alexandria include:
• Metrorail (WMATA). Metrorail operates heavy rail service to 91 stations throughout the
Washington, DC region, carrying roughly 600,000 passengers per weekday. The City of
Alexandria is served by the Blue and Yellow lines at four different Metrorail Stations – Braddock
Road, King Street, Eisenhower Avenue, and Van Dorn. DASH also provides service to the
Pentagon Metro Station during weekday peak periods. The new Potomac Yard Metrorail Station
– an in-fill station in northern Alexandria on Potomac Avenue – is slated to open in early 2022.
• Metrobus (WMATA). In addition to Metrorail, WMATA also operates a regional bus network
that carries about 400,000 passengers per weekday. Metrobus runs 28 routes that provide
service within the City of Alexandria. This includes the “Metroway” rapid bus service between
Pentagon City and Braddock Road Metro, and the Richmond Highway Express (REX), which
provides frequent, limited-stop service from Mount Vernon to Old Town via Route 1.
• Amtrak/Virginia Railway Express. Intercity and commuter rail services such as Amtrak and VRE
stop at Alexandria Union Station, before crossing the Potomac River into Washington, DC.
• Private Shuttles. Several dozen private shuttles operate within the City of Alexandria to provide
connections to Metrorail Stations. Examples include the NVCC shuttle, which runs from the
Alexandria campus to the King Street Metro, and the Van Dorn Exchange shuttle, which
connects the Van Dorn Exchange apartment complex with the Van Dorn Metro.
• Accessible Service. Accessible paratransit options are provided through the City of Alexandria’s
DOT program and the WMATA MetroAccess service.
3.4 / Passenger Facilities
DASH buses provide service to five Metorail Stations, five non-Metrorail transit centers (Landmark Mall,
Mark Center, Southern Towers, NVCC-Alexandria and Potomac Yard), and over 700 local bus stops.
Roughly 22 percent of these stops are shared by Metrobus or another provider. While DASH does not
currently have an updated, comprehensive bus stop inventory, staff estimates that roughly 90 DASH bus
stops have shelters, while another 200 have amenities such as benches and/or trash cans.
Approximately 100 stops (14 percent) have route schedules mounted on the bus stop poles. The
distribution of stop amenities is based primarily upon daily ridership, with shelters, benches and trash
cans generally installed at any stop with over 40 daily boardings.
In 2018, DASH began installing real-time bus arrival information
kiosks and tablets at various high-ridership locations throughout the
city. Major kiosks have been installed at City Hall, Southern Towers,
NVCC-Alexandria and NSF with additional screens planned for the
King Street Metro and Mark Center Transit Center. DASH has also
worked with WMATA to install solar-powered real-time tablets
similar to the one pictured at over 20 bus stops throughout the
service area.
11 | FY2020 – FY2025 ATC Transit Development Plan (Draft – Version 1)All DASH bus stops that have been installed or updated since 2006 are compliant with ADA design
standards for individuals using wheelchair or other mobility devices. DASH also coordinates closely with
city staff during the site plan review process to ensure any proposed developments include adequate
considerations for existing and future bus stops.
3.5 / Bus Fleet
DASH currently maintains a core bus fleet of 85 vehicles for use in daily revenue service. Roughly 74
vehicles are required during the weekday afternoon peak deployment period, including both trolleys
and regular buses. As part of its buildup to the Summer 2019 Metrorail Shutdown, DASH has
temporarily established a Contingency Fleet of 38 additional buses. A summary of the active and
contingency bus fleets is shown in Table 3-2.
Table 3-2 / DASH Bus Fleet Summary
ACTIVE BUS FLEET
Vehicle ID's Year Make Type Length # of Vehicles
91, 93-96, 99 2007 Orion Diesel 35’ 6
200-206 2011 Gillig Hybrid 35’ 7
300-302 2011 Gillig Hybrid 40’ 3
400-404 2011 Gillig (Trolley) Hybrid 29’ 5
207-211 2012 Gillig Hybrid 35’ 5
303-307 2012 Gillig Hybrid 40’ 5
212-216 2014 Gillig Hybrid 35’ 5
308-309 2014 Gillig Hybrid 40’ 2
217-229 2015 Gillig Hybrid 35’ 13
405 2015 Gillig (Trolley) Hybrid 35' 1
230-233 2017 Gillig Hybrid 35’ 4
310-311 2017 Gillig Hybrid 40’ 2
501-514 2018 Gillig Clean Diesel 35’ 14
515-527 2019 New Flyer Clean Diesel 35' 13
TOTAL ACTIVE FLEET 85
CONTINGENCY BUS FLEET
Vehicle ID's Year Make Type Length # of Vehicles
68, 69, 72, 73, 75, 76 2002 Orion Diesel 35’ 6
77-83, 85-90 2005 Orion Diesel 35’ 13
92, 97, 98 2007 Orion Diesel 35’ 3
101-103 2007 Gillig Diesel 35’ 3
601-611 2002-2003 Neoplan (B-Line) Diesel 60' 11
701-702 2004 Gillig (PRTC) Diesel 40' 2
TOTAL CONTINGENCY FLEET 38
TOTAL FLEET SIZE (ACTIVE + CONTINGENCY) 123
12 | FY2020 – FY2025 ATC Transit Development Plan (Draft – Version 1)In preparation for increased fleet needs associated with the WMATA Summer 2019 Platform Improvement Project, DASH has created a contingency fleet comprised of secondhand buses from other transit providers and DASH buses that were previously scheduled for retirement during FY 2019. Since these are older buses which will only be used during the rail shutdown and will be retired soon thereafter, they are not considered to be part of the active DASH fleet for FY 2020 and beyond. In order to maintain State of Good Repair, DASH is required to replace each bus once it reaches the end of its 12-year useful life cycle. A more detailed discussion of bus fleet replacement, expansion plans and the “DASH Capital Budget Program” is included in Chapter 6. 3.6 / Fares The current DASH base fare is $1.75 per trip with a four-hour transfer window. DASH allows free transfers from most other bus providers with SmarTrip, and provides a $0.50 discount for transfers to and from Metrorail. Disabled persons with valid Alexandria DOT or MetroAccess cards may board DASH buses for free. Two routes – the King Street Trolley and the Mark Center Express (AT-2X) – do not require fares as the operating costs are covered by dedicated external subsidies. For frequent riders, DASH also offers the monthly DASH Pass, which costs $45.00 and entitles the cardholder to unlimited rides on DASH buses during the specified month. DASH continues to accept SmarTrip cards for rapid, automated fare payment. Roughly 80 percent of DASH boardings are made using SmarTrip cards. DASH is working closely with WMATA as they continue to upgrade their fare technologies in the hopes of further increasing passenger convenience and overall operational efficiency. In May 2019, DASH plans to launch a one-year mobile ticketing pilot program, which will allow customers to purchase their DASH fare products on smartphones using debit cards, credit cards and selected e-wallet platforms. During the pilot period, passengers will be required to show the validation screen on their phone to the operator, but if the pilot is successful, DASH would implement electronic fare validation, which uses a small reader attached to the farebox to validate mobile fare payments. DASH will be the first bus agency in Northern Virginia to pilot a mobile ticketing application and is working closely with NVTC and other agencies so that the tool could expanded to other agencies throughout the region in the future. In FY 2018, DASH started a new one-year pilot program to allow T.C. Williams High School students to ride for free using their valid student identification cards. This program was extended due to popular demand in FY 2019 and expanded to include three additional schools – Bishop Ireton High School, Episcopal High School, and St. Stephens & St. Agnes School. During the 2018-2019 school year, DASH was also able to introduce Smartrip-enabled Student ID cards at each of the four schools so that students could tap their school-issued ID cards on the farebox to receive their free ride. 3.7 / Funding DASH service is operated by the Alexandria Transit Company (ATC), which is an independent public service corporation that is owned by the City of Alexandria. The City provides extensive input and guidance via the Transit Division of the city’s Department of Transportation & Environmental Services. City staff play an integral role in supporting the DASH annual budget request and managing a wide 13 | FY2020 – FY2025 ATC Transit Development Plan (Draft – Version 1)
variety of state and regional grant programs.

The majority of annual DASH operating funds comes from an operating subsidy that is allocated each
year from the City of Alexandria’s General Fund. The City also provides funding for operations through
the Transportation Improvement Program (TIP) and for capital investments through the biennial Capital
Improvement Program (CIP) process.

Additional external sources of DASH funding include the Virginia Department of Rail and Public Transit
(DRPT) and the Northern Virginia Transportation Authority (NVTA).

DASH also relies upon subsides to operate specific services such as the free King Street Trolley for the
City of Alexandria, and the Mark Center Express for the Department of Defense. Additional revenue is
also generated by bus charters for both public and private events.

Finally, passenger fare revenues typically cover between 20 and 25 percent of the annual DASH
operating costs, and are used to reduce the DASH operating subsidy from the city.

14 | FY2020 – FY2025 ATC Transit Development Plan (Draft – Version 1)
4.0 / System Performance

The overall performance of a bus system is typically measured in terms of service provided (revenue
hours), service consumed (ridership), cost efficiency (boardings per revenue hour, operating ratio), and
service reliability (on-time performance, missed trips, miles between road calls and customer feedback).
Additional metrics such as access and mobility should also be considered. The following sections use FY
2018 data to review DASH service performance at both the system and route levels.

4.1 / Service Provided

In FY 2018, DASH operated just over 215,000 hours of revenue bus service. This represents a 1.5
percent increase over FY 2017 service levels. A graph showing the historic trend in DASH annual
revenue hours for the last ten years is shown in Figure 4-1.

                         Figure 4-1 / DASH Annual Revenue Hours (FY09-FY18)

4.2 / System Ridership

As shown in Figure 4-2, annual ridership has fluctuated dramatically over the last decade. After a steep
decline between FY 2009 and FY 2011, ridership numbers increased dramatically in FY 2012 and FY 2013.
In the last three years, however, ridership has again shown a distinct downward trend. In FY 2018,
DASH recorded just under 3.9 million passenger boardings, which was down roughly 1.9 percent from FY
2017, and down 5.7 percent from FY 2016.

In terms of daily boardings in FY 2018, DASH drew an average of 12,800 boardings on weekdays, just
over 7,000 boardings on Saturdays, and over 4,700 boardings on Sundays. This translates to an
approximately 1.2 percent decrease in weekday boardings from FY 2017. Average Saturday and Sunday
boardings were also down by 2-4 percent. Although these numbers represent decreases from FY 2017,
the annual rate of ridership decrease is noticeably lower than the percent of riders lost between FY 2016
and FY 2017. For example, weekday ridership decreased by 5.0 percent between FY 2016 and FY 2017,
but decreased by only 1.9 percent from FY 2017 to FY 2018.

15 | FY2020 – FY2025 ATC Transit Development Plan (Draft – Version 1)
Figure 4 -2 / DASH Annual Ridership (FY09-FY18)
5,000,000
Annual Boardings 4,500,000
4,000,000
3,500,000
3,000,000
2,500,000
2,000,000
FY09 FY10 FY11 FY12 FY13 FY14 FY15 FY16 FY17 FY18
The recent DASH ridership decreases are part of a larger trend affecting agencies throughout the
Washington, DC region and across the country. A combination of low fuel prices and the advent of
ridesharing services like Uber and Lyft have helped reduce transit mode splits across the country.
Within the Washington, DC area, the backbone of the regional transit network, Metrorail, has been
disrupted by ongoing service reliability issues and the recent Safetrack program in 2016 and 2017.
Given the large percentage of DASH passengers that transfer to the Metrorail system, DASH ridership
has also been negatively impacted. Increased telecommuting and changing travel habits have also
contributed.
For comparison purposes, the annual ridership statistics for DASH and six other local transit providers
from FY 2017 and FY 2018 are included in Figure 4-3. All six providers experienced decreases in bus
ridership. Arlington Transit saw the greatest drop (13 percent), while the Fairfax Connector, Fairfax CUE,
Loudoun County, and PRTC/Omniride all saw decreases of 4-6 percent. These decreases are all more
severe than the two percent decrease experienced by DASH during that same period. Although not
shown on the NVTC graph, Metrobus ridership in Virginia declined by roughly 8 percent from FY 2017 to
FY 2018. Metrorail ridership in FY 2018 was roughly equal to the preceding year.
In an effort to attract additional ridership, DASH has initiated programs like the “Free Student Rides”
program for high school students, the introduction of free rides for Metroaccess and DOT paratransit
program participants, and reduced fares for senior riders who use their Senior SmarTrip cards during off-
peak periods. The “Free Student Rides” program has been particularly successful, drawing rave reviews
and as many as 1,400 student boardings on a typical school day. The free fares for DOT members have
also been popular with over 120 boardings on a typical weekday.
16 | FY2020 – FY2025 ATC Transit Development Plan (Draft – Version 1)Figure 4 -3 / Annual Ridership for Northern Virginia Transit Agencies (FY17 vs. FY18) 4.3 / Ridership by Route At the route level, Figure 4-4 shows that while many DASH routes have declined in weekday ridership over the last three years, several have rebounded in FY 2018. The AT-1, AT-2 and AT-5, AT-8 and AT-9 all showed modest improvements as compared to FY 2017. The largest declines were on the AT-4 and the King Street Trolley, which decreased by 7 percent, possible due to the reductions in service hours on weekday mornings. Weekend ridership has decreased on most DASH routes since FY 2016 but appears to have leveled out over the last year. As shown on Figure 4-5, average Saturday boardings on the AT-9 and AT-10 have increased by 14 and 4 percent, respectively since FY 2017. King Street Trolley ridership on Saturdays is down by 1 percent from last year. On Sundays, overall ridership on regular DASH routes is down by roughly four percent. As shown on Figure 4-6, the AT-2 has increased by over 7 percent since FY 2017, but the AT-1, AT-3/4 The AT-5 and AT-8 have dropped by 4-5 percent each. Sunday boardings on the AT-10 are down by 11 percent from last year. King Street Trolley ridership was up by four percent on Sundays. As noted in the previous subsection, the route-level ridership numbers for the final four months of FY 2017 were underreported due to a farebox configuration error on a set of new buses. As a result, the route-level numbers are estimate to actually be 2-4 percent higher than noted in this section, which may mean that the improvements in year-over-year ridership for FY 2018 may be overstated by these graphs. 17 | FY2020 – FY2025 ATC Transit Development Plan (Draft – Version 1)
Figure 4-4 / Average WEEKDAY Ridership by Route (FY15-FY17)

                                     3,000
         Average Weekday Boardings
                                     2,500

                                     2,000

                                     1,500

                                     1,000

                                      500

                                        0
                                             AT1     AT2   AT2X    AT3      AT4 AT3-4 AT5          AT6    AT7   AT8     AT9     AT10 Trolley

                                                                  FY 2016        FY 2017            FY 2018

                                             Figure 4-5 / Average SATURDAY Ridership by Route (FY16-FY18)

                                     3500
                                     3000
                                     2500
                                     2000
                                     1500
                                     1000
                                      500
                                         0
                                               AT1         AT2      AT3-4        AT5         AT8         AT9     AT10         Trolley

                                                                     FY 2016      FY 2017      FY 2018

                                              Figure 4-6 / Average SUNDAY Ridership by Route (FY16-FY18)

                                     3000

                                     2500

                                     2000

                                     1500

                                     1000

                                      500

                                         0
                                               AT1          AT2          AT3-4         AT5          AT8         AT10      Trolley

                                                                     FY 2016      FY 2017      FY 2018

18 | FY2020 – FY2025 ATC Transit Development Plan (Draft – Version 1)
4.4 / Cost Efficiency
Ridership data alone only tells part of the story. In order to determine the cost efficiency of the system,
ridership numbers must be compared to revenue hours to determine how efficiently the system and its
routes are operating. This metric is typically expressed in boardings per revenue hour. In FY 2018, DASH
drew 23.0 weekday boardings per revenue hour, 26.0 Saturday boardings per revenue hour, and 33.9
Sunday boardings per revenue hour. These boardings per revenue numbers decreased slightly from FY
2017, which were roughly 23.1, 27.1, and 34.6 for weekdays, Saturdays and Sundays, respectively.
Route-by-route boardings per revenue hour for weekdays, Saturdays and Sundays in FY 2018 are shown
in Figure 4-7. Routes with the highest weekday productivity include the King Street Trolley and the AT-8.
The least productive weekday routes are the AT2X and the AT3-4, which both draw five boardings per
hour or fewer. On weekends, the AT-1, AT-8 and King Street Trolley maintain an average productivity at
or above 15 boardings per revenue hour. The AT-3/4 and AT-9 both operate below 5 boardings per
revenue hour on weekends.
Figure 4-7 / Average Boardings per Revenue Hour by Route and Day (FY 2018)
4.5 / Operating Ratio
One other common measure of cost efficiency in transit planning is the Operating Ratio, which measures
the percent of total operating costs that are covered by passenger fares. Presumably, an efficient, well-
designed transit system will generate higher ridership and greater fare revenues per unit cost of
operating expense than a less efficient system. Based on FY 2014 and FY 2016 NTD data, the normal
range for operating ratios is 15 to 25 percent. For FY 2017, DASH recorded an operating ratio of 30
percent, which was down from three percent in FY 2016. The annual DASH operating ratios for the last
five years are shown in Figure 4-8.
19 | FY2020 – FY2025 ATC Transit Development Plan (Draft – Version 1)Figure 4-8 / Annual DASH Operating Ratio (FY14 - FY18) 4.6 / Service Reliability DASH is working to identify and address service reliability deficiencies that may have a negative impact on ridership and customer satisfaction. Service reliability can be measured by on-time performance, missed trip percentage, average miles per road call and customer feedback. It is important to note that service reliability is invariably tied to service frequency since the consequences of a missed trip are far less significant if the next bus is only 10 minutes away instead of 60 minutes away. The most common indicator for service reliability is on-time performance. DASH recently implemented an Automated Vehicle Locator (AVL) system that tracks vehicle location and evaluates on-time performance with a much higher degree of accuracy than previous manual time checks. FY 2017 data collected using the manual process indicates that DASH was running “on-time” roughly 94 percent of the time, however, this data is typically collected by field supervisors during less busier periods and is likely skewed. For CY 2018, the new AVL data indicates that the actual on-time performance was roughly 82 percent, which is slightly lower than the industry standard of 85%. Planning staff are continuing to test the validity of this new method, which likely underestimates the on-time performance of buses to the final timepoint on each trip. A chart showing weekday on-time performance by route is also included as Figure 4-9. The AT-1 is the most reliable route, likely due to the fact that its one of the few DASH routes that stays in western Alexandria and doesn’t venture in Old Town. Most of the other routes average just over 80 percent on- time performance on weekdays. The most challenging time of day for on-time performance is the weekday afternoon peak period. Overall on-time performance during the PM peak is roughly 76 percent, compared to 85 percent for the rest of the day. Although all routes are less reliable during the afternoon peak hour, the decrease for the AT-1, AT-7 and AT-8 are particularly noticeable. 20 | FY2020 – FY2025 ATC Transit Development Plan (Draft – Version 1)
Service reliability is also often impacted by the performance of the DASH maintenance department,
which is responsible for ensuring that buses are maintained in good operating shape to minimize the
chances for breakdowns and missed trips. In FY 2017, DASH averaged over 14,700 miles per road call,
which was a marked improvement from 12,800 miles per road call in FY 2017 and well above the
industry average (11,500 miles per road call). The FY 2018 total missed trip percentage was 0.028
percent, which was approximately 33 percent higher than the 0.021 percent of trips that were missed in
FY 2017.

           Figure 4-9 / Weekday On-Time Performance by Route and Time Period (CY 2018)

Another, more indirect measure of service reliability is customer feedback. The DASH Customer Service
Department is responsible for documenting and categorizing all calls and e-mails that are received from
passengers. In FY 2017, DASH received 39 valid complaints relating to schedule adherence. This was up
dramatically from the 19 similar complaints that were registered in FY 2017, but is consistent with the
40 complaints that were registered in FY 2016.

4.7 / Access & Mobility

Two last performance measures depicts the degree to which transit directly improves local access and
mobility. The fundamental purpose of public transit is to provide access to opportunities (e.g. jobs,
housing, schools, shopping centers, day cares, civic centers, etc); therefore, the true measurement of
access and mobility would be access to transit and the number of these “opportunities” that are easily
accessible via transit.

Figure 4-10 provides a summary of access to the current DASH bus network for all residents, non-white
residents, residents in poverty, and jobs in Alexandria. Access is measured by the percentage of each

21 | FY2020 – FY2025 ATC Transit Development Plan (Draft – Version 1)
group that are within a quarter-mile walking distance of transit service at 12pm on a weekday, or the
baseline off-peak service. As shown below, the current DASH bus network does an exceptional job of
providing access to basic transit for each of the groups identified below, however, the access to frequent
all-day transit among these groups is virtually non-existent. This is a common theme that will be
discussed through the Alexandria Transit Vision Plan process.
Figure 4-10 – Access to Transit & High-Frequent Transit
The second metric, mobility, can be derived from the isochrone maps that are included as Figures 4-11
and 4-12. Each map assumes that a fictitious transit user – represented as a stick figure – is at a selected
location at a certain day and time. The colored isochrone shapes represent the area that can be reached
from that specified location on the specified day and time using DASH or walking based on an average
trip times of 15 minutes (white), 30 minutes (blue), 45 minutes (teal), and one hour (red). The trip time
calculation accounts for both travel time, and waiting time based on route frequencies. The larger the
isochrone shape, the more access to locations with different types of “opportunities” described above.
As an example, Figure 4-11 compares the mobility of a transit user at the King Street Metro during a
weekday peak and a Saturday. Since the service levels are higher during the weekday peak, the size of
the isochrone shapes on the left side are larger, particularly the blue area that shows how far the user
can travel within 30 minutes. On weekdays, that person could travel from the King Street Metro to
Foxchase Shopping Center within 30 minutes, but on a Saturday afternoon, it would take 40 minutes or
longer on average. Therefore the larger colored areas equate to greater access to more opportunities
via transit within a short period of time.
With the introduction of frequency and span improvements from the Alexandria Transit Vision Plan,
these mobility metrics are expected to improve dramatically.
22 | FY2020 – FY2025 ATC Transit Development Plan (Draft – Version 1)Figure 4-10 / Mobility Comparison to/from King Street Metro
Weekday – 5 PM Saturday – 5 PM
Figure 4-11 / Mobility Comparison to/from Stoneridge Apartments
Weekday – 8 AM Sunday – 4 PM
4.9 / System Performance Summary
Despite slight increases in total annual revenue hours, DASH has experienced an overall decrease in
ridership on most routes over the last two year, and consequently a decrease in key measures of cost
efficiency; the operating ratio has dropped from 33 percent in FY 2017 to 30 percent in FY 2018, and the
boardings per revenue hour are down by 2-3 percent over the same period. Although these ridership
declines are part of a larger national trend, local factors such as WMATA’s Safetrack program, increased
telecommuting, the proliferation of ridesharing and recent DASH service changes likely also have played
a role.
In terms of another key metric, service reliability, DASH performs well but tends to experience
significantly reduced on-time performance during the weekday afternoon commute period, particularly
on routes such as the AT-5 and AT-8 that must navigate through the heavy traffic in Old Town
Alexandria.
23 | FY2020 – FY2025 ATC Transit Development Plan (Draft – Version 1)5.0 / Service & Fare Recommendations
The following section provides a series of recommendations for future service improvements and fare
adjustments. These recommendations are based on staff analyses and guidance from the General
Manager and ATC Board of Directors. The recommendations are organized chronologically, beginning
with the service and fare assumptions from the FY 2020 ATC budget request. General service and fare
recommendations for the rest of the six-year plan cycle (FY 2021 – FY 2025) are also included, but more
detailed route-level recommendations are omitted since they will be largely determined over the next 6-
12 months by the Alexandria Transit Vision Plan.
5.1 / Service Recommendations (FY 2020)
As part of the FY 2020 budget development process, DASH is planning the following fiscally-constrained
service level assumptions:
• No major service changes are proposed to regular DASH routes for FY2020. Due to uncertainty
surrounding the Alexandria Transit Vision Plan, no major service improvements are planned in
FY 2020, other than those which are tied to I-395 Commute Choice Program funding or the
Summer 2019 Metrorail Shutdown.
• Platform miles and hours are projected to remain flat in FY 2020 compared to the adopted FY
2019 DASH budget assumptions. Excluding the I-395 Commuter Choice program improvements
and additional service provided in response to WMATA’s Summer 2019 Platform Improvement
Project, DASH projects that FY 2020 service levels for regular DASH routes and the King Street
Trolley will remain flat as compared to FY 2019 (237,000 annual platform hours).
• Projected Operating Ratio of 31.7% represents a slight decrease from 33.7% in FY 2019
adopted budget. This decrease is attributed to declining ridership, the federal government
shutdown in January, the King Street Metro Access Improvement Project, and expected effects
of the Summer 2019 Metro Platform Improvement Project.
• DASH to play key role in mitigating impact of Summer 2019 Metrorail Shutdown. DASH has
agreed to operate shuttle service during the first phase of WMATA’s Platform Improvement
Project, which is a shutdown of all Metrorail stations south of National Airport from Memorial
Day to Labor Day 2019. DASH will be operating the Blue Line Shuttle seven days per week
during this shutdown period, and will provide enhanced service on the AT3, AT4 and King Street
Trolley on weekdays to help mitigate the impact of the closure. The vast majority of operating
costs for these services will be reimbursed by WMATA and DRPT.
• DASH to seek operating funding from I-395 toll funding program for service improvements. As
part of the inaugural I-395 Commuter Choice program for disbursement of toll revenues from
the new I-395 Express Lanes, DASH will be submitting applications to enhance service on several
DASH routes that provide local and express bus service along the I-395 corridor. These
improvements will be compatible with the pending final recommendations of the Alexandria
Transit Vision Plan, and would be implemented starting in October 2019.
24 | FY2020 – FY2025 ATC Transit Development Plan (Draft – Version 1)• Ridership decline of the last three years is expected to subside. Based on early FY 2018
ridership trends, planning staff correctly projected that ridership would only decrease by two
percent in FY 2018. Early trends for FY 2019 suggest that ridership may stabilize in FY 2020 with
overall increases in ridership on regular DASH routes and a moderate decrease on the King
Street Trolley.
• King Street Metro Access Improvements. The planned renovation and expansion of the existing
King Street Metro transit center began in November 2018 and is expected to last until early
2020. During the initial 18-month project phase, the transit center is closed for construction and
all bus stops have been temporarily relocated to the surrounding street network. At the end of
Phase I, the new King Street Metro transit center will open with three additional bus bays and a
more efficient bus circulation pattern. Additional changes to the route alignments, timetables,
and layover locations will be implemented at that time.
• Other Metrorail Station Improvements. Additional projects at the Eisenhower Avenue, Van
Dorn and Braddock Road Metro Stations are planned during the Summer 2019 Metrorail
Shutdown to increase bus capacity and improve circulation. DASH plans to coordinate with
WMATA and the City of Alexandria on these projects and will adjust bus service at these
locations as needed.
5.2 / Fare Recommendations (FY 2020)
As part of the FY 2020 budget development process, DASH is planning to implement the following fare
changes to increase passenger revenues and improve the organization’s long-term financial stability:
• Increase base fare from $1.75 to $2.00. This represents a 12.5 fare increase, that will put DASH
at the same level as the $2.00 base fares that are currently charged by neighboring transit
providers (Metrobus, ART, Fairfax Connector, RideOn and PRTC). This change is proposed to be
implemented at the completion of the Summer 2019 Metrorail Shutdown on September 1,
2019.
• Increase monthly DASH Pass cost from $45 to $50. This fare increase in DASH Pass cost will
increase the average monthly DASH Pass savings from 10 cents to 16 cents per trip as compared
to paying the new $2.00 base fare throughout the month. This change is proposed to be
implemented at the completion of the Summer 2019 Metrorail Shutdown on September 1,
2019.
• DASH will implement a Mobile Ticketing Pilot program. In May 2019, DASH plans to launch a
one-year mobile ticketing pilot program, which will allow customers to purchase their DASH fare
products on smartphones using debit cards, credit cards and selected e-wallet platforms. During
the pilot period, passengers will be required to show the validation screen on their phone to the
operator, but if the pilot is successful, DASH would implement electronic fare validation, which
uses a small reader attached to the farebox to validate mobile fare payments. DASH will be the
first bus agency in Northern Virginia to pilot a mobile ticketing application and is working closely
with NVTC and other agencies so that the tool could expanded to other agencies throughout the
region in the future.
25 | FY2020 – FY2025 ATC Transit Development Plan (Draft – Version 1)You can also read