California Statewide Rural Intercity Bus Study Update - March 30, 2018 - PacificCBPR
←
→
Page content transcription
If your browser does not render page correctly, please read the page content below
California Statewide Rural Intercity Bus
                    Study Update

                                                        March 30, 2018

California Statewide Rural Intercity Bus Study Update                    1
California Statewide Rural Intercity Bus Study Update

Prepared for:

California Department of Transportation

Division of Rail and Mass Transportation

1120 N Street

Sacramento, CA 95814

Prepared by:

Center for Business and Policy Research

Eberhardt School of Business

McGeorge School of Law

Stockton and Sacramento, CA

California Statewide Rural Intercity Bus Study Update   2
Contents
Chapter 1 - Introduction .............................................................................................................. 7
  1.1    Definition of Rural Regional Intercity Bus System ........................................................... 7
  1.2    Overview of Study ............................................................................................................ 8
  1.3    Recommendations ........................................................................................................... 9
  1.4    Organization of the Report .............................................................................................. 9
Chapter 2 - Policy Context and Methodology............................................................................ 10
  2.1    Federal Policies and Plans .............................................................................................. 10
  2.2    State Policies and Plans .................................................................................................. 11
  2.3    Local Policies and Plans .................................................................................................. 14
  2.4    Methodology .................................................................................................................. 15
Chapter 3 - Inventory of Intercity Service.................................................................................. 16
Chapter 4 - Assessment of Intercity and Rural Regional Bus Service ........................................ 33
  4.1    Rural Transit Dependent Population Needs .................................................................. 33
  4.2    Rural Regional Service Needs ......................................................................................... 42
    Airports .................................................................................................................................. 42
    Colleges/Universities ............................................................................................................. 42
    Correctional Facilities ............................................................................................................ 43
    Hospitals ................................................................................................................................ 43
    Military Bases ........................................................................................................................ 47
    Tribal Lands............................................................................................................................ 47
  4.3    Policy, Socio-Economics and Other Influences on Intercity Dynamics .......................... 52
    Urban Access to Rural Areas ................................................................................................. 52
    Incidental Policy Influences ................................................................................................... 53
    Emergency and Disaster Response and Recovery................................................................. 54
    Population Dynamics ............................................................................................................. 55
Chapter 5 - Recommendations and Action Plan ........................................................................ 57
  5.1    Short-Run Funding of Intercity and Rural Regional Mobility Services ........................... 57
    Recommendation 1: Revised 5311(f) Project Funding Criteria ............................................. 58
  5.2    Short-Run Coordination and Integration of Rural Regional Mobility Services .............. 58
    Recommendation 2: Leveraging existing initiatives and resources ...................................... 58
  5.3    Reorganization of Intercity and Rural Regional Mobility Services ................................. 59
    Recommendation 3: Transform the Funding System ........................................................... 59
    Recommendation 4: Transform Organizational Structures .................................................. 60
    Recommendation 5: Transform Planning Structures ............................................................ 60
    Recommendation 6: Enhance Marketing & Integration of Rural Regional Intercity Transit 60

California Statewide Rural Intercity Bus Study Update                                                                                           3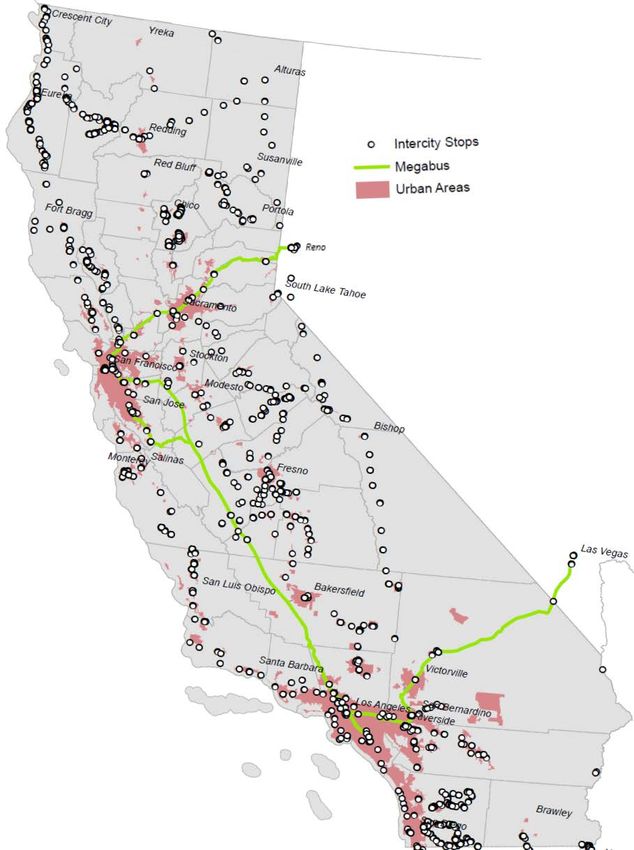
Tables
Table 1: California’s Estimated 5311(f) Funding Apportionment ................................................. 10
Table 2: Example Allocations of CMAQ Funds for Operating Assistance ..................................... 11
Table 3 5311(f) Funded Intercity Transportation Providers in FY2018 ........................................ 16
Table 4 Private for-profit intercity operators and select other intercity bus service providers .. 17
Table 5 Statewide Inferred Population Transit Needs.................................................................. 41
Table 6 Correctional facilities over ten miles from a regional intercity bus network stop .......... 43
Table 7 Hospitals over ten miles from a regional intercity bus network stop ............................. 43
Table 8 Military bases over ten miles from a regional intercity bus network stop ...................... 47
Table 9 Tribal Homelands over ten miles from a regional intercity bus network stop ................ 47
Table 10 Forecast Population Growth .......................................................................................... 56
Table 11 Revised 5311(f) Funding Criteria .................................................................................... 58

California Statewide Rural Intercity Bus Study Update                                                                          4
Figures
Figure 1 Interregional Corridor Areas ........................................................................................... 19
Figure 2 Intercity Bus Service in California ................................................................................... 20
Figure 3 Intercity Bus Services in Southern California .................................................................. 21
Figure 4 Intercity Bus Services in Central California ..................................................................... 22
Figure 5 Intercity Bus Services in Northern California .................................................................. 23
Figure 6 Intercity Bus Services in California – Amtrak Thruway Bus ............................................ 24
Figure 7 Intercity Bus Services in California – Bolt Bus................................................................. 25
Figure 8 Intercity Bus Services in California - Greyhound ............................................................ 26
Figure 9 Intercity Bus Services in California – Hoang Express Buss .............................................. 27
Figure 10 Intercity Bus Services in California – LuxBus................................................................. 28
Figure 11 Intercity Bus Services in California – Megabus ............................................................. 29
Figure 12 Intercity Bus Services in California – Orange Belt Line ................................................. 30
Figure 13 Intercity Bus Services in California – Transportes Intercalifornias ............................... 31
Figure 14 Intercity Bus Services in California – FY 2018 5311(f) Funded Routes ......................... 32
Figure 15 Relative Density of Transit Dependent Populations in Southern California................. 35
Figure 16 Relative Density of Transit Dependent Populations in Central California .................... 36
Figure 17 Relative Density of Transit Dependent Populations in Northern California................. 37
Figure 18 Transit Dependent Populations and Intercity Services in Southern California ............ 38
Figure 19 Transit Dependent Populations and Intercity Services in Central California ............... 39
Figure 20 Transit Dependent Populations in Northern California ................................................ 40
Figure 21 Correctional Facilities over 10 Miles from a Regional Intercity Network Bus Stop...... 44
Figure 22 Correctional Facilities over 25 Miles from a Regional Intercity Network Bus Stop...... 45
Figure 23 Hospitals more than 10 Miles from a Regional Intercity Network Bus Stop ................ 46
Figure 24 Military Bases More than 10 Miles from a Regional Intercity Network Bus Stop ........ 48
Figure 25 Military Bases more than 25 Miles from a Regional Intercity Network Bus Stop ........ 49
Figure 26 Tribal Lands more than 10 Miles from a Regional Intercity Network Bus Stop ........... 50
Figure 27 Tribal Lands more than 25 Miles from a Regional Intercity Network Bus Stop ........... 51
Figure 28 Visitors to Select National Parks, Monuments & Historic Places in California ............. 53
Figure 29 Transit dependent population needs by corridor area ................................................ 54

California Statewide Rural Intercity Bus Study Update                                                                             5

Glossary of Acronyms
5311(f)            FTA Section defining the intercity   NCHRP    National Cooperative Highway
                   bus program                                   Research Program
ACS                American Community Survey            NEMT     Non-Emergency Medical
AP                 Aviation Plan                                 Transportation
CA                 Capital Assistance                   OA       Operating Assistance
CAL                Calipatria State Prison              RABA     Redding Area Bus Authority
CalACT             California Association for           RTAP     Rural Transit Assistance Program
                   Coordinated Transportation           RTP      Regional Transportation Plan
Caltrans           California Department of             RTPA     Regional Transportation Planning
                   Transportation                                Agencies
CEN                Centinela State Prison               SDMTS    San Diego Metropolitan Transit
CEQA               California Environmental Quality              System
                   Act                                  SB1      Senate Bill 1, known as the Road
CIBS               California Intercity Bus System               Repair and Accountability Act
CTP                California Transportation Plan       SBPP     State Bicycle and Pedestrian Plan
CMAQ               Congestion Mitigation and Air        SCS      Sustainable Communities Strategy
                   Quality                              SRP      State Rail Plan
CVSP               Chuckawalla Valley State Prison      SRTP     Short-Range Transit Plans
DRMT               Division of Rail and Mass            STSP     Statewide Transit Strategic Plan
                   Transportation                       TIP      Transportation Improvement
ESTA               Eastern Sierra Transit Authority              Program
FAA                Federal Aviation Administration      TTIP     Tribal Transportation Improvement
FAST               Fixing America’s Surface                      Program
                   Transportation                       U.S.C.   United States Code
FCRTA              Fresno County Rural Transit          YARTS    Yosemite Area Regional
                   Agency                                        Transportation System
FMCSA              Federal Motor Carrier Safety
                   Administration
FMP                Freight Mobility Plan
FTA                Federal Transit Administration
FY                 Fiscal Year
GHG                Greenhouse Gas
IMDP               Individual Marketing
                   Demonstration Program
ISP                Ironwood State Prison
ITSP               Interregional Transportation
                   Strategic Plan
KT NET             Klamath Trinity Non-Emergency
                   Transportation
LAX                Los Angeles International Airport
MAP-21             Moving Ahead for Progress in the
                   21st Century Act
MARTA              Mountain Area Regional Transit
                   Authority
MCSP               Mule Creek State Prison
MPO                Metropolitan Planning
                   Organization
MST                Monterey-Salinas Transit
MTA                Mendocino Transit Authority
NCES               National Center for Education
                   Statistics

California Statewide Rural Intercity Bus Study Update                                           6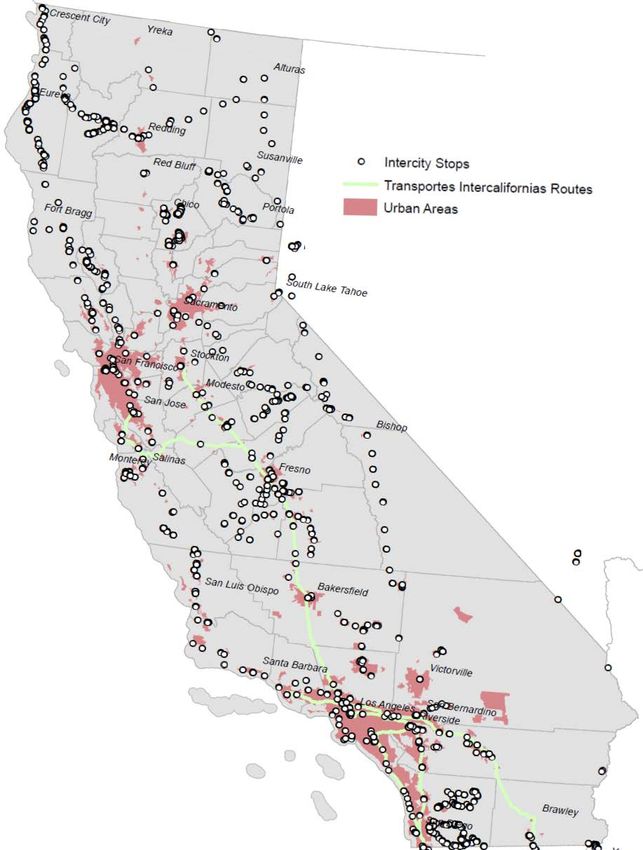
Chapter 1 - Introduction

The purpose of this study is to provide Caltrans, Division of Rail and Mass Transportation
(DRMT) and other stakeholders with an objective evaluation of the rural intercity bus network
that currently exists in California and to identify the changes that have occurred in that network
since the 2008 Statewide Rural Intercity Bus Study. This study is also intended to provide an in-
depth analysis, findings, and recommendations on how to meet future rural intercity bus needs.
In pursuit of these objectives, the study has sought to identify and promote partnerships,
encourage cross-jurisdictional coordination, and ensure that there is efficient and effective
connectivity for a sustainable rural intercity bus transportation network.

1.1 Definition of Rural Regional Intercity Bus System
As California’s designated grantee Caltrans DRMT provides critical support for California’s
intercity bus system with funding from the Federal Transit Administration (FTA) Section 5311(f)
rural intercity bus program. However, needs in rural communities have necessitated that this
program is leveraged to assist rural regional mobility as well. This section describes what
constitutes this “rural regional intercity bus system”.

In a broad sense, the intercity bus system includes services operated by private firms, non-
profits, and public transit entities with federal, state, or local operating or capital assistance, as
well as services operated by private firms and non-profits without any public assistance. The
FTA defines intercity bus service as a unique mode of transit with: “Regularly scheduled bus
service for the general public that operates with limited stops over fixed routes connecting two
or more urban areas not in close proximity, that has the capacity for transporting baggage
carried by passengers, and that makes meaningful connections with scheduled intercity bus
service to more distant points, if such service is available.”

In California, rural area operators face several challenges in providing transit services. Their trip
densities are frequently too low to meet normal ridership and cost-efficiency standards, they
are often operating in harsh climates, and fiscal resources are typically very limited. At the
same time many rural areas have an increasing number of elderly and other transit dependent
populations who rely on their services. The FTA defines rural public transit as: “Surface
transportation by conveyance that provides regular and continuing general or special
transportation to the public, but does not include school bus, charter, or intercity bus
transportation” that is provided in a “non-urbanized area which includes rural areas and urban
areas under 50,000 in population not included in an urbanized area.”

California Statewide Rural Intercity Bus Study Update                                                7
A recent study by the National Cooperative Highway Research Program (NCHRP) 1 describes the
mode of transit services between rural public transit and rural intercity bus service as rural
regional transit. It is defined as the services which “provides transportation for the general
public from a rural area across the county, or other jurisdictional boundaries, to serve a
destination that has services (e.g., medical, educational, employment, retail, government) not
available in the rural area.” While Section 5311(f) requirements for a meaningful connection to
the national intercity bus network constrain that program’s ability to provide impactful rural
regional transit, the limited resources available to support this important class of transit service
in rural areas has meant that the intercity bus program in California is an important resource for
rural regional transit and integrally linked with that system. As such, it is necessary to look at
the broader rural regional intercity bus system rather than artificially limit the analysis to the
rural intercity bus system.

1.2 Overview of Study
The Rural Transit Program (49 United State Code, Section 5311) provides formula funding to
support public transportation in rural areas. These funds are apportioned by the FTA to each
state’s non-urbanized county or region based upon population information from the U.S.
Census Bureau. A subset of this program is the FTA Section 5311(f) Rural Intercity Bus Program
wherein the state must use 15 percent of its annual apportionment to support rural intercity
bus service, unless the governor certifies that the needs of the state are adequately met. In
California, the primary emphasis of the FTA Section 5311(f) Rural Intercity Bus Program has
been to support the following three national program objectives:

•          Connectivity between rural communities and the larger regional or national system of
           intercity bus service.
•          Services that meet the rural intercity travel needs of residents in non-urbanized areas.
•          Infrastructure of the rural intercity bus network through planning, marketing assistance,
           and capital investment in facilities.

However, recent decreases in funding have meant that the 5311(f) program has limited
resources to address all these objectives. Therefore, this study seeks to provide
recommendations for how the needs of California’s rural regional intercity bus system can best
be met while continuing to address the program’s objectives.

1
    Best Practices in Rural Regional Mobility (2017). NCHRP

California Statewide Rural Intercity Bus Study Update                                                 8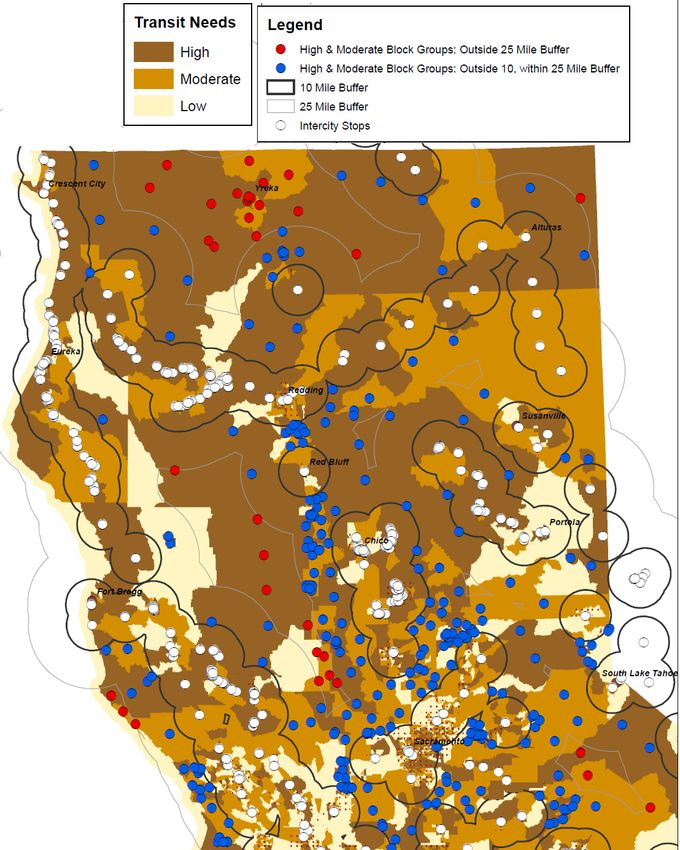
1.3 Recommendations
In addressing the needs of the statewide rural regional bus system, immediate actions and
longer-term solutions have been identified. Owing to the 5311(f) program’s decreased funding,
a priority of this analysis was to develop revised funding criteria. In consultation with existing
program recipients and potential applicants, as well as user representative organizations, key
priorities of the 5311(f) program were identified. Those priorities were then translated into
revised scoring criteria for the 5311(f) program. These criteria provided a partial solution to the
immediate challenge of available funding declines, but do not address the broader needs of
California’s rural regional intercity bus system. Immediate opportunities to leverage other
initiatives and resources such as those in the State Rail Plan (SRP) and the Road Repair and
Accountability Act (SB 1) through existing structures in the statewide regional intercity system
should also be pursued.

Addressing longer-term solutions for the system, the study identifies and describes a more
fundamental restructuring of the rural regional intercity system as an enduring transformation
that could address the long-term needs of the system. Drawing on lessons from other states as
well as California’s diverse geographic and demographic structures, this transformation would
target reformulating the organizational, funding, and planning structures of the system. It also
looks to further develop comprehensive partnerships that exist in many regions for planning
infrastructure investments and use them to enhance marketing and demand for the rural
regional intercity bus network.

1.4 Organization of the Report
This report documents the study process, its key findings and recommendations. Following this
initial introduction, Chapter 2 presents on overview of the study’s context and methodology.
Changes in Federal, State, and Local transit policies and plans relevant to the rural regional
intercity system are reviewed, then the study’s methodology is discussed. Chapter 3 identifies
the structure of the system and its changes since the 2008 study. Chapter 4 presents an
assessment of the intercity system’s needs. This is accomplished through statewide reviews of
rural transit dependent populations, rural regional service needs and relationships between
policy planning focuses and area growth dynamics. Chapter 5 identifies issues from the analysis
and presents policy programs and recommends program changes to address the system’s
needs.

California Statewide Rural Intercity Bus Study Update                                             9
Chapter 2 - Policy Context and Methodology

There have been several policy and planning changes affecting the rural regional intercity bus
system since the previous, 2008, study. Perhaps the most significant change to the system has
been the recent reduction in available funds for the 5311(f) program. This chapter discusses
that change and other significant differences in the system’s context. It begins with a review of
Federal policies and plans that impact the system and is followed by a similar section on State
policies and plans before concluding with a summary of issues identified through a review of
local planning documents and outreach.

2.1 Federal Policies and Plans
Overall, the federal policy and planning environment has not changed significantly, but the
reduction in Section 5311 funding to California has been significant because of the associated
reductions in 5311(f) funding it incurred. Table 1 shows that Federal 5311(f) funding in FY2017
was 30% less than FY2013 funding levels. This has been compounded by an end of Caltrans fund
savings adding additional resources to the program, resulting in a reduction in available funds
from over $7 million annually to around $4.1 million in the foreseeable future. At the same time
there has been rising demand for 5311(f) funding from across the state. While only 5 agencies
received funding in fiscal year (FY) 2010, by FY2017 the program was supporting some 13
agencies despite having less apportioned funds.

Table 1: California’s Estimated 5311(f) Funding Apportionment
 Federal                                                Number of Agencies
 Fiscal Year      FTA 5311(f) Apportionment*             Receiving Funding
 2017             $4,172,586                                     13
 2016             $4,094,808                                     13
 2015             $4,128,681                                     17
 2014             $4,129,281                                     19
 2013             $5,985,522                                     19
 2012             $5,127,215                                     9
 2011             $4,851,555                                     8
 2010             $4,804,765                                     5
 *Estimated at 15% of 5311 Program Apportionment
 Source: FTA, Annual Apportionments www.fta.dot.gov

Besides the reduced 5311 program funds, most policy changes of direct relevance to the rural
regional intercity system concerned updates of legislation that govern FTA’s grant programs.
The Moving Ahead for Progress in the 21st Century Act, (MAP-21) of 2012, and subsequently
the Fixing America's Surface Transportation (FAST) Act of 2015 consolidated many FTA
programs including former Transportation Equity Act for the 21st Century (TEA-21) Section

California Statewide Rural Intercity Bus Study Update                                          10
3038 (Over-the-Road Bus Program), as well as U.S. Code Title 49 Sections 5309 (Bus and Bus
Facilities Program), 5317 (New Freedom Program), and 5316 (Job Access and Reverse
Commute). As part of the general restructuring these policies facilitated, they also allowed
intercity bus services to begin carry packages along their routes as long as providing that service
is incidental to the main purpose of passenger transportation.

Another change affecting intercity transportation is Congestion Mitigation and Air Quality
(CMAQ) limits for operational assistance increasing from three years to five years, with a focus
changing to flexibility in the timing of assistance. The same amount of assistance can now be
spread over five years and be awarded in any amount for each of the five years (so long as the
total amount awarded remains below the maximum). Below are a number of examples of
allocations through CMAQ.

Table 2: Example Allocations of CMAQ Funds for Operating Assistance
 Example           Year 1             Year 2            Year 3        Year 4   Year 5   Total
 A                 $300               $300              $200          $50      $50      $900
 B                 $300               $300              $100          $100     $100     $900
 C                 $100               $400              $200          $100     $100     $900

However, the requirement of CMAQ recipients being in air quality non-attainment areas has
not changed. While this limits the applicability of the program for most rural areas, it might be
relevant to some rural areas that are not in air quality attainment zones. The other major
federal regulatory framework regarding intercity bus transportation, the Federal Motor Carrier
Safety Administration (FMCSA), has not significantly changed since the 2008 Study.

2.2 State Policies and Plans
California’s priorities regarding intercity transportation have changed more significantly than
their Federal counterparts. These shifts are not only the result of legislation and policy
decisions, but also a result of changing opinions on what an ideal transportation system in
California looks like. Since the 2008 California Statewide Rural Bus Study, there have been
myriad pieces of legislation and executive action taken to combat vehicle emissions, and the
way transportation is approached in California.

In terms of emissions, the first significant piece of legislation since the last study was SB 375
(Steinberg) in 2008, which required all Metropolitan Planning Organizations (MPOs) and
Regional Transportation Planning Agencies (RTPAs) to include a sustainable communities
strategy (SCS) in their Regional Transportation Plan (RTPs), and supported incentives to local
governments to implement the SCS in the pursuit of reducing greenhouse gas (GHG) emissions.
However, California’s 26 rural RTPAs are not required to submit an SCS with their RTPs.

California Statewide Rural Intercity Bus Study Update                                             11
Other policy actions specifically targeting GHG emissions included:

•        Executive Order B-16-12 (2012) – Reaffirms GHG reductions in transportation by 20% of
         the 1990 level by 2050.
•        SB 743 (Steinberg) – Revised California Environmental Quality Act (CEQA) to establish
         criteria for determining the impacts of transportation projects within transit priority
         areas and emphasized GHG emissions reductions, multimodal transportation networks,
         and diverse land use.
•        Executive Order B-30-15 (2015) – Sets GHG reduction levels to 40% below 1990 levels by
         2030.
In addition to these policy actions specifically targeting GHG emissions, there are other pieces
of legislation that alter the way intercity bus operations are conducted in California. These
include SB 391 (Liu) in 2009 which requires the California Transportation Plan (CTP) to be
updated every 5 years and encourages Caltrans to consider new technologies, expand public
transit and commuter and intercity rail, as well as active forms of transportation. Related to this
is SB 99 (Leno) 2013, and AB 101 (Skinner) 2013 which created the Active Transportation
Program. The Active Transportation Program consolidates existing federal and state
transportation programs including the Transportation Alternative Program, the Bicycle
Transportation Account, and the Safe Routes to School programs into a single program focusing
on active transportation. The purpose of this program is to increase the proportion of trips
accomplished by biking and walking instead of by vehicle, with the end goal being increased
health of the population as well as a reduction in GHG emissions.

The flagship program in California to implement these climate and transportation priorities is
the cap-and-trade system established by AB 32 (Nunez) in 2006 and started in 2012. The long-
term goal of this program being to reduce GHG emissions in California by 80% below the 1990
level by 2050. Many transportation funding programs that receive money from the cap-and-
trade system have a requirement that the transportation service benefit what CalEPA defines as
a “disadvantaged community”. CalEPA developed this definition, which includes a large
environmental component, in response to SB 535 (De Leon) in 2012. Unfortunately, this
definition precludes most rural areas from receiving this funding as environmental factors in
these areas are too diffused to qualify. As a result, the rural regional intercity bus system is
faced with an increasingly difficult statewide environment for transportation funding.

Another major change in the regulatory environment in California is a change in the approach
to transportation planning from a project-based approach, to a more holistic planning
approach. In this new approach, projects are not looked at on an individual basis but are looked
at through the lens of the entire system. This can be seen in the CTP 2040 focus on

California Statewide Rural Intercity Bus Study Update                                           12
repairing/preserving existing infrastructure instead of adding new, perhaps unsustainable, routes and infrastructure to the system, as well as the emphasis on stakeholder engagement. This new holistic approach should allow rural transit agencies to more directly engage in transportation policy and planning. The six-long range modal plans united under the CTP 2040 consist of: ● Statewide Transit Strategic Plan (STSP 2018)* ● Freight Mobility Plan (FMP 2014) ● State Rail Plan (SRP 2018) ● Aviation Plan (AP 2011) ● State Bicycle and Pedestrian Plan (SBPP 2017) ● Interregional Transportation Strategic Plan (ITSP 2015) (*the draft STSP has not been released but is planned for the spring of 2018) Among these plans, three with the most relevance to the rural regional intercity bus system are the 2015 ITSP, the 2018 SRP and the 2018 STSP. The draft STSP is at this point still forthcoming, but the background baseline report includes a subsection on Intercity Bus Service in California. The broader intercity transit system is also expected to be a focus of the STSP. The Draft 2018 SRP contains several initiatives of direct relevance to the rural regional intercity bus system. In addition to complementarities between the state-supported intercity rail services that operate the Amtrak Thruway bus service, there are other overlaps between these transit modes’ networks. The most significant among these are the SRP’s envisioned integrated passenger rail network, which is a plan to develop an integrated multi-modal transit system that enhances operating efficiencies across California as well as connecting with neighboring states and Mexico. The 2015 ITSP provides an important organizing framework for interregional travel across California. The 11 Strategic Interregional Corridors identified in the ITSP are recommended for prioritized improvements. As the organizing interregional framework, all analyses of the interregional transportation system must consider the vision and objectives of the ITSP and their linkage to the 2040 CTP (2015 ITSP, p.23). As such, the present analysis adopts the 11 strategic interregional corridors identified in the ITSP as primary units for analysis of the statewide rural regional intercity bus system in its review of the system and the market needs that it serves. California Statewide Rural Intercity Bus Study Update 13
2.3 Local Policies and Plans
At a local level, many of the most significant issues as well as the policies and plans to address
them, have persisted since the 2008 Study. However, this study undertook a statewide review
of RTPs, Coordinated Plans, and Short-Range Transit Plans to identify key issues related to the
rural region intercity transit system. While the list of issues identified through this iterative
study of local planning documents is not comprehensive, the recurrence of these issues served
as a vetting and validating process.

Non-Emergency Medical Transportation (NEMT)
The need for transportation to medical appointments was a common need for transit
dependent people and those who cannot drive after a medical appointment or procedure (e.g.
after getting dialysis or other medical procedure). Many residents in rural communities have to
go out of town and/or county for medical services.

Using services
Specialized Assistance: Some members of the transit dependent population require a high level
of “hands on” assistance during their trips (e.g. clients with dementia or those in wheelchairs).

First/last mile + Transferring between different systems: Incompatibilities also come in the form
of transferring between different transportation providers. Some riders can be confused by
different transit systems. It can also be difficult when clients must pay different fares to
different systems and need to figure out timings, bus stop locations, etc. to transfer. For some
riders, it may be challenging to navigate a new city/town.

Service Affordability
Consumer resource constraints: Multiple counties reported that fares can be unaffordable for
some people and travel.

Knowledge and Confidence Gap
Limited/lack of awareness of services/gaps in knowledge act as a barrier to mobility and cause
unnecessary perceptions of unmet needs. When it comes to intercity travel, some residents
may need to use multiple transportation services and navigate new communities which can
pose multiple challenges, including feeling intimidated by transit services and thus not using
them. Other considerations include thinking of those with developmental disabilities, seniors
who recently can no longer drive, or those with limited English or literacy.

Service Limitations
The hours and days of operations and service area limits mobility for riders. A number of transit
services operate during business hours, limiting access outside of business hours and days for
evening classes, shopping recreation, social services, and jobs. Roundtrips may also not be

California Statewide Rural Intercity Bus Study Update                                           14
possible due to the length of the journey because of long wait times. If a rider has to use
multiple transportation services to reach their destination, the timings may not work for
seamless connections, making a roundtrip within one day impossible at times.

Transit Accessibility
Difficulty accessing transit services is a challenge for many people. Factors contributing to poor
transit access include the distance of residents’ homes from bus routes, hilly terrain, and road
quality. Limited pedestrian infrastructure was identified as a mobility barrier and potential
safety issues were also identified. Additionally, not all local transit vehicles are equipped with
wheelchair lifts or low floors making connections to intercity services a challenge. In addition to
these issues, fragile health status also makes accessibility a challenge.

Infrastructure
Many riders are a pedestrian for some portion of their trip. Limited continuous pedestrian
sidewalks in a number of communities was identified as a challenge. Sidewalks that are not
contiguous can inhibit transit access, particularly for people using mobility devices. Some
reports brought up the need and desire for new and/or improved signage and benches/shelters
which can bring attention to services as well as make the journey relatively more comfortable
and appealing for riders.

2.4 Methodology
This analysis began with a focused review of planning and the network of intercity bus services
in California. The resulting policy context and inventory of the network were then refined and
further developed in consultation with the project’s steering committee and staff from the
DRMT. Key issues identified through this initial phase were then focused upon through a series
of outreach events, which included the Spring 2017 California Association for Coordinated
Transportation (CalACT) conference, online surveys, and interviews with bus service providers
as well as a variety of transit agencies.

Options to address the challenges and maximize the opportunities facing the rural regional
intercity bus were then vetted through a combination of additional online surveys, a
presentation and discussion at the Fall 2017 CalACT conference, and series of statewide on-site
interviews and stakeholder meetings with transit agencies and providers. 2 This process resulted
in development of the key issues and recommendations for this study.

2
    See Appendix A for details of the project’s outreach and stakeholder engagement.

California Statewide Rural Intercity Bus Study Update                                           15
Chapter 3 - Inventory of Intercity Service
This part of the Statewide analysis inventories existing intercity bus services and changes in
service since the 2008 Study. A list of public intercity transit providers who received 5311(f)
funding in FY2018 is reported in Table 3 below. That is followed in Table 4 by a list of private
for-profit intercity bus operators as well as a selection of other intercity transit providers. In
both cases these operators’ intercity routes are identified across 18 interregional corridors.
Those interregional corridors are illustrated in Figure 1 and described in detail in Appendix B.
As mentioned in Chapter 2, the first eleven corridors, Corridor 1 to 11, correspond to the
eleven strategic corridors identified in the 2015 ITSP. However, California’s rural regional
intercity network is not limited to those corridors alone. Therefore, seven additional corridors,
Corridors 12 to 18, define distinct rural areas that form inclusive coverage across the entirety of
California.
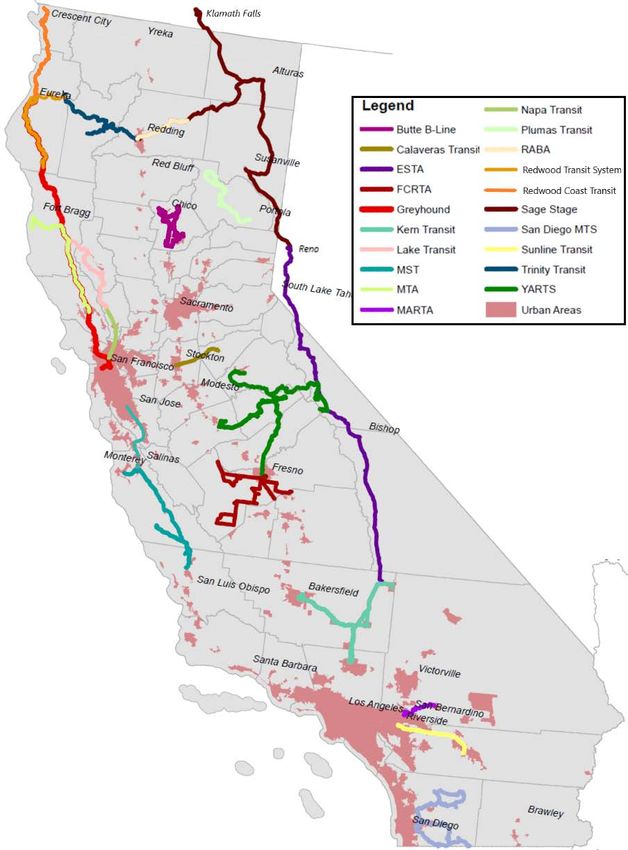
Table 3 5311(f) Funded Intercity Transportation Providers in FY2018
Service/Corridor
10
11
12
13
14
15
16
17
18
1
2
3
4
5
6
7
8
9
Butte B-Line* X X
Calaveras Transit* X X
ESTA X X X X
FCRTA* X X X
Greyhound* X
Kern Transit X X X X
Lake Transit X X X
MST X
MTA* X
MARTA* X
Napa Transit X X X
Plumas Transit* X
RABA* X X X
Redwood Coast Transit X X
Redwood Transit System X X
Sage Stage X X X
San Diego MTS* X X
Sunline Transit* X X
Trinity Transit* X X X
YARTS X X X
Reduced since '08 CIBS
Expanded since '08 CIBS
New since '08 CIBS
Ended since '08 CIBS
California Statewide Rural Intercity Bus Study Update 16In order to capture changes in intercity service since the 2008 Study, Table 3 and Table 4 have
been color coded to reflect changes in the routes, with distinct colors representing the addition
and suspension of routes in particular corridors as well as the expansion or contraction of
service within routes. New services since 2008 Study are identified in Table 3 with an asterisk
(*). As an example, Trinity Transit operated service between Willow Creek and Weaverville
along interregional corridor 3, the North Coast-Northern Nevada Corridor, when the 2008 Study
was conducted, but it did not connect with Redding or receive 5311(f) funding. Trinity Transit
now offers regular intercity service between Willow Creek and Redding with 5311(f) support.
Therefore, Trinity Transit is identified by an asterisk and an orange filled box with a check under
interregional corridor 3 as well as a green filled box with a check under interregional corridor 4,
which is the Sacramento – Oregon Corridor since that corridor is now linked with its Trinity
Transit’s connection to Redding.
Table 4 Private for-profit intercity operators and select other intercity bus service providers
Service/Corridor
10
11
12
13
14
15
16
17
18
1
2
3
4
5
6
7
8
9
Airport Valet Express* X
Amador Transit* X X X X
Amador Stage Lines* X
America Asia Express* X
Amtrak Thruway X X X X X X X X X X X
Antelope Express* X X X
Bolt Bus* X X
Breeze Bus* X
CHD-Group Bus* X X X
Clean Air Express* X X
Greyhound X X X X X X X X
Hoang Express Bus* X X X
KT NET* X
Lassen Tours* X
Lux Bus X
MegaBus X X X
Orange Belt Stages X X
Transportes
X X X
Intercalifornias
Ventura CTC* X
California Statewide Rural Intercity Bus Study Update 17As with the FY 2018 5311(f) recipient providers, Table 4 demarks new services since the 2008
Study with an asterisk. It is evident from these two tables that several additional intercity
routes have emerged since the 2008 Study. Nevertheless, several intercity services identified in
the 2008 Study no longer operate or receive 5311(f) funding. Among private providers there are
three companies who have stopped intercity operations in California: Americanos USA, CA
Shuttle Bus, and USASIA. Similarly, four public intercity transportation providers that received
5311(f) funding when the 2008 Study was conducted did not receive funds in FY 2018:
• Los Angeles County Department of Public Works, whose 5311(f)-funding supported
service between Acton and Santa Clarita.
• SamTrans, whose 5311(f)-funding supported service between Half-Moon Bay and San
Mateo.
• San Luis Obispo Regional Transit Authority, whose 5311(f)-funding supported service
between Santa Maria and San Luis Obispo.
• Yurok Tribal Government, whose 5311(f)-funding supported service between Pecwan
and Willow Creek.
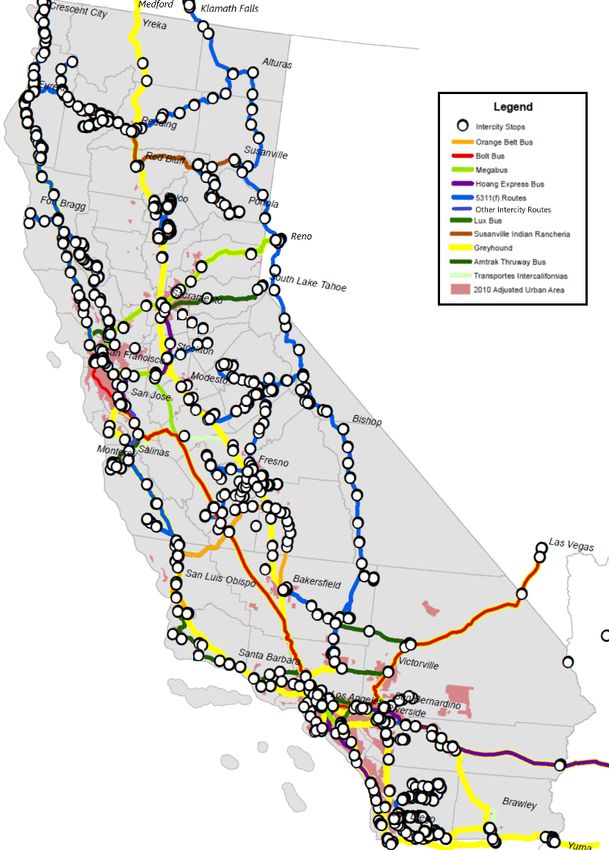
California Statewide Rural Intercity Bus Study Update 18Figure 1 Interregional Corridor Areas Drawing on the intercity routes listed in Table 4 and Table 3, key components of the statewide regional intercity network are illustrated in Figure 2 along with their associated stops. Further details of that network along with buffers representing 10 miles and 25 miles from the intercity stops are then illustrated in Figure 3 to Figure 5. California Statewide Rural Intercity Bus Study Update 19
Figure 2 Intercity Bus Service in California

California Statewide Rural Intercity Bus Study Update   20
Figure 3 Intercity Bus Services in Southern California

                                                 California Statewide Rural Intercity Bus Study Update   21
Figure 4 Intercity Bus Services in Central California
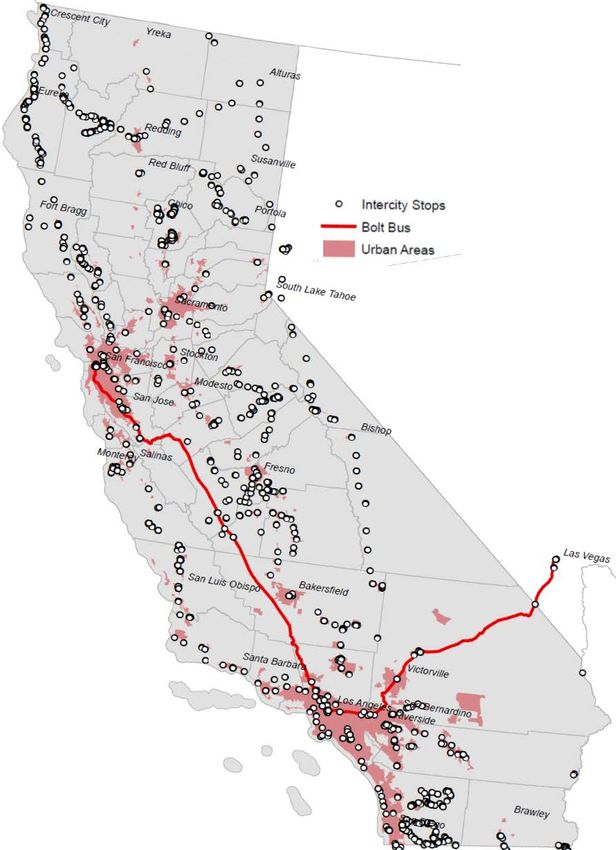
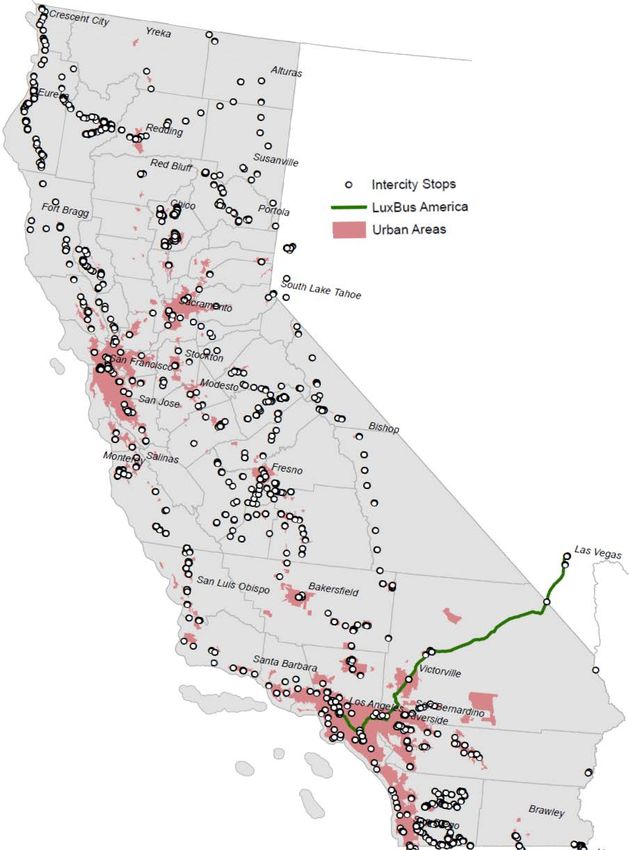
California Statewide Rural Intercity Bus Study Update 22Figure 5 Intercity Bus Services in Northern California Details of the for-profit operators’ routes are provided in Figure 6 to Figure 13. The routes supported with 5311(f) in FY2018 are then illustrated in Figure 14. California Statewide Rural Intercity Bus Study Update 23
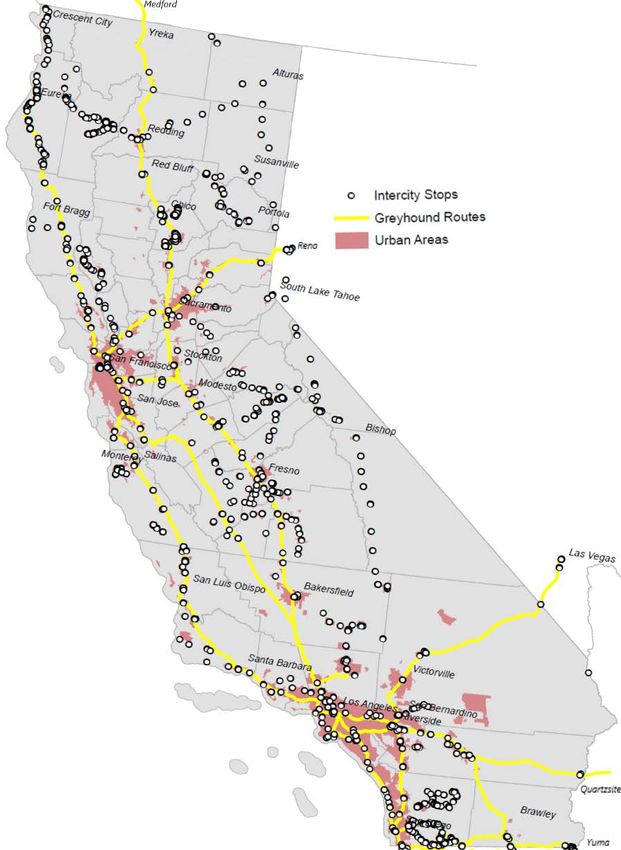
Figure 6 Intercity Bus Services in California – Amtrak Thruway Bus

    Note: Except for service between Sacramento and South Lake
    Tahoe use of an Amtrak Thruway Bus requires passengers to
    purchase a ticket that includes an Amtrak rail service leg.

California Statewide Rural Intercity Bus Study Update                24
Figure 7 Intercity Bus Services in California – Bolt Bus California Statewide Rural Intercity Bus Study Update 25
Figure 8 Intercity Bus Services in California - Greyhound

California Statewide Rural Intercity Bus Study Update       26
Figure 9 Intercity Bus Services in California – Hoang Express Buss

California Statewide Rural Intercity Bus Study Update                27
Figure 10 Intercity Bus Services in California – LuxBus

California Statewide Rural Intercity Bus Study Update     28
Figure 11 Intercity Bus Services in California – Megabus

   Note: In January of 2018 Megabus suspended
   its service between Sacramento and Reno.

California Statewide Rural Intercity Bus Study Update      29
Figure 12 Intercity Bus Services in California – Orange Belt Line

California Statewide Rural Intercity Bus Study Update               30
Figure 13 Intercity Bus Services in California – Transportes Intercalifornias

California Statewide Rural Intercity Bus Study Update                           31
Figure 14 Intercity Bus Services in California – FY 2018 5311(f) Funded Routes

California Statewide Rural Intercity Bus Study Update                            32
Chapter 4 - Assessment of Intercity and Rural Regional Bus Service

In this chapter we assess existing and anticipated demand for rural regional intercity bus service
in comparison to the network’s capacity. The base network of regional intercity bus service
developed in Chapter 3 is augmented with urban and regional transit feeder services to identify
the overall network of regional intercity transit service available statewide. Three
complementary approaches are then applied to assess the adequacy of that network in
comparison to rural needs statewide. First, we create a relative measure of rural transit
dependence population needs. Second, we identify six categories of key regional destinations
and their location statewide. Finally, population and policy dynamics are considered. Policy
dynamics are considered with a focus on rural population needs across the State’s inter-
regional corridors as well as growing demand for resources in California’s State and National
Parks. The system’s role in emergency and disaster response is then discussed. Lastly,
population dynamics are reviewed using a comparison of two statewide county-level forecasts
to identify where gaps in the rural regional intercity system are likely to emerge.

4.1 Rural Transit Dependent Population Needs
Certain members of the State’s population are more likely to use or need to use regional
intercity bus services than others. These “transit dependent populations” are less likely than
the rest of the population to have other transportation options for their mobility beside transit.
In defining the transit dependent population, we follow the methodology of the 2008 Study and
use five variables: 1) the population 18-24 years of age, 2) the population 65 years of age and
older, 3) the population of individuals with a disability, 4) the population of individuals in
poverty, and 5) the population of households with no vehicle. However, we update the analysis
using US Census Bureau 5-year data on the period from 2011 to 2015, 3 to identify these
populations for each of California’s 23,200 Census block groups. 4 Each area’s transit dependent
populations are then placed in relative terms by dividing the block group’s total population by
the component transit dependent populations of seniors, young adults, disabled, poor, and
vehicle-less. This relative population value of rural needs represents the intensity of transit
dependent population needs rather than the total counts to geographic density used in the
2008 Study which are inherently biased to urban areas with larger total populations. 5

3
  Specifically, the source was 2011-2015 US Census Bureau’s American Community Survey (ACS) 5-year estimates.
4
  In the 2015 5-year data there were 23,205 block group areas in California, five of these block groups were defined
for island areas off the California coast and were therefore excluded from our analysis.
5
  This bias arises because block groups are population based so block groups in urban areas will be geographically
smaller than those in rural areas. Inherently then the density of transit dependent population needs will be lower
in rural areas than urban.

California Statewide Rural Intercity Bus Study Update                                                            33
With relative measures for each variable, each block group is then sorted by intensity and
ranked. The sum of the five variables, with larger sums corresponding to greater transit
dependent population needs, is then used to provide each of the 23,200 block groups a ranking
for the significance of their transit dependent populations. That overall summary ranking is
then used to identify three tiers of transit needs by populations: low, moderate, and high. The
top third of block groups are classified as “high needs”. The middle third of block groups are
classified as “moderate needs” and the last third of block groups are classified as “low needs”.
Using the 2010 Caltrans adjusted urban areas as our base, the high, moderate, and low block
groups are illustrated in Figure 15 to Figure 17.

This statewide ranking of its areas’ transit dependent population needs is then analyzed with
respect to those areas’ access to the regional intercity bus network. This assessment was done
by comparing the geographic center of the block group, its centroid, to the nearest intercity or
feeder service bus stop. To represent the rural block groups with higher relative transit
dependent population needs and limited access to the network, we identified those block
groups 10 to 25 miles from the nearest bus stop and those over 25 miles from the nearest stop
in Figure 18 to Figure 20.

In order to link these needs to planning and organizing structures we also analyzed the block
groups within each of California’s 58 counties in a similar fashion. The results of that analysis
are reported in Table 5. That table highlights the counties with the great proportion of high
needs block groups and shows that in 7 of the 58 counties high needs block groups composed
over 70% of all block groups in the county. 6 In comparison, only 5 of the 58 counties had low
needs block groups composing over 50% of the area in the county.

While understanding the geography of transit dependent populations and their proximity to the
regional intercity bus network is important it is merely suggestive of actual adequacy of the
network. This type of high level statewide analysis implies that being less than 10 miles from a
bus stop makes access to that service feasible in some way. Clearly, reasonable access even in
rural areas is likely less than a mile let alone 10 miles. Furthermore, even if there is a bus stop
nearby its presence alone does not guarantee meaningful access. In rural areas especially, the
large distances covered by the system often means that available service may be infrequent
(perhaps less than weekly) and may not correspond to times of the day when the service is
needed. Nonetheless, understanding the structure of the state’s intercity network in
comparison to a measure of its needs provides a useful starting point to understanding the
overall strengths and weakness of the system.

6
    Those 7 counties are: Alpine, Del Norte, Glenn, Lake, Modoc, Plumas and Siskiyou.

California Statewide Rural Intercity Bus Study Update                                           34
Figure 15 Relative Density of Transit Dependent Populations in Southern California
California Statewide Rural Intercity Bus Study Update 35Figure 16 Relative Density of Transit Dependent Populations in Central California
California Statewide Rural Intercity Bus Study Update 36Figure 17 Relative Density of Transit Dependent Populations in Northern California California Statewide Rural Intercity Bus Study Update 37
Figure 18 Transit Dependent Populations and Intercity Services in Southern California

                                                California Statewide Rural Intercity Bus Study Update   38
Figure 19 Transit Dependent Populations and Intercity Services in Central California
California Statewide Rural Intercity Bus Study Update 39Figure 20 Transit Dependent Populations in Northern California California Statewide Rural Intercity Bus Study Update 40
Table 5 Statewide Inferred Population Transit Needs
                                       Low          Moderate   High   # High Needs   Total B.G.
 Alameda County                        42%              30%    28%        295          1,047
 Alpine County                         0%               0%     100%        2             2
 Amador County                         7%               43%    50%        14            28
 Butte County                          12%              24%    64%        125           195
 Calaveras County                      10%              37%    53%        16            30
 Colusa County                         20%              30%    50%        10            20
 Contra Costa County                   43%              31%    26%        164           637
 Del Norte County                      10%              15%    75%        15            20
 El Dorado County                      30%              40%    30%        38            125
 Fresno County                         18%              28%    54%        317           589
 Glenn County                           0%              30%    70%        16             23
 Humboldt County                       10%              31%    59%        64            108
 Imperial County                       9%               28%    63%        60            96
 Inyo County                           25%              44%    31%         5            16
 Kern County                           24%              28%    48%        218           456
 Kings County                          26%              23%    51%        41            81
 Lake County                           4%               19%    77%        37            48
 Lassen County                         12%              44%    44%        11            25
 Los Angeles County                    29%              35%    36%       2315          6,419
 Madera County                          9%              33%    59%        47             80
 Marin County                          50%              37%    13%        22            175
 Mariposa County                       18%              35%    47%         8            17
 Mendocino County                      18%              25%    57%        45            79
 Merced County                         12%              26%    62%        89            144
 Modoc County                          8%               17%    75%         9            12
 Mono County                           71%              18%    12%         2            17
 Monterey County                       36%              40%    23%        54            233
 Napa County                           43%              38%    19%        20            106
 Nevada County                         31%              41%    28%        21            75
 Orange County                         48%              34%    18%        321          1,823
 Placer County                         42%              38%    20%        43            213
 Plumas County                         9%               18%    73%        16            22
 Riverside County                      32%              34%    33%        342          1,030
 Sacramento County                     26%              32%    43%        388           912
 San Benito County                     50%              35%    15%         6             40
 San Bernardino County                 29%              34%    37%        408          1,092
 San Diego County                      37%              35%    28%        506          1,795
 San Francisco County                  29%              36%    36%        207           580
 San Joaquin County                    19%              32%    49%        195           395
 San Luis Obispo County                26%              39%    34%        56            163
 San Mateo County                      60%              30%    10%        47            463
 Santa Barbara County                  34%              35%    31%        95            311
 Santa Clara County                    64%              25%    11%        121          1,075
 Santa Cruz County                     34%              39%    27%         53           196
 Shasta County                         8%               33%    60%        78            131
 Sierra County                         40%              20%    40%         2             5
 Siskiyou County                       0%               22%    78%        29            37
 Solano County                         37%              34%    29%        82            285
 Sonoma County                         36%              37%    26%        102           387
 Stanislaus County                     18%              29%    54%        166           308
 Sutter County                         16%              34%    50%        31            62
 Tehama County                         12%              28%    60%        26            43
 Trinity County                        15%              31%    54%         7            13
 Tulare County                         14%              37%    49%        133           270
 Tuolumne County                       17%              33%    50%        24            48
 Ventura County                        40%              39%    21%        91            427
 Yolo County                           23%              38%    39%        48            122
 Yuba County                           12%              24%    63%        31            49
 State-wide                            33%              33%    33%       7,734        23,200

California Statewide Rural Intercity Bus Study Update                                             41
4.2 Rural Regional Service Needs
The 2017 NCHRP Study on rural regional mobility identified several types of rural regional trips.
In this assessment we examine the statewide need for rural regional intercity transit that
originates from six types of trips:
1) Airports
2) Colleges/Universities
3) Correctional facilities
4) Hospitals and major medical facilities
5) Major military bases
6) Tribal home lands
In order to identify where gaps in regional intercity bus service for these trips potentially exists,
we systematic examine locations for facilities across each trip type and compare those locations
to bus stops in the statewide regional intercity system. In a manner similar to the assessment of
transit dependent populations in Section 4.1, we use buffers from the stops in 10-25 mile and
over 25-mile increments to identify facilities in each trip category that are not near the
statewide network. the distance of each block group to the nearest intercity bus stop. Using 10-
mile and 25-mile buffers, we thereby identify facilities with potential intercity bus service
needs.
Airports
Using data from the Federal Aviation Administration (FAA), some 26 primary commercial
service airports across California were identified based on 2013 data.7 Of those, none were
found to be more than 10 miles from the regional intercity network when transit feeder
services were included in our analysis. However, without local feeder services there was one
airport more than 10 miles from a network bus stop.
Colleges/Universities
Using data from the National Center for Education Statistics (NCES) global locator, some 477
colleges and universities across California were identified based on 2016 data. Of those, none
were found to be more than 10 miles from the regional intercity network when transit feeder
services were included in our analysis. However, when we assessed the connectivity without
local feeder services there were 19 institutions more than 10 miles from a bus stop in the
network and one which was more than 25 miles from a network bus stop.
7
The FAA defines a primary commercial service airport as those with more than 10,000 annual enplanements.
California Statewide Rural Intercity Bus Study Update 42Correctional Facilities Using 2017 data on secure detention facilities from the US Department of Homeland Security, 66 correctional facilities across California were identified. Of these, four were shown to be more than 10 miles from a network bus stop and one of those is more than 25. These facilities are reported in Table 6 as well as Figure 21 and Figure 22. When local feeder services are excluded, some seven correction facilities are more than 10 miles from a regional intercity bus stop and two of those are more than 25 miles. Table 6 Correctional facilities over ten miles from a regional intercity bus network stop Facility Name City Type Population Distance CALIPATRIA STATE PRISON (CAL) CALIPATRIA STATE 3,897 > 25 Miles CENTINELA STATE PRISON (CEN) IMPERIAL STATE 3,230 10-25 Miles CHUCKAWALLA VALLEY STATE PRISON (CVSP) BLYTHE STATE 1,888 10-25 Miles IRONWOOD STATE PRISON (ISP) BLYTHE STATE 3,580 10-25 Miles Hospitals Using 2017 data on licensed facilities from the California Health and Human Services Open Data Portal, 517 hospitals and major medical facilities across California were identified. Of these, eight were found to be more than 10 miles from a bus stop in the network when feeder services are included, but none were more than 25 miles. These hospitals are reported in Table 7 as well as Figure 23. When local feeder services are excluded there are 34 hospitals more than 10 miles from a regional intercity stop and three of those are more than 25 miles. Table 7 Hospitals over ten miles from a regional intercity bus network stop Hospital Facility Name City Total Beds Distance COLUSA REGIONAL MEDICAL CENTER COLUSA 48 10-25 Miles GLENN MEDICAL CENTER WILLOWS 47 10-25 Miles HAZEL HAWKINS MEMORIAL HOSPITAL HOLLISTER 119 10-25 Miles KAISER HOSPITAL - VACAVILLE VACAVILLE 140 10-25 Miles OJAI VALLEY COMMUNITY HOSPITAL OJAI 25 10-25 Miles PIONEERS MEMORIAL HEALTHCARE DISTRICT BRAWLEY 107 10-25 Miles SIERRA NEVADA MEMORIAL HOSPITAL GRASS VALLEY 104 10-25 Miles SURPRISE VALLEY COMMUNITY HOSPITAL CEDARVILLE 26 10-25 Miles California Statewide Rural Intercity Bus Study Update 43
Figure 21 Correctional Facilities over 10 Miles from a Regional Intercity Network Bus Stop

California Statewide Rural Intercity Bus Study Update                                        44
Figure 22 Correctional Facilities over 25 Miles from a Regional Intercity Network Bus Stop

California Statewide Rural Intercity Bus Study Update                                        45
You can also read