Santa Cruz County 2021 State of the Workforce - SANTA CRUZ COUNTY WORKFORCE DEVELOPMENT BOARD
←
→
Page content transcription
If your browser does not render page correctly, please read the page content below
SANTA CRUZ COUNTY WORKFORCE DEVELOPMENT BOARD

Santa Cruz County 2021
State of the Workforce
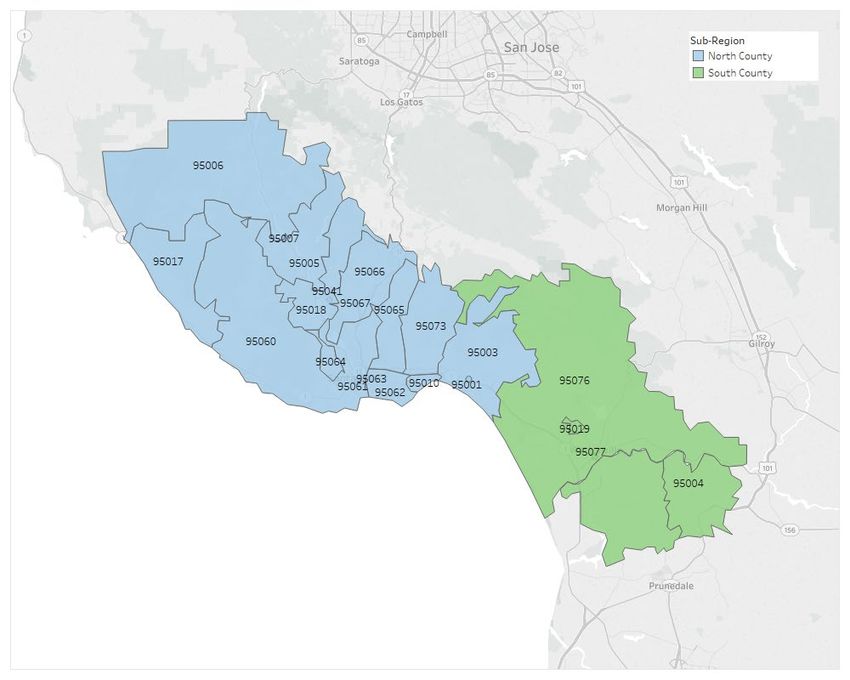
Table of Contents
Executive Summary .......................................................................................................................................................................... 3
         Introduction ............................................................................................................................................................................ 3
         Key Findings ............................................................................................................................................................................ 3
         Recommendations .................................................................................................................................................................. 5
Santa Cruz County ............................................................................................................................................................................. 7
COVID-19 Pandemic Impacts ............................................................................................................................................................ 8
    Employment Impacts ................................................................................................................................................................... 8
         Industry-Specific Employment Changes ................................................................................................................................ 10
         Online Job Postings ............................................................................................................................................................... 12
    Consumer Spending ................................................................................................................................................................... 14
    Impacts on Small Businesses ...................................................................................................................................................... 15
    Socially-Distant Occupations ...................................................................................................................................................... 18
Regional Economic Profile .............................................................................................................................................................. 19
    Industry Clusters ........................................................................................................................................................................ 19
    Job Quality ................................................................................................................................................................................. 22
    Job Volatility............................................................................................................................................................................... 24
    Regional Jobs and Workforce..................................................................................................................................................... 26
Regional Demographic Profile ........................................................................................................................................................ 28
    Race and Ethnicity ...................................................................................................................................................................... 28
    Age Profile .................................................................................................................................................................................. 29
    Educational Attainment ............................................................................................................................................................. 31
    Housing Characteristics .............................................................................................................................................................. 33
    Commuting Patterns .................................................................................................................................................................. 35
Career Pathways and Opportunities ............................................................................................................................................... 36
         Finance, Banking, Insurance, and Real Estate ....................................................................................................................... 37
         Healthcare ............................................................................................................................................................................. 38
         Building & Design .................................................................................................................................................................. 39
         Professional and Business Services ....................................................................................................................................... 40
    Growth Industries and Pathways ............................................................................................................................................... 41
         Information and Communications Technology ..................................................................................................................... 41
         Defense, Aerospace, and Transportation Manufacturing ..................................................................................................... 42
    Occupational Gap Analysis ......................................................................................................................................................... 43
    At-Risk Workers and Transition Opportunities .......................................................................................................................... 44
    IT Occupations Outside of Tech ................................................................................................................................................. 46
Appendix A: Research Methodology............................................................................................................................................... 49
Appendix B: Definitions .................................................................................................................................................................. 50

                                                                                                                                                                                                  2
Acknowledgments
BW Research and the Santa Cruz County Workforce Development Board would like to thank the local
business owners, various stakeholders, and association groups for their input and feedback that was
instrumental in the crafting of this report. In particular, the authors of this report would like to thank
Beverley Lindberg, June Ponce, Dr. Larry DeGhetaldi, and Darren Pound for sharing their experiences
through the COVID-19 pandemic.
Executive Summary
INTRODUCTION
The Santa Cruz County Workforce Development Board engaged BW Research Partnership to assess the
State of the Workforce in 2020. This research comes at a crucial time as Santa Cruz County (the County)
looks to rebuild and recover from the COVID-19 pandemic. This State of the Workforce report provides a
range of data on the current state of the economy in the era of COVID-19, as well as the underlying
economy and workforce that preceded COVID-19 and its connection to the County’s recovery.
This research was produced using data from a range of public and proprietary data sources. Several
datasets used in this report were produced specifically for tracking the impacts and outcomes of the
pandemic. The analyses and discussion around secondary data were contextualized by executive
interviews with representatives from the business and workforce community of Santa Cruz County.
KEY FINDINGS
1. While early data suggests that the recovery is already underway, the reorganization of the
labor market due to the pandemic may present challenges to an expedient rebound. The
pandemic substantially reshuffled the labor market as some parents left the labor force to care
for their children, some furloughed workers left the County to live with parents, and other
workers reconsidered their careers altogether. This disruption, paired with bolstered
unemployment benefits and continued health concerns, have quickly transitioned the local
labor market from a surplus of workers during much of the pandemic to one with a shortage of
workers willing and able to return. Incentivizing a safe return to work will play an important
factor in the speed of County’s recovery.
2. The rise of remote work presents a challenge and an opportunity for Santa Cruz County. For
some industries, the possibility of a remote team can alleviate employers’ difficulties finding
local talent. The expansion of remote work and the County’s renowned quality of life also make
the region an attractive option for remote workers, and given the County’s close proximity to
Silicon Valley, Santa Cruz County could serve as a remote-work hub for tech workers who would
still be able to make an occasion trip to headquarters. Alternatively, a new pool of remote
workers moving into the County may further escalate already high housing costs, making the
County less affordable for other workers, particularly those in lower paying industries.
3. Some of the County’s most vulnerable workers have been hit hardest by the pandemic.
Tourism, Recreation, and Hospitality—the industry cluster with the lowest average earnings—
3saw the greatest decline (58%) in employment between February 2020 and February 2021. This
figure is even more alarming when considering that Tourism, Recreation, and Hospitality
accounted for 14% of the 2019 workforce in Santa Cruz County. As businesses re-open and
employers in this sector look to onboard more staff, the shift in the underlying labor market
may mean that employers may have to look for talent outside of their traditional channels. See
page 9 for the different employment impacts from the pandemic by working income.
4. Many businesses in the County have also been hit particularly hard. Business 1 revenue in Santa
Cruz County was 37% lower in late January 2021 than in January 2020. The smallest businesses
are particularly susceptible to losses of income, as they often have less cash on hand and
emergency reserves than larger businesses. These figures are also notable because 96% of
business establishments in Santa Cruz County have 49 or fewer employees. 2 Assisting these
businesses will be essential to any recovery effort. But recovery efforts should not be uniform;
industries with diverse segments--such as Retail and Professional & Business Services--saw harsh
declines in some areas and growth in others. For example, boutique in-person clothing stores
have seen severe losses, while retailers like home improvement and hardware stores have seen
a boom in demand. Tailoring recovery efforts to specific industries will ensure that efforts and
resources are used where they are needed most. See pages 15 and 16 for a more detailed
assessment of the impact of the pandemic on Santa Cruz County’s small business ecosystem.
5. Before the pandemic, Santa Cruz County had seen areas of growth and advancement such as
low unemployment, improvements in overall job quality, and growth in higher paying industry
clusters. Before March 2020, the Santa Cruz County economy exhibited several positive
economic indicators and trends. Unemployment was low, job quality had been improving, and
several industry clusters with high average earnings had grown considerably. While we have not
been able to quantify the full extent of the economic impact of COVID-19 on Santa Cruz County,
it is safe to say that issues like lowered labor participation and a decline in total jobs from the
pandemic has hurt the County’s economic landscape and particularly lowered economic
opportunities, especially for lower-income residents.
6. There are several key industry clusters that showed strong growth going into the pandemic
and resiliency through the pandemic. Clusters like Finance, Banking, Insurance, & Real Estate
(FIRE), Building & Design, Healthcare, and Professional & Business Services offer a range of
robust career pathways and opportunities for the local workforce already living in Santa Cruz
County. There are also some industry clusters in Santa Cruz County that are nascent but present
opportunities for expansion, including Information and Communication Technology (ICT) and
Defense, Aerospace, and Transportation Manufacturing (DATM). This report offers a number of
career pathways in each of these industry clusters starting on page 36.
1
This analysis uses the SBA definition of a small business and varies by industry. Generally speaking, these are
firms with less than 1,200 employees or less than $45 million in annual revenue, which account for a majority of
firms in Santa Cruz County. For more information about this definition, please visit
https://www.sba.gov/document/support--table-size-standards
2
2018 County Business Patterns. U.S. Census Bureau.
47. Some of the losses in Tourism, Hospitality, and Recreation may be the last jobs to return, if
they fully return to their pre-pandemic levels at all. Table 9 offers a list of some of these most-
at-risk occupations and some transition opportunities based on shared knowledge, skills, and
abilities. Additionally, the occupational gap analysis on page 43 highlights several occupations
with living wages and demand that exceeds the current supply. While transitioning all Tourism,
Hospitality, and Recreation workers currently displaced is likely neither prudent nor necessary, it
is important to offer viable career transition opportunities to those who seek them.
8. While the tech industry in Santa Cruz County is relatively small, there is substantial
opportunity for IT workers in industries outside of technology. More than two-thirds (71%) of
IT workers in Santa Cruz County work in non-technology industries. The largest non-technology
employers of IT professionals include Professional Scientific and Technical Services; State
Government; Management of Companies and Enterprises; Local Government; and
Administrative and Support Services. There are 1,800 IT jobs within non-technology industries in
Santa Cruz County, though these positions tend to have high education and skill requirements.
9. Santa Cruz County’s population and workforce are getting older, particularly in the North sub-
region. Seventeen percent of North sub-region residents are 65 or older, compared to 11% in
the South sub-region. However, both sub-regions have seen their populations get older over the
past five years. Between 2014 and 2019, the proportion of those 65 and older increased by 37%
in the North sub-region and 10% in the South sub-region. A population with a growing share of
older residents can dampen a region’s economy as employers may struggle to find local talent.
RECOMMENDATIONS
1. Consider options to help employees return to work. Between childcare demands exacerbated
by the pandemic, public health concerns, and supplemented unemployment insurance, a
substantial portion of the workforce has been unable or unwilling to return to work. Efforts that
work to alleviate each of these barriers—whether through subsidized childcare offerings, public
health measures, or the introduction of hiring bonuses—will help drive up labor force
participation and re-entry into the workforce. Some workers may also be hesitant to start a new
job given the fluid state of the labor market. Providing labor market information and discussion
may help quell any uneasiness about returning to a shifting labor market.
2. Coordinate with economic development partners, employers, and regional training and
education providers to expand existing industry clusters and foster those that are developing.
This report highlights several key industries (Finance, Banking, Insurance, and Real Estate (FIRE);
Healthcare; Building and Design; and Professional and Business Services) which offer in-demand,
career pathways with living wages. There is also opportunity to work with stakeholders to foster
the development of identified growth industry clusters (Information and Communication
Technology (ICT), and Defense, Aerospace, and Transportation Manufacturing (DATM)) to help
build these smaller growth industry clusters into more established clusters within Santa Cruz
County.
53. Work with local, large, non-technology employers in the County to help make sure their IT
needs are met. These employers, which include universities, state and local government
entities, and hospitals, employ approximately 1,800 IT workers across the County.
Communication with these employers--and supporting coordination with regional training and
education providers—can help improve the pipeline of local talent for these in-demand IT
occupations. For more information on how to support this type of effort, see page 46 of this
report.
4. Encourage stronger partnerships between K-12 and post-secondary educators and local
employers to bolster educational attainment, particularly in the South sub-region of the
County. Educational attainment varies substantially across racial, ethnic, and geographic lines.
Remedying these gaps is crucial to increasing equity and opportunity as well as supporting the
greater talent pipeline in the County. Working with both educators and employers may help
students better understand the education opportunities available to them and the importance
of education in achieving their career and financial goals.
5. Support workers that are looking to transition to a new career pathway. Over the past year,
the size and dynamics of the County’s labor market have shifted considerably. This disruption in
the labor market has resulted in a smaller labor force and longer durations of unemployment.
Many workers may also be looking to transition to industries outside those they have
experience in. Supporting these workers in inter-industry transitions will help expediate the
stabilizing of the labor market.
6Santa Cruz County
7COVID-19 Pandemic Impacts
To best showcase the dynamic economic circumstances over the course of the pandemic, this section
utilizes data from the California Employment Development Department and U.S. Department of the
Treasury, propriety models developed by BW Research, and proprietary data aggregated and prepared
by Opportunity Insights, a team of researchers at Harvard University. The Opportunity Insights data is
compiled from a range of private sources, which provide a near real-time picture of national and local
economies. 3
Employment Impacts
In April 2020, the unemployment rate in Santa Cruz County reached 17%. Though the unemployment
rate has since fallen dramatically, a substantial number of workers remain unemployed. In fact, the
unemployment rate in March 2021 is the same as it was one year earlier at the very beginning of the
pandemic (Figure 1).
Figure 1. Monthly Unemployment Rates in Santa Cruz County (2015 – March 2021), 4 Not Seasonally-Adjusted
18.0%
16.0%
14.0%
12.0%
10.0%
8.0%
8.1%
6.0%
4.0%
2.0%
0.0%
Jul-15
Jul-16
Jul-17
Jul-18
Jul-19
Jul-20
Apr-15
Apr-16
Apr-17
Apr-18
Apr-19
Apr-20
Jan-15
Jan-16
Jan-17
Jan-18
Jan-19
Jan-20
Jan-21
Oct-15
Oct-16
Oct-17
Oct-18
Oct-19
Oct-20
Middle and lower-income workers have seen greater employment losses than higher-earning
workers. The quartile of lowest-income workers (those earning less than $27,000 per year) has seen
employment decline by about a third (34%). The two middle-earning quartiles (workers making between
$27,000 and $60,000 per year) have seen employment decrease by about a quarter (23%). Conversely,
3
For more information about the Opportunity Insights data and methodology, please visit
https://www.tracktherecovery.org/
4
Unemployment Rate and Labor Force Data Table. State of California Employment Development Department.
Extracted December 28, 2020.
8the highest-earning workers in Santa Cruz County have only seen employment decline by about 6%
(Figure 2).
Figure 2. Change in Employment by Worker Income 5
10%
0%
-6%
-10%
-20% -23%
-30%
-34%
-40%
-50%
Low Income ($60k)
Santa Cruz County Adapts
Like many other hotels, the sting of the pandemic has been particularly strong for the Dream
Inn Santa Cruz. The stay-at-home orders in the spring had kept vacationers away and slowed a
normally-bustling summer season. Out of these challenges came an idea: the vertical concert.
When the concert was announced, the Inn’s 165 rooms sold out in three days. A California
rock band, Los Lobos, set up on the Inn’s pool deck with the Pacific Ocean as their backstop
and guests safely distanced on their balconies. The concert was such a resounding success
that management has announced another seven similar concerts. While the pandemic has
challenged businesses and workers in many ways, Santa Cruz County businesses and residents
have continued to show their resilience and ingenuity.
5
"The Economic Impacts of COVID-19: Evidence from a New Public Database Built Using Private Sector Data", by
Raj Chetty, John Friedman, Nathaniel Hendren, Michael Stepner, and the Opportunity Insights Team. November
2020. Available at: https://opportunityinsights.org/wp-content/uploads/2020/05/tracker_paper.pdf
9Declines in employment tell only part of the economic story. As of February 2021, 10,600 workers
have left the labor force from February 2020. The loss of these workers, who are subsequently not
counted in unemployed figures since they are not seeking work, marks a 9% decline in labor force
participation from pre-pandemic levels (Figure 3). For context, this decline is nearly twice as severe as
the drop in labor force participation during the Great Recession and four times greater than the current
decline in labor force participation seen statewide.
Figure 3. Labor Force Participation (2015 – February 2021) 6
4%
2%
0%
Jul-15
Jul-16
Jul-17
Jul-18
Jul-19
Jul-20
Apr-15
Apr-16
Apr-17
Apr-18
Apr-19
Apr-20
Jan-15
Jan-16
Jan-17
Jan-18
Jan-19
Jan-20
Jan-21
Oct-15
Oct-16
Oct-17
Oct-18
Oct-19
Oct-20
-2%
-2%
-4%
-6%
-8% -9%
-10%
-12%
Santa Cruz County Change from Baseline California Change From Baseline
INDUSTRY-SPECIFIC EMPLOYMENT CHANGES
BW Research developed a model to provide region-specific estimates of the labor market to better
understand the industry-specific changes. These estimates, produced using data from the Bureau of
Labor Statistics and local unemployment claims, showcase the disparate effects the pandemic has had
on sections of the regional labor market.
Many industry clusters with the highest average earnings have seen the mildest employment losses.
Employment losses among the highest-earning industry clusters ranged from 2% to 12%. Four of the six
industry clusters highlighted in Figure 4 saw employment decreases of less than 10%, while losses
among Other Manufacturing and Defense, Aerospace, and Transportation Manufacturing (DATM) were
greater.
6
Unemployment Rate and Labor Force Data Table. State of California Employment Development Department.
Extracted December 28, 2020.
10Figure 4. COVID-19 Pandemic Effects on High-Earning Industry Clusters (February 2020 – February 2021)
$300,000
ICT
Avg. Annual Earnings per Job
$250,000
$200,000
Defense, Aerospace,
$150,000
and Transportation
Manufacturing
Public Services and
Professional and Infrastructure $100,000
Business Services FIRE
Other Manufacturing
$50,000
-15.0% -10.0% -5.0% 0.0%
Change in Employment (Feb 2020 - Feb 2021)
*Size of Bubble Reflects Relative Size of 2019 Employment
Healthcare and Education and Knowledge Creation, two of the largest industry clusters, have seen
employment decline by 9% and 14%, respectively. Two smaller industry clusters, Logistics and
Biotechnology & Biomedical Devices have seen more moderate employment declines of -3% and -4%,
respectively (Figure 5).
Figure 5. COVID-19 Pandemic Effects on Mid-Earning Industry Clusters (February 2020 – February 2021)
$80,000
$78,000
Avg. Annual Earnings per Job
Logistics
$76,000
Biotechnology and $74,000
Building and Design Healthcare Biomedical Devices
$72,000
Education and
Knowledge Creation
$70,000
$68,000
-20.0% -15.0% -10.0% -5.0% 0.0%
Change in Employment (Feb 2020 - Feb 2021)
* Size of Bubble Reflects Relative Size of 2019 Employment
11The industry clusters with the lowest average earnings per job have seen the greatest swings in
employment during the pandemic. Tourism, Recreation, and Hospitality—the second-largest industry
cluster in Santa Cruz County—has lost near six out of ten (58%) of its jobs between February of 2020 and
2021 (Figure 6). In May 2020, employment losses in Tourism, Recreation, and Hospitality had been
closer to eight of every ten jobs (79%).
Figure 6. COVID-19 Pandemic Effects on Low-Earning Industry Clusters (February 2020 – February 2021)
$60,000
Information and
Communications
Avg. Annual Earnings per Job
Agriculture and Food $50,000
Other Services Retail $40,000
Tourism, Recreation, $30,000
and Hospitality
$20,000
-80.0% -60.0% -40.0% -20.0% 0.0% 20.0%
Change in Employment (Feb 2020 - Feb 2021)
* Size of Bubble Reflects Relative Size of 2019 Employment
ONLINE JOB POSTINGS
Online job postings statewide suggest that the economy continues to operate at suppressed levels.
Job postings data gathered from Opportunity Insights and Burning Glass reveals that different sectors of
the economy have recovered at different paces. Statewide job posting activity suggests Financial
Services has nearly recovered to pre-pandemic levels, while postings in Professional and Business
Services remain a fifth (19%) lower than pre-pandemic levels. Education and Health Services as well as
Leisure and Hospitality have recovered in recent months. The rate of job postings for Leisure and
Hospitality went from -67% in late December 2020 to +5.1% by early April 2021, suggesting a rapid
recovery among this sector (Figure 7).
12Figure 7. Statewide Job Postings 7
40.0%
20.0%
7.9%
5.1%
0.0%
-1.7%
-20.0%
-19.0%
-40.0%
-60.0%
-80.0%
Financial Services (NAICS 55) Professional and Business Services (60)
Education and Health Services (NAICS 65) Leisure and Hospitality (NAICS 70)
7
Opportunity Insights “Tracking the Recovery”
13Consumer Spending
Consumer spending can reflect consumer financial well-being and confidence in the future of the
economy. After steep declines in April, consumer spending in Santa Cruz County has rebounded steadily
and trended closely with statewide spending patterns. In recent months consumer spending has leveled
off, fluctuating around +/-5% pre-pandemic rates (Figure 8). While the return of consumer spending is a
positive indicator, it is important to consider change in share of spending that occurs within the local
economy in contrast to growing online-commerce.
Figure 8. Santa Cruz County Consumer Spending from January Baseline 8
10.0%
5.0%
1.2%
0.0%
-5.0% -1.9%
-10.0%
-15.0%
-20.0%
-25.0%
-30.0%
-35.0%
-40.0%
-45.0%
Santa Cruz County State
8
Opportunity Insights “Tracking the Recovery”
14Impacts on Small Businesses
Business revenues have remained at levels 20% to 50% lower than the pre-pandemic averages since
May of 2020. The businesses 9 included in this data--which only excludes the very largest companies in
the county--are vital in the local economy and responsible for a majority of jobs in the County. With
revenues that are consistently between half and two-thirds of what they were before the pandemic,
businesses are undoubtedly struggling to keep their doors open if they’ve been able to open at all. It is
also notable that business revenue losses have been more severe in Santa Cruz County than the
statewide average (Figure 9).
Figure 9. Change in Business Revenue in Santa Cruz County 10
30.0%
20.0%
10.0%
0.0%
Jan-20 Feb-20 Mar-20 Apr-20 May-20 Jun-20 Jul-20 Aug-20 Sep-20 Oct-20 Nov-20 Dec-20 Jan-21
-10.0%
-20.0%
-30.9%
-30.0%
-37.0%
-40.0%
-50.0%
-60.0%
-70.0%
Santa Cruz County State
As revenues have fallen and remained diminished, more and more small businesses have closed their
doors. While small business closures initially trended closely with the statewide average, Santa Cruz
County has seen a greater share of small businesses close in recent months. As of the end of January
2021, nearly five of every ten Santa Cruz County businesses open in January 2020 had closed (Figure 10).
While not all of these closures will be permanent, many of them will be.
9
This analysis uses the SBA definition of a small business, and varies by industry. For more information about this
definition, please visit https://www.sba.gov/document/support--table-size-standards
10
Opportunity Insights “Tracking the Recovery”
15Figure 10. Percent of Open Businesses from January 2020 Baseline in Santa Cruz County 11
10.0%
0.0%
Jan-20 Feb-20 Mar-20 Apr-20 May-20 Jun-20 Jul-20 Aug-20 Sep-20 Oct-20 Nov-20 Dec-20 Jan-21
-10.0%
-20.0%
-30.0%
-37.7%
-40.0%
-46.8%
-50.0%
-60.0%
Santa Cruz County State
Santa Cruz County businesses received more than $566 million through the Paycheck Protection
Program (PPP). In the North sub-region, 3,576 businesses employing 32,260 people received just over
$356 million in loans. In the South sub-region, 972 businesses employing 17,676 people received more
than $210 million. Firms within the Agriculture and Food, Healthcare, and Tourism, Recreation, and
Hospitality industry clusters received the most in total PPP loans (Figure 11).
Disruption and Adaptation in Retail
O’Neill Surf Shop has five locations within Santa Cruz County, employing more than 60 people
in Santa Cruz County. As with other retailers, the pandemic brought about a great shift in
business operations and staffing. After initially closing during the stay-at-home orders, the surf
shops slowly reopened offering curbside pickup, with back-of-the-house staff (those involved
in accounting, sales, and HR) distributing purchases and taking payments. By June, four of the
five locations had reopened at lowered capacity. While the surf shops typically increase
staffing over the summer, there was no need for new hires in 2020. Some types of sales—such
as tourists buying a sweatshirt while getting cold on the Santa Cruz Beach Boardwalk—
disappeared, while others--such as wetsuit sales—saw huge increases. “Since people could no
longer see movies or go out to eat, surfing became the one thing that everyone could do, and
so we saw a huge increase in demand for surfing hardgoods, such as wetsuits and surfboards”
says Beverley Lindberg, General Manager at O’Neill Surf Shop. Since the volatile early months
of the pandemic, daily life at O’Neill Surf Shop has become a bit more steady. As vaccines role
out and everyone hopes for a return to normal, one thing is for sure: “flexibility is here to stay”
says Beverley.
11
Opportunity Insights “Tracking the Recovery”
16Figure 11. Paycheck Protection Plan Loans Disbursed in Santa Cruz County
$- $40,000,000 $80,000,000 $120,000,000
Agriculture and Food $102,576,119
Healthcare $64,305,543
Tourism, Hospitality, and Recreation $63,471,795
Building and Design $61,810,792
Professional and Business Services $51,939,489
Retail $42,475,633
Logistics $33,322,649
Education and Knowledge Creation $25,553,947
Other Services $24,550,699
Finance and Banking, Insurance, Real Estate $17,548,698
Other Manufacturing $15,510,819
Biotechnology and Biomedical Devices $15,025,701
Information and Communication Technologies $14,230,799
Unknown $15,623,029
Information and Communications $9,439,831
Public Services and Infrastructure $6,241,844
Defense, Aerospace, and Transportation Manufacturing $2,706,480
17Socially-Distant Occupations
BW Research developed an occupation-level volatility index based on an occupation’s physical proximity
score in O*NET occupation data. This analysis classifies jobs into three tiers. Occupations where physical
proximity to others is most important are classified as Tier 3. Tier 3 occupations, including Waitresses
and Teachers, have likely seen notable volatility or disruption as a consequence of social distancing and
public health mandates. Occupations with middling human-proximity needs, such as Advertising Agents
and Real Estate Agents, needs are classified as Tier 2 and have likely seen some volatility and disruption
but remain largely unchanged. Tier 1 jobs are occupations, ranging from Graphic Designers to Loggers,
with the lowest need for physical proximity to others. These jobs have been least affected by social
distancing requirements.
The relatively high share of the workforce heavily reliant upon physical proximity likely plays a role in
the economic distress in Santa Cruz County. About four in ten jobs in the County have a high need for
proximity to other people—and these jobs are the most likely to be affected by public health orders and
social distancing. This ratio of most-impacted workers is notably higher than the rest of the state where
only 30% of workers fall into this category (Figure 12).
Figure 12. Job Volatility Resulting from Social Distancing Requirements
70%
60%
50%
40%
30%
20%
10%
0%
Least Impacted by Social Distancing Somewhat Impacted Most Impacted by Social Distancing
Santa Cruz County California
18Regional Economic Profile
The COVID-19 pandemic has had dramatic and unprecedented impacts on the economy and labor
market, the full extent of which remains to be seen. As efforts are made to recover, restore opportunity,
and bolster resilience, it will be crucial to examine the underlying and pre-pandemic economy to best
develop strategies and allocate resources.
In the years preceding the pandemic, Santa Cruz County had seen consistent and robust growth. Figure
13 highlights consistent overall employment growth between 2014 and 2019, with the number of jobs
growing 8% during this time. Though this growth rate was strong, the state saw stronger growth,
expanding the number of jobs by 11% during the same time.
Figure 13. Santa Cruz County Overall Employment (2014-2019) 12
112,000 12.0%
110,000
10.0%
108,000
8.0%
106,000
104,000 6.0%
102,000
4.0%
100,000
2.0%
98,000
96,000 0.0%
2014 2015 2016 2017 2018 2019
Santa Cruz County Employment
Santa Cruz County Employment Growth (from 2014 baseline)
Statewide Employment Growth (from 2014 baseline)
Industry Clusters
Examining industry clusters provides a detailed understanding of the major components and driving
forces of a region’s economy. Industry clusters are groups of industries that share similar talent, supply
chains, customers, and technologies. Industry clusters are important because they provide a coherent
picture of the local economy and opportunities for development or growth. Industry clusters can also
have multiplier effects, as firms within clusters attract similar workforces, strengthening the local labor
market and attracting more firms of that industry.
12
Emsi 2020.3
19Many industry clusters with the highest earnings per job saw substantial growth in Santa Cruz County
between 2014 and 2019. Manufacturing industry clusters in the County have shown particularly strong
growth; Defense, Aerospace, and Transportation Manufacturing (DATM) employment increased by
164%, and Other Manufacturing (which includes the production of raw materials, component parts,
durable and non-durable goods) saw the number of jobs increase by 43% (Figure 14).
Figure 14. Highest-Earning Industry Clusters in Santa Cruz County 13
$300,000
ICT
$250,000
Avg. Annual Earnings
$200,000
Public Services and
$150,000
Infrastructure
Defense, Aerospace,
Professional and
and Transportation
$100,000 Business Services
Manufacturing
FIRE
Other Manufacturing
$50,000
-30.0% 20.0% 70.0% 120.0% 170.0%
Change in Employment (2014-2019)
*Size of Bubble Reflects Relative Number Employed in Industry
Growth among mid-earning industry clusters was typically more moderate. Two of the County’s largest
industry clusters—Healthcare and Education and Knowledge Creation—increased in size by 9% and 6%,
respectively. The Building and Design cluster, which includes the design and construction of buildings
and other structures, saw employment increase by 29% between 2014 and 2019 (Figure 15).
13
Emsi 2020.3
20Figure 15. Mid-Earning Industry Clusters in Santa Cruz County 14
$80,000
$78,000
Logistics
Avg. Annual Earnings
$76,000
$74,000 Biotechnology and
Biomedical Devices Healthcare Building and Design
$72,000
Education and
Knowledge Creation
$70,000
$68,000
-20.0% -10.0% 0.0% 10.0% 20.0% 30.0% 40.0%
Change in Employment (2014-2019)
*Size of Bubble Reflects Relative Number Employed in Industry
While some of the lowest-earning industry clusters in Santa Cruz County saw low or even negative
growth before the pandemic, some have seen strong growth. Tourism, Recreation, and Hospitality and
Other Services (including everything from autobody shops to nail salons) have seen strong recent
growth of 15% and 14%, respectively. Alternatively, Agriculture and Food and Retail saw mild to even
negative growth during this same time. Information and Communications, which includes industries
around print and digital media, shrank notably between 2014 and 2019, losing 18% of the jobs in the
cluster (Figure 16).
14
Emsi 2020.3
21Figure 16. Lowest-Earning Industry Clusters in Santa Cruz County 15
$60,000
Information and Trendline Error
Communications
$50,000 Agriculture and Food
Avg. Annual Earnings
Retail Other Services
$40,000
$30,000 Tourism, Recreation,
and Hospitality
$20,000
-20.0% -10.0% 0.0% 10.0% 20.0%
Change in Employment (2014-2019)
*Size of Bubble Reflects Relative Number Employed in Industry
Job Quality
Job quality is an important measure of a region’s labor market. A region may have a lot of jobs, but if
most of those jobs are pay low wages and require relatively little skill and education, the regional
workforce and economy are likely to suffer. BW Research examined wage data from the Bureau of Labor
Statistics’ Occupational Employment Statistics (OES) to determine job quality. Occupations within 3-digit
NAICS industries were assigned tiers based on median annual earnings. Looking at occupations within
specific industries allows for differentiation between occupations across industries. This captures the
difference between, for example, a medical equipment sales representative and a clothing retail sales
representative. Since wages are strongly correlated with a job’s skill, education, and experience
requirements, wages provide an intuitive metric to assess job quality.
15
Emsi 2020.3
22Table 1. Job Quality Definitions
TIER 1 OCCUPATION TIER 2 OCCUPATIONS TIER 3 OCCUPATIONS
Tier 1 occupations are typically Tier 2 occupations are typically Tier 3 occupations are typically
the highest-paying, highest- the middle-skill, middle-wage the lowest-paying, lowest-skilled
skilled occupations in the occupations. This occupational occupations that have
economy. This occupational category includes positions such historically provided the largest
category includes positions such as technicians, teachers, office portion of employment in the
as managers (e.g., Chief and administrative positions region. These occupations
Executives and Sales Managers), (e.g., Accounting Clerks and include positions such as security
professional positions (e.g., Secretaries), and manufacturing, guards, food service and retail
Lawyers and Physicians), and operations, and production positions, building and grounds
highly skilled technology positions (e.g., Assemblers, cleaning positions (e.g., Janitors),
occupations, such as scientists, Electricians, and Machinists). and personal care positions (e.g.,
engineers, computer Home Health Aides and Child
programmers, and software Care Workers).
developers.
Job quality is lower in Santa Cruz County than the broader state. Compared to the statewide average,
Santa Cruz County has a higher share of lower-paying, lower-skill Tier 3 jobs and a lower proportion of
higher-paying, higher-skill Tier 1 jobs (Figure 17). This suggests that upward mobility and advancement
opportunities within Santa Cruz County may be somewhat limited relative to the broader state.
Figure 17. Job Quality (2019) 16
60.0%
50.0%
40.0%
30.0%
20.0%
10.0%
0.0%
Tier 1 Tier 2 Tier 3
Santa Cruz County Statewide
16
Emsi 2020.3
23Job quality in Santa Cruz County has improved in recent years. Between 2014 and 2019, the share of
Tier 1 and Tier 2 jobs increased, while the share of Tier 3 jobs shrank. It is also notable that job quality in
Santa Cruz County grew at a faster rate than the state overall (Figure 18). Improving job quality bodes
well for the County and its workforce, and continuing this trend of improving job quality should be
prioritized.
Figure 18. Change in Job Quality (2014-2019) 17
-4.0% -3.0% -2.0% -1.0% 0.0% 1.0% 2.0% 3.0% 4.0% 5.0% 6.0% 7.0%
Tier 1
Tier 2
Tier 3
Santa Cruz County Statewide
Job Volatility
BW Research developed a job volatility index that ranks occupations based on the share of their skills
and abilities that can be replaced by modern technology. To do this, the research team examined O*NET
data that contains occupation-level survey data on 26 different skills. These skills were examined on
their relative importance to the job and their complexity. The scores for each of these skills were then
aggregated within each occupation, resulting in a metric that demonstrates the relative risk an
occupation has of change due to technological advancement.
17
Emsi 2020.3
24Tier 1 Tier 2 Tier 3 Tier 4
Automation Automation Automation Automation
Volatility Volatility Volatility Volatility
Tier 1 occupations Tier 2 occupations Tier 3 occupations Tier 4 occupations are
have a very low share have some tasks that have a moderate the most at risk of
of activities that can can be automated, share of work that can automation. A large
be replaced or heavily though automation be replaced by share of work activities
augmented by will likely expand technology. These can be replaced or
technology within five these roles rather occupations include heavily augmented by
years. These than replace them. Landscaping and technology within five
occupations include These occupations Groundskeeping years. These
Coaches and Scouts, include Pest Control Workers, Dishwashers, occupations include
Surgeons, and Chief Workers, Graphic and Travel Agents. Slaughterers and Meat
Executives. Designers, and Energy Packers and Sewing
Auditors. Machine Operators.
Nearly half (49%) of Santa Cruz County jobs fall under the ‘moderately automatable’ category. This
category includes Home Health and Personal Care Aids, Farmworkers and Laborers, Cashiers, and Retail
Salespersons. For many of these roles, automation already exists in some capacity; there are self-driving
tractors, self-checkouts, and an increasing share of goods are bought online. While these technologies
are unlikely to entirely replace these roles in the near future, they may suppress hiring and wages over
time as technologies decline in costs. About 17% of the workforce—a smaller portion than the statewide
average—fall under the ‘very automatable’ category (Figure 19), suggesting that there are few jobs that
are in immediate jeopardy of significant disruption or replacement via automation.
25Figure 19. Occupational Volatility Due to Progressing Technology
60.0%
50.0%
40.0%
30.0%
20.0%
10.0%
0.0%
Tier 1 (Little to no Tier 2 (Slight automation Tier 3 (Moderate Tier 4 (High auotmation
automation volatility) volatility) automation volatility) volatility)
Santa Cruz County Statewide
Regional Jobs and Workforce
Santa Cruz County is a net exporter of talent. In fact, there are more resident workers than jobs across
each of the major occupational categories (Figure 20). Management, business, science, and arts
occupations are the occupational category with the greatest number of exported jobs; there are nearly
9,000 more workers in these roles who live in the County than there are jobs in these roles. This means
that nearly a quarter (23%) of residents in these occupations have to commute outside of the County for
work.
Figure 20. Working Residents and Jobs in Santa Cruz County (2019) 18
40,000
30,000
20,000
10,000
0
Management, Service occupations Sales and office Natural resources, Production,
business, science, and occupations construction, and transportation, and
arts occupations maintenance material moving
occupations occupations
2019 Jobs 2019 Resident Workers
18
Emsi 2020.3
26Although a significant portion of residents have to travel outside of the County for their jobs, the
proportion of residents who have had to do so has declined in recent years. Between 2014 and 2019, a
slightly smaller share of residents in Production, Transportation, and Mineral Moving; Natural
Resources, Construction, and Maintenance; and Sales and Office occupations had to travel outside the
County for their jobs. Conversely, the share of residents who work in the County declined among Service
occupations, as well as among Management, Business, Science, and Arts occupations (Figure 21).
Figure 21. Change in the Proportion of Resident Who Work in Santa Cruz County (2014-2019)
Change in Residents Who Work in Santa Cruz County
Production, transportation, and material moving
occupations
Natural resources, construction, and maintenance
occupations
Sales and office occupations
Service occupations
Management, business, science, and arts occupations
-0.5% 0.0% 0.5% 1.0% 1.5% 2.0%
A Silver Lining
The pandemic accelerated many challenges the agriculture labor market in Santa Cruz County
was already experiencing. While high costs of living meant that the pre-pandemic flow of new
agriculture workers moving to the County was minimal, the pandemic reduced that flow to
zero. Sun Valley Farms was relatively well positioned for this disruption, having revised their
business model in 2014 to focus on smaller scale and organic farming, often carried out by
workers who have been at Sun Valley for years.
While the pandemic disrupted worker protocols and added significant volatility to demand, the
smaller farm with a committed and consistent workforce was able to weather the
unprecedented times. As June Ponce, owner of Sun Valley Farms noted “the silver lining of the
pandemic is that it gave us a minute to pause and think about what we wanted to be, and it
reinforced that we want to be stewards of the land and keep providing excellent produce to
feed people and support the families that work for us.”
27Regional Demographic Profile
Race and Ethnicity
Overall, Santa Cruz County has a larger share of White residents than the statewide average, and this is
particularly true in the North sub-region, in which 82% of residents are White. Conversely, the South
sub-region has relatively large Hispanic or Latino and Some Other Race populations (Figure 22). The
share of White residents in the South sub-region has also declined in recent years; between 2014 and
2019, the share of White residents declined by 19%. The North sub-region has also seen a slight
decrease (-3%) in its proportion of White residents, while Asian, Some Other Race, and Two or More
Races residents have increased by 16% or more (Figure 23).
Figure 22. Race and Ethnicity of Santa Cruz County (2019) 19
90.0%
80.0%
70.0%
60.0%
50.0%
40.0%
30.0%
20.0%
10.0%
0.0%
White Black or African Asian Some other race Two or more Hispanic or Latino
American races
North sub-region South sub-region Santa Cruz County Statewide
19
American Community Survey 5-Year Estimates (2014-2019). United States Census Bureau.
28Figure 23. Change in Race and Ethnicity of Santa Cruz County (2014-19) 20
-40.0% -20.0% 0.0% 20.0% 40.0% 60.0% 80.0% 100.0% 120.0%
White
Black or African American
Asian
Some other race
Two or more races
Hispanic or Latino
North sub-region South sub-region Santa Cruz County Statewide
Age Profile
The North sub-region of the County is significantly older than the South sub-region. More than a
quarter (28%) of the South sub-region’s population is under 18, compared to only 19% in the North sub-
region. Conversely, nearly a third (32%) of the North sub-region is 55 or older, compared to 23% of the
South sub-region (Figure 24). These differences suggest that a larger share of the North sub-region’s
population is exiting prime working age, while a notable share of the South sub-region will soon be
entering prime schooling and working age.
Figure 24. Age Distribution of Santa Cruz County (2019) 21
30.0%
25.0%
20.0%
15.0%
10.0%
5.0%
0.0%
Ages Under 18 Ages 18-24 Ages 25-34 Ages 35-44 Ages 45-54 Ages 55-64 Ages 65+
North sub-region South sub-region Santa Cruz County
20
American Community Survey 5-Year Estimates (2014-2019). United States Census Bureau.
21
American Community Survey 5-Year Estimates (2014-2019). United States Census Bureau.
29Between 2014 and 2019, the North sub-region saw significant growth in the share of residents 65 and
older. This highlights that a large portion of the North sub-region’s population is exiting prime-working
age. While the South sub-region also saw substantial population growth among older cohorts (55 and
older), the trend was lesser in magnitude (Figure 25).
Figure 25. Change in the Age Distribution of the Santa Cruz County Population (2014-19) 22
65+
55-64
45-54
35-44
25-34
18-24
Under 18
-20.0% -10.0% 0.0% 10.0% 20.0% 30.0% 40.0%
Santa Cruz County South sub-region North sub-region
22
American Community Survey 5-Year Estimates (2014-2019). United States Census Bureau.
30Educational Attainment
While Santa Cruz County as a whole has higher educational attainment rates than the state, there are
stark differences within the County. Within Santa Cruz County, the South sub-region has lower
educational attainment rates while the North sub-region has educational attainment rates that far
surpass the state average. About a third of the population 25 and older in the South sub-region does not
have a high school diploma or equivalent. Conversely, nearly half (48%) of the population 25 and older
in the North sub-region has a Bachelor’s degree or higher (Figure 26).
Figure 26. Educational Attainment (Population Ages 25+) (2019) 23
60.0%
50.0%
40.0%
30.0%
20.0%
10.0%
0.0%
Less than HS Diploma HS Diploma or Equivalent Some College, no Degree or Bachelors Degree or Higher
Associates Degree
North sub-region South sub-region Santa Cruz County State Average
Educational attainment disparities exist across race and ethnicity as well as geographic sub-region.
Figure 27 highlights that racial and ethnic minorities are substantially more likely not to have a high
school diploma than their White counterparts. In some cases, these differences are in order of
magnitude: individuals in the South sub-region who identify as “Some Other Race” 24 are ten times more
likely not to have a high school diploma than White residents. Similarly, Hispanic or Latino residents are
9.4 times more likely not to have a high school diploma.
American Community Survey 5-Year Estimates (2014-2019). United States Census Bureau.
23
This includes “some other race,” “Native Hawaiian and Other Pacific Islander,” and “American Indian or Alaskan
24
Native.”
31Figure 27. Less Than a High School Diploma (or Equivalent) by Race and Ethnicity (Population Ages 25+) (2019) 25
60.0%
50.0%
40.0%
30.0%
20.0%
10.0%
0.0%
White Alone Black Alone Asian Alone Some Other Race Two or More Hispanic or Latino
Alone Races
North sub-region South sub-region
25
American Community Survey 5-Year Estimates (2014-2019). United States Census Bureau.
32Housing Characteristics
Sixty percent of residents in Santa Cruz County own their home. Of the 40% that rent, half (50%) spend
35% or more of their income on housing. Among homeowners with a mortgage, about 30% spend 35%
or more. Spending on housing is roughly the same across sub-regions, though a slightly larger share of
renters in the South sub-region spend 35% or more on rent (Figure 29) than the North sub-region
(Figure 28).
The State of the Healthcare Workforce in Santa Cruz County
The pandemic has catalyzed three substantial changes in the healthcare industry in Santa
Cruz County. One such change is the rapid digitization of patient care. The sudden demand
for telehealth pushed workers to learn new systems, software, and regulations. Many
providers were able to scale up systems they already had in place. The increased reliance
on telehealth has also elevated the importance of reliable internet access, something that
is “tremendously important, especially for underserved populations” says Dr. Larry
DeGhetaldi, Sutter Health Palo Alto Medical Foundation Santa Cruz division president.
The pandemic’s shift in the types of services demanded has also constrained budgets for
many healthcare providers. Pandemic-related care has increased, often with limited
compensation, while elective operations and procedures have ground to a near-halt. These
budget constraints have put healthcare providers in a tough spot, simultaneously slowing
hiring and reducing headcount to manage expenses, while facing heightened workloads.
The arrival of effective vaccines has led to a third transformation. A pandemic-weary
workforce is now tasked with the additional challenge of a rapid vaccination rollout and
regulations restrict who can administer the vaccines. While regulators are working on
alleviating these requirements, the colossal challenge of vaccinating hundreds of thousands
of residents looms large. These forces have undoubtedly changed the shape of the
healthcare industry and workforce and will likely have lasting effects.
33Figure 28. Share of Income Residents Spend on Housing in North Sub-Region (2019) 26
60.0%
50.0%
40.0%
30.0%
20.0%
10.0%
0.0%
Less than 20% 20.0% - 24.9% 25.0% - 29.5% 30.0% - 34.5% 35.0% or more
Renters Homeowners (with a mortgage)
Figure 29. Share of Income Residents Spend on Housing in South Sub-Region (2019) 27
60.0%
50.0%
40.0%
30.0%
20.0%
10.0%
0.0%
Less than 20% 20.0% - 24.9% 25.0% - 29.5% 30.0% - 34.5% 35.0% or more
Renters Homeowners (with a mortgage)
High housing costs also play a role in equity and economic mobility in the region. Figure 30 highlights
that Black or African American, Hispanic or Latino, and residents who identify as some other race are
more likely to rent than own a home. Given that renters tend to spend greater proportions of their
incomes on housing, it is evident that high housing costs can reinforce inequities and hinder economic
mobility.
26
American Community Survey 5-Year Estimates (2014-2019). United States Census Bureau.
27
American Community Survey 5-Year Estimates (2014-2019). United States Census Bureau.
34Figure 30. Share of Homeownership by Race and Ethnicity (2019) 28
90.0%
80.0%
70.0%
North Regional Average
60.0%
South Regional Average
50.0%
40.0%
30.0%
20.0%
10.0%
0.0%
White alone, not Black or African Asian Two or more Hispanic or Latino *Some Other Race
Hispanic or Latino American races origin
North sub-region South sub-region
Commuting Patterns
Driving alone remains the predominant means of traveling to work across Santa Cruz County. Residents
in the North sub-region are more likely to walk, take public transit, bike, or work from home, while
South sub-region residents are more likely to drive alone, carpool, or take a motorcycle, taxi, or
rideshare (Figure 31).
Figure 31. Typical Means of Transportation to Work (2019) 29
80.0%
60.0%
40.0%
20.0%
0.0%
Drove alone Carpooled Public Walked Bicycle Taxicab, Worked from
transportation motorcycle, or home
(excluding other means
taxicab)
North sub-region South sub-region
28
American Community Survey 5-Year Estimates (2014-2019). United States Census Bureau.
29
American Community Survey 5-Year Estimates (2014-2019). United States Census Bureau.
35You can also read