MAURICIO ROCHA MENDES POLITICAL NEWS AND THE BRAZILIAN SWAP MARKETS - Porto Alegre 2020 - UNIVERSIDADE FEDERAL DO RIO GRANDE DO SUL FACULDADE DE ...
←
→
Page content transcription
If your browser does not render page correctly, please read the page content below
UNIVERSIDADE FEDERAL DO RIO GRANDE DO SUL
          FACULDADE DE CIÊNCIAS ECONÔMICAS
 DEPARTAMENTO DE ECONOMIA E RELAÇÕES INTERNACIONAIS

             MAURICIO ROCHA MENDES

POLITICAL NEWS AND THE BRAZILIAN SWAP MARKETS

                     Porto Alegre
                         2020
MAURICIO ROCHA MENDES
POLITICAL NEWS AND THE BRAZILIAN SWAP MARKETS
Trabalho de conclusão submetido ao Curso de
Graduação em Ciências Econômicas da UFRGS,
como requisito parcial para obtenção do tı́tulo
de Bacharel em Economia
Orientador: Prof. Dr. Nelson Seixas dos
Santos
Porto Alegre
2020MAURICIO ROCHA MENDES
POLITICAL NEWS AND THE BRAZILIAN SWAP MARKETS/ MAURICIO
ROCHA MENDES. – Porto Alegre, 2020-
50p. : il. (algumas color.) ; 30 cm.
Supervisor: Nelson Seixas dos Santos
Trabalho de conclusão de curso (Graduação – Universidade Federal do Rio Grande do
Sul
Faculdade de Ciências Econômicas
Departamento de Economia e Relações Internacionais, 2020.
1. Palavra-chave1. 2. Palavra-chave2. 2. Palavra-chave3. I. Orientador. II. Univer-
sidade xxx. III. Faculdade de xxx. IV. Tı́tuloMAURICIO ROCHA MENDES
POLITICAL NEWS AND THE BRAZILIAN SWAP MARKETS
Trabalho de conclusão submetido ao Curso de
Graduação em Ciências Econômicas da UFRGS,
como requisito parcial para obtenção do tı́tulo
de Bacharel em Economia
Orientador: Prof. Dr. Nelson Seixas dos
Santos
Trabalho aprovado. Porto Alegre, 16 de novembro de 2020:
Nelson Seixas dos Santos
Orientador
Carlos Eduardo Schonerwald da Silva
UFRGS
Fernando A. B. Sabino da Silva
UFRGS
Porto Alegre
2020Aos meus avós.
ACKNOWLEDGEMENTS

       This work is dedicated to my mother, who is always there whenever i need. To my
grandmother and late grandfather, for the support through my whole life. To my sister and
brothers, for the companionship. To my friends, who were there for most of this course.
       I also thank UFRGS professors, with a special thanks to professor Dr. Nelson Seixas dos
Santos for his guidance through the last months.
RESUMO Este trabalho estuda o efeito da divulgação de notı́cias relacionadas à polı́tica brasileira nos quatro contratos de swap mais negociados na bolsa de valores brasileira. Foram coletadas manchetes de notı́cias relacionadas a eventos polı́ticos do site g1.com.br, e as taxas de referência dos preços dos contratos swap negociados do site b3.com.br para os swaps DI x Pre, Dollar x Pre, DI x DOllar e DI x IPCA. O perı́odo analisado é de 1o de Fevereiro de 2017 a 2 de Outubro de 2020. As notı́cias foram coletadas por web scraping e filtradas para eventos polı́ticos com o uso de palavras-chave. Foi aplicado um modelo GARCH nos dados coletados das taxas referenciais dos contratos de maturidades 30, 60, 90 e 180 dias para estimar a volatilidade condicional e checar os movimentos de volatilidade anormal utilizando análises paramétrica e não paramétrica. Resultados indicaram que os contratos de 60, 90 e 180 dias dos três contratos mais negociados foram altamente afetados pela divulgação da gravação do áudio do presidente Temer em Maio de 2017, e dois dos contratos mostraram movimentos anormais em dias de divulgação de novas repercussões dessas investigações, em dias de expecativa de eleições e dias próximos ao primeiro turno de eleições, em Setembro e Outubro de 2018, e em dias de expectativas sobre a aprovação de reforma tributária e reforma da previdência. Estresse polı́tico também teve efeito nos três principais contratos em 2020, como no rompimento entre o Ministro Sérgio Moro e o presidente Bolsonaro. Classificação JEL: C58, G14. Palavras-chave: Mercado financeiro. Informação polı́tica. Notı́cias. Mercados eficientes.
ABSTRACT

This study checks the effect of political related news on the four most negotiated swap contracts
of the brazilian stock exchange. We collect news headlines related to political events from ”G1”
website, and reference rates for swap contracts prices from the brazilian stock exchange, ”B3”,
website for the swap contracts ”DI x Pre”, ”Dollar x Pre”, ”DI x Dollar” and ”DIx IPCA”. The
time range is February 1st , 2017 to October 2nd 2020. We collect the headlines by web scraping
and filter them for political events with the use of keywords. We use a GARCH model on swap
contracts data of 30, 60, 90 and 180 days maturities to estimate conditional volatility to check for
abnormal movements using both parametric and non-parametric analysis. Results indicate that
60, 90 and 180 days maturities of the three most negotiated contracts were highly affected by the
disclosure of President Temer audio recording in May 2017, with two of the contracts showing
abnormal movements during new repercussions of investigations, during the expectations and
the days prior and just after first round of elections in September and October 2018, and during
days of expectations of approval of political measures like pension and tax reforms. Political
stress also had an effect on the contracts in 2020, when Minister of Justice Sergio Moro left the
government.

JEL Classification: C58, G14.
Keywords: Financial Markets. Political information. News. Efficient Markets.
LIST OF FIGURES

Figure 1 –    DI x Pre swaps reference rates for different maturities . .    .   .   .   .   .   .   .   .   .   .   22
Figure 2 –    Selic Rate . . . . . . . . . . . . . . . . . . . . . . . . .   .   .   .   .   .   .   .   .   .   .   23
Figure 3 –    DI x Pre daily variation . . . . . . . . . . . . . . . . . .   .   .   .   .   .   .   .   .   .   .   23
Figure 4 –    Dollar x Pre swaps reference rates for different maturities    .   .   .   .   .   .   .   .   .   .   24
Figure 5 –    DI x Dollar swaps reference rates for different maturities     .   .   .   .   .   .   .   .   .   .   26
Figure 6 –    DI x IPCA swaps reference rates for different maturities .     .   .   .   .   .   .   .   .   .   .   27
Figure 7 –    GARCH for 30 days series . . . . . . . . . . . . . . . .       .   .   .   .   .   .   .   .   .   .   29
Figure 8 –    GARCH for 60 days series . . . . . . . . . . . . . . . .       .   .   .   .   .   .   .   .   .   .   30
Figure 9 –    GARCH for 90 days series . . . . . . . . . . . . . . . .       .   .   .   .   .   .   .   .   .   .   30
Figure 10 –   GARCH for 180 days series . . . . . . . . . . . . . . . .      .   .   .   .   .   .   .   .   .   .   30
Figure 11 –   CSD for 30 days series . . . . . . . . . . . . . . . . . .     .   .   .   .   .   .   .   .   .   .   31
Figure 12 –   CSD for 60 days series . . . . . . . . . . . . . . . . . .     .   .   .   .   .   .   .   .   .   .   31
Figure 13 –   CSD for 90 days series . . . . . . . . . . . . . . . . . .     .   .   .   .   .   .   .   .   .   .   32
Figure 14 –   CSD for 180 days series . . . . . . . . . . . . . . . . . .    .   .   .   .   .   .   .   .   .   .   32
Figure 15 –   Parametric limits for DI x Pre Variation CSD . . . . . . .     .   .   .   .   .   .   .   .   .   .   33
Figure 16 –   Parametric limits for Dollar x Pre CSD . . . . . . . . . .     .   .   .   .   .   .   .   .   .   .   34
Figure 17 –   Parametric limits for DI x Dollar CSD . . . . . . . . . .      .   .   .   .   .   .   .   .   .   .   35
Figure 18 –   Parametric limits for DI x IPCA CSD . . . . . . . . . . .      .   .   .   .   .   .   .   .   .   .   35
Figure 19 –   Non Parametric limits for DI x Pre Variation CSD . . . .       .   .   .   .   .   .   .   .   .   .   37
Figure 20 –   Non Parametric limits for Dollar x Pre CSD . . . . . . .       .   .   .   .   .   .   .   .   .   .   38
Figure 21 –   Non Parametric limits for DI x Dollar CSD . . . . . . . .      .   .   .   .   .   .   .   .   .   .   39
Figure 22 –   Non Parametric limits for DI x IPCA CSD . . . . . . . .        .   .   .   .   .   .   .   .   .   .   39
LIST OF TABLES

Table 1 –    National Financial System . . . . . . . . . . . . . . . . . . .    .   .   .   .   .   .   .   .   14
Table 2 –    News Sample . . . . . . . . . . . . . . . . . . . . . . . . . .    .   .   .   .   .   .   .   .   21
Table 3 –    Descriptive Statistics for Swap DI x Pre . . . . . . . . . . . .   .   .   .   .   .   .   .   .   22
Table 4 –    ADF test for DI x Pre Variation data . . . . . . . . . . . . . .   .   .   .   .   .   .   .   .   24
Table 5 –    KPSS test for DI x Pre Variation data . . . . . . . . . . . . .    .   .   .   .   .   .   .   .   24
Table 6 –    Descriptive Statistics for Swap Dollar x Pre . . . . . . . . . .   .   .   .   .   .   .   .   .   25
Table 7 –    ADF test for Dollar x Pre swap data . . . . . . . . . . . . . .    .   .   .   .   .   .   .   .   25
Table 8 –    KPSS test for Dollar x Pre swap data . . . . . . . . . . . . . .   .   .   .   .   .   .   .   .   25
Table 9 –    Descriptive Statistics for Swap DI x Dollar . . . . . . . . . .    .   .   .   .   .   .   .   .   26
Table 10 –   ADF test for DI x Dollar swap data . . . . . . . . . . . . . .     .   .   .   .   .   .   .   .   26
Table 11 –   KPSS test for DI x Dollar swap data . . . . . . . . . . . . . .    .   .   .   .   .   .   .   .   27
Table 12 –   Descriptive Statistics for Swap DI x IPCA . . . . . . . . . . .    .   .   .   .   .   .   .   .   28
Table 13 –   ADF test for DI x IPCA variation data . . . . . . . . . . . . .    .   .   .   .   .   .   .   .   28
Table 14 –   KPSS test for DI x IPCA swap data . . . . . . . . . . . . . .      .   .   .   .   .   .   .   .   28
Table 15 –   Ljung-Box p-values . . . . . . . . . . . . . . . . . . . . . . .   .   .   .   .   .   .   .   .   29
Table 16 –   Shapiro-Wilk Results . . . . . . . . . . . . . . . . . . . . . .   .   .   .   .   .   .   .   .   31
Table 17 –   Descriptive Statistics for 30 days CSD . . . . . . . . . . . . .   .   .   .   .   .   .   .   .   31
Table 18 –   Descriptive Statistics for 60 days CSD . . . . . . . . . . . . .   .   .   .   .   .   .   .   .   32
Table 19 –   Descriptive Statistics for 90 days CSD . . . . . . . . . . . . .   .   .   .   .   .   .   .   .   32
Table 20 –   Descriptive Statistics for 180 days CSD . . . . . . . . . . . .    .   .   .   .   .   .   .   .   32
Table 21 –   Limits for DI x Pre Variation CSD . . . . . . . . . . . . . . .    .   .   .   .   .   .   .   .   33
Table 22 –   Limits for Dollar x Pre CSD . . . . . . . . . . . . . . . . . .    .   .   .   .   .   .   .   .   34
Table 23 –   Limits for DI x Dollar CSD . . . . . . . . . . . . . . . . . .     .   .   .   .   .   .   .   .   34
Table 24 –   Limits for DI x IPCA CSD . . . . . . . . . . . . . . . . . . .     .   .   .   .   .   .   .   .   35
Table 25 –   Abnormal volatility periods in Dollar x Pre and DI x Dollar .      .   .   .   .   .   .   .   .   36
Table 26 –   Non Parametric Limits for DI x Pre CSD Variation . . . . . .       .   .   .   .   .   .   .   .   36
Table 27 –   Non Parametric Limits for Dollar x Pre CSD . . . . . . . . .       .   .   .   .   .   .   .   .   37
Table 28 –   Non Parametric Limits for DI x Dollar CSD . . . . . . . . . .      .   .   .   .   .   .   .   .   37
Table 29 –   Non Parametric Limits for DI x IPCA CSD . . . . . . . . . .        .   .   .   .   .   .   .   .   37
Table 30 –   Non Parametric Abnormal volatility DI x Pre and DI x Dollar        .   .   .   .   .   .   .   .   38
Table 31 –   Parametric DIxPre News . . . . . . . . . . . . . . . . . . . .     .   .   .   .   .   .   .   .   40
Table 32 –   Parametric Dollar x Pre and DI x Dollar News . . . . . . . . .     .   .   .   .   .   .   .   .   41
Table 33 –   Parametric DI x IPCA news . . . . . . . . . . . . . . . . . .      .   .   .   .   .   .   .   .   41
Table 34 –   Political events from parametric results . . . . . . . . . . . .   .   .   .   .   .   .   .   .   42
Table 35 –   Non Parametric DIxPre News . . . . . . . . . . . . . . . . .       .   .   .   .   .   .   .   .   43
Table 36 –   Non Parametric Dollar x Pre and DI x Pre News . . . . . . . .      .   .   .   .   .   .   .   .   44
Table 37 – Non Parametric DI x IPCA news . . . . . . . . . . . . . . . . . . . . . . . . 44
LIST OF ABBREVIATIONS AND ACRONYMS

B3        Commodities and Futures Exchange

CMN       Monetarary National Council

CVM       Securities Comission

CSD       Conditional Standard Deviation

COPOM     Monetary Policy Committee

DI        Interbank Deposit

DI-Over   Interbank Deposit Overnight Rate

GARCH     Generalized autoregressive conditional heteroskedasticity

IGPM      General Market Prices Index

IPCA      Extended National Consumer Price Index

Pre       Prefixed rate

Selic     Special Settlement and Custody System Rate
CONTENTS

1         INTRODUCTION . . . . . . . . . . . . . . . . . . . . . . . . . . . . . .                                                           13

2         BRAZILIAN MARKETS AND THE INTEREST RATE                                                        .   .   .   .   .   .   .   .   .   14
2.1       Brazilian Financial System . . . . . . . . . . . . . . . . .                                   .   .   .   .   .   .   .   .   .   14
2.2       Interest Rates and its derivatives . . . . . . . . . . . . .                                   .   .   .   .   .   .   .   .   .   15
2.3       Swap Contracts . . . . . . . . . . . . . . . . . . . . . . .                                   .   .   .   .   .   .   .   .   .   15

3         LITERATURE REVIEW . . . . . . . . . . . .                                  .   .   .   .   .   .   .   .   .   .   .   .   .   .   17
3.1       Efficient Markets Hypothesis . . . . . . . . . .                           .   .   .   .   .   .   .   .   .   .   .   .   .   .   17
3.2       Effects of news and announcements on markets                               .   .   .   .   .   .   .   .   .   .   .   .   .   .   18
3.3       Swaps . . . . . . . . . . . . . . . . . . . . . . .                        .   .   .   .   .   .   .   .   .   .   .   .   .   .   19

4         DATA AND METHODOLOGY                   .   .   .   .   .   .   .   .   .   .   .   .   .   .   .   .   .   .   .   .   .   .   .   20
4.1       Data . . . . . . . . . . . . . . .     .   .   .   .   .   .   .   .   .   .   .   .   .   .   .   .   .   .   .   .   .   .   .   20
4.1.1     News Source . . . . . . . . . . .      .   .   .   .   .   .   .   .   .   .   .   .   .   .   .   .   .   .   .   .   .   .   .   20
4.1.2     Swap Reference Rates . . . . .         .   .   .   .   .   .   .   .   .   .   .   .   .   .   .   .   .   .   .   .   .   .   .   21
4.1.2.1   DI x Pre . . . . . . . . . . . . .     .   .   .   .   .   .   .   .   .   .   .   .   .   .   .   .   .   .   .   .   .   .   .   21
4.1.2.2   Dollar x Pre . . . . . . . . . . . .   .   .   .   .   .   .   .   .   .   .   .   .   .   .   .   .   .   .   .   .   .   .   .   24
4.1.2.3   DI x Dollar . . . . . . . . . . . .    .   .   .   .   .   .   .   .   .   .   .   .   .   .   .   .   .   .   .   .   .   .   .   25
4.1.2.4   DI x IPCA . . . . . . . . . . . .      .   .   .   .   .   .   .   .   .   .   .   .   .   .   .   .   .   .   .   .   .   .   .   27
4.2       Methodology . . . . . . . . . .        .   .   .   .   .   .   .   .   .   .   .   .   .   .   .   .   .   .   .   .   .   .   .   28
4.2.1     Estimations . . . . . . . . . . .      .   .   .   .   .   .   .   .   .   .   .   .   .   .   .   .   .   .   .   .   .   .   .   29
4.2.2     Parametric . . . . . . . . . . .       .   .   .   .   .   .   .   .   .   .   .   .   .   .   .   .   .   .   .   .   .   .   .   33
4.2.3     Non-Parametric . . . . . . . . .       .   .   .   .   .   .   .   .   .   .   .   .   .   .   .   .   .   .   .   .   .   .   .   36

5         RESULTS AND DISCUSSION                 .   .   .   .   .   .   .   .   .   .   .   .   .   .   .   .   .   .   .   .   .   .   .   40
5.1       Parametric Results . . . . . . .       .   .   .   .   .   .   .   .   .   .   .   .   .   .   .   .   .   .   .   .   .   .   .   40
5.2       Non Parametric . . . . . . . . .       .   .   .   .   .   .   .   .   .   .   .   .   .   .   .   .   .   .   .   .   .   .   .   43
5.3       About the Results . . . . . . . .      .   .   .   .   .   .   .   .   .   .   .   .   .   .   .   .   .   .   .   .   .   .   .   45

6         CONCLUSION . . . . . . . . . . . . . . . . . . . . . . . . . . . . . . . .                                                         46

          BIBLIOGRAPHY . . . . . . . . . . . . . . . . . . . . . . . . . . . . . .                                                           48
13
1 INTRODUCTION
Brazilian politics has been going through moments of instability during the last years.
Impeachment of a president, death of a presidential candidate, murder attempt of another, victory
of unorthodox candidates, to mention a few. Easy access to information and the spread of fake
news, that can affect even an election outcome, have given even more relevance to the media. It
is not unfrequent that financial market movements are associated by the media to news broadcast,
or even to social media posts from a public figure. There are studies in several coutries checking
for correlation between a new information disclosure and markets fluctuation such as inflation
and stocks and commodities prices. In Brazil, there is still little study on this matter.
The main objective of this paper is to test semi-strong form Market Efficiency Hypothesys
(FAMA, 1970) by checking the effect of political related news on the four most negotiated swap
contracts of the brazilian stock exchange, DI x Pre, Dollar x Pre, DI x Dollar and DI x IPCA. A
secondary goal is to verify how much each of them are affected and which types of news are
most related to price variations.
For that, we follow Marques e Santos (2016) methods, by applying a GARCH (BOLLER-
SLEV, 1986) filter on data collected from B3, ”Brasil Bolsa Balcão”, Brazil’s stock exchange,
website to find the periods of abnormal volatility in both a parametric and non-parametric analy-
sis. We also collected news headlines from a 40-month period by web scraping one of the main
news websites, and filtered the results by using selected keywords. Finally, we compare the days
of abnormal volatility with the headlines, to check if moments of high volatility are related to
political events.
This paper is organized as follows: Chapter 2 gives a brief introduction of the Brazilian
Financial System, brazilian interest rates and the swap contracts definitions. Chapter 3 is a
review of literature related to market efficiency, effect of announcements on markets, and studies
that relate swap contracts to the brazilian yield curve. Chapter 4 describes the methods of data
collection and application of the models. Chapter 5 shows the results and Chapter 6 some
concluding remarks.2 BRAZILIAN MARKETS AND THE INTEREST RATE
2.1 BRAZILIAN FINANCIAL SYSTEM
Cavalcante (2002) defined the brazilian financial system as a set of institutions that
intermediates transfers between buyers and sellers and creates the conditions for market liquidity.
Since the banking sector reform in 1964, the brazilian banking laws have been improved, after
the creation of two new monetary institutions, the National Monetary Council and the Central
Bank of Brazil, and the establishment of new forms of organization and hierarchy of public and
private financial institutions. (SILVA et al., 2016).
According to Berquó (2006), The National Monetary Council (CMN) is a regulative
organization responsible for defining general guidelines in the financial sector, supervise and
discipline financial institutions, and altering monetary and exchange rates policies. The Central
Bank of Brazil follows the standards of other central banks, is the executive organization that
executes the council regulations, and is the only responsible for the printing of money. Since
2019, the National Monetary Council members are the Minister of the Economy, the president of
Central Bank of Brazil, and the Special Secretary of Treasury.
The current composition of the financial system consists of the regulatory subsystem,
CMN, Central Bank and the Securities Commission, and the financial intermediation subsystem,
which is divided by banking institutions, such as commercial banks, and non-banking institutions,
such as development banks, investment banks, credit and finance societies, and the stock market
institutions, among others.(BERQUÓ, 2006)
Table 1 – National Financial System
Currency, Credit, Capital, Currency Exchange Private Insurance Closed Pension
National Private National Supplementary
Regulating Entities National Monetary Council
Insurance Council Pension Council
Superintendence of National Superintendence of
Supervising Entities Central Bank of Brazil Securities Commission
Private Insurance Supplementary Pension
Banks, saving banks,
Insurance companies,
credit cooperatives, Stocks, commodities Closed entities of
Operators open pension entities,
payment institutions, and futures exchanges supplementary pension
capitalization companies
other non banking institutions
Source – Author, based on (Central Bank of Brazil, 2020)
In 1976 was created the Securities Commission, responsible for the stock market and its
institutions, and in 1996 the Economic Policy Committee (COPOM), that provides the guidelines
of behavior for the interest rates in the monetary market, setting targets compatible with the
economic policies.15
2.2 INTEREST RATES AND ITS DERIVATIVES
Since 1999, Brazil is under an inflation targeting regimen, a policy widely accepted by
many theoretical macroeconomists and adopted by many countries, including the United States,
in 2012. In Brazil, the National Monetary Council sets the inflation target two years in advance.
The interest rate is one of the most important policies used by the monetary authorities
to control inflation and hit inflation targets. In Brazil, the main rate is the banking reserves
market interest rate, the Selic Rate, which is a short term nominal rate that strongly influences
the behavior of the price levels and economic activity, and is used to determine the other
rates (MENDONÇA; DEZORDI; CURADO, 2005). Since its creation, the Economic Policy
Committee is responsible for the Selic Rate, and after 1999 its main goal is to maintain inflation
under control, inside the target levels defined by CMN. COPOM meetings happen every 45
days and its decisions and announcements are closely watched by several institutions, financial
analysts and academics trying to understand and foresee possible future movements of the
interest rates (CAETANO; JR; CORRÊA, 2011). Studies and predictions like those allow the
existence of a futures market for the interest rates, on the premise that the cost of money can be
treated like any other commodity (BESSADA, 1995).
As mentioned, Selic Rate is used to determine other interest rates. One of those is the
DI-over rate, the base rate of the private bonds issued between banks in order to raise funds and
resources among them, similar to the effective federal funds rate of the United States. These
lending and borrowing are the interbank deposits, or DI. DI-over represents the interest for very
short term loans between banks. The Brazilian stock exchange, B3, manages several futures
markets, including DI Futures, which offers hedge against the interest rates risks.
In addition to the short term interbank deposits, there are the swaps contracts, which
are risk exchange contracts with no need of principal transfers, and the only cash flow is the
difference of profitability between the two products. Some of the main swap contracts in Brazil
are the DI x Pre (DI by Pre), a derivative with a prefixed interest rate for a certain period
discounted by the DI profitability, DI X Dollar and Pre x Dollar, to hedge interests against an
exchange rate variation, DI x IPCA, a price index for monetary correction, among others.
2.3 SWAP CONTRACTS
(HULL, 2015) reports statistics produced by the Bank for International Settlements show
that over 60% of all over-the-counter derivatives are interest rate swaps and currency swaps. As
stated by Hull:
A swap is an over-the-counter agreement between two companies to exchange
cash flows in the future. The agreement defines the dates when the cash flows
are to be paid and the way in which they are to be calculated. Usually the
calculation of the cash flows involves the future value of an interest rate, an
exchange rate, or other market variable. (Hull, 2015, p. 152)16
In addition, (HULL, 2015) puts a risk-free discount rate for cash flows is required to
valuate swap contracts. In Brazil, the traditional risk-free discount rate is the DI-Over, the
interbank deposits rate. Regarding interest rate swaps, Hull states:
In an interest rate swap, one company agrees to pay to another company cash
flows equal to interest at a predetermined fixed rate on a notional principal for
a predetermined number of years. In return, it receives interest at a floating
rate on the same notional principal for the same period of time from the other
company. (Hull, 2015, p.153)
In Brazil, futures are negotiated at B3, former BM&F Bovespa. B3 offers several products
of fixed and variable income, like stocks, commodities, interest rate coupons, exchanges and
swaps, among others.
B3 (2020a) describes its swap contracts as operations that realize cash flow swaps based
on comparison of profitability between two indexes, where the market agents enter a buying
position and a selling position. The value of the operation can be adjusted by several indexes,
such as inflation indexes (IPCA and IGP-M); stock indexes such as Ibovespa; interest rate indexes
like DI, Selic, Prefixed; or exchange rate (Dollar, Euro, Iene).
According to B3 (2020b), the swap contracts with higher liquidity and higher number of
open contracts are: Dollar x Pre (Exchange rate variation by the prefixed interest rate), DI x Pre
(interbank deposits by a prefixed interest rate), DI x Dollar, and DI x IPCA (interbank deposits
by the broad consumer price index).
The maturity of a swap contract is freely defined by the parts, and its range can vary
from one day to over thirty years, with higher liquidity on medium terms like 1 month, 3 months,
6 months, and one year. Each parameter of the contract has its own value updating formula,
according to B3 (2020c) Formula Notebook. DI is a function of the DI-Over rate for the period,
Pre is a function of a preset interest rate, Dollar uses the variation of the exchange rate US
Dollar to brazilian Real, and IPCA uses the variation of the main price index used to measure
the country’s inflation. All of them also affected by an interest rate.17
3 LITERATURE REVIEW
3.1 EFFICIENT MARKETS HYPOTHESIS
Eugene Fama (1965) addressed the recurring issue of market efficiency on the stock
markets. Fama compared technical analysis theories - which assume that past price behavior of a
security is a relevant information for its future price and that former movement patterns have
effects on future movements - with random walk theories, that suggest that future prices are as
predictable as a series of random numbers, and successive price variations are independent from
each other. His empirical results are favorable to the latter, and prices would not carry ”memory”
from past values. The random walk independence presumption is based on the following: if new
pieces of information appear independently through time, and the noise and uncertainty of these
new information do not follow a consistent pattern, the prices would also be independent. Fama
suggests that even if a set of new information is dependent of another, and that even if some of
the news agents are opinion leaders, the more sophisticated market agents are able to adjust and
react correctly to these noises.
In theoretical terms, Samuelson (1965) demonstrates asset prices goes as a random walk.
Samuelson focused on commodities and futures markets, and reproduces some examples in
favor and against the model, such as the long uptrend in the stock market, and seasonal prices of
commodities, but, on the other hand, several price series behave like random walks. There would
exist so many sources of really low importance that the result would be similar to a random
walk. He concludes by suggesting a stochastic model for price behavior, aiming to deduce a
theorem that demonstrates that price fluctuation between two time periods is not correlated with
the fluctuation of two previous time periods.
Fama et al. (1969) extended his studies by examining the process of how securities prices
adjust to specific kinds of new information, and the speed these changes would occur, on the
premise that asset prices reflect all available information. Fama evaluated if different stock splits
of different companies caused similar reaction on prices, and concluded that markets would
be efficient and adjust very quickly to the respective split announcement, even though price
fluctuations were of relatively low intensity and not sufficient to increase returns, except on
privileged information cases. The following year, Fama (1970) reviewed a series of theoretical
and empirical papers related to the efficient market hypotheses. In general terms, the prices
would be all the information needed for an asset allocation decision, since an efficient market is
a market where prices reflect all available information. Fama divides market efficiency into three
subsets: weak form efficiency, where the only information is the historical price, semi-strong
form, where the information set is all the information available for the public, and strong form
efficiency, where all information is available for everyone, including private information.18
One of Fama’s study objects was Waud (1970). Waud studied the psychological effect
of the impact of announcements on the future of the economy, in an attempt to identify how
much these announcements affect the expectations of companies, financial institutions and other
agents. On the premise that future changes on the company cash flows would be affected by
expectations on future economic conditions, and this would influence present stock prices. His
analysis suggests that there is an ”announcement effect” on future expectations associated to
Federal Reserve Board announces of changes in the base interest rate, and markets reflect with
”anxiety” during the days that precede the announcement of a reduction of the base interest rate.
3.2 EFFECTS OF NEWS AND ANNOUNCEMENTS ON MARKETS
There is a vast and relevant literature analyzing effects of news announcements on
different markets. Pearce e Roley (1984) accompanied Fama and Waud on stock prices and
information incorporation to prices, exploring the effect that announcements regarding interest
rates, money supply, and inflation rates have on the stock market. Using data from S&P500 index
and Federal Reserve pronouncements, their empirical studies and field research indicated that
only really unexpected news had effects on returns, and even then, it would only be relevant on
the day of the announcement, with a very weak correlation on subsequent days market behavior.
Interest rates and market reaction were also explored by Jovanovic e Zimmermann
(2008), who investigated monetary policies in moments of market uncertainty. Using historical
data of american interest rates, they applied gaussian models and GARCH models estimations
to demonstrate that Federal Reserve interest rates should be significantly lower at moments of
uncertainty in the stock market, if compared to stable moments. Smales (2015) measured market
volatility in moments of electoral uncertainty in the australian financial markets, and according
to his results, when economic agents cannot predict a winner with relative conviction, market
volatility increases. According to Moussa, Delhoumi e Ouda (2017), alterations on supply and
demand for information about a certain company also have an impact on the company’s stock
volatility, although it does not really have an effect on that stock’s returns, and results may vary
according to market characteristics, available information, and risk aversion.
McQueen e Roley (1993) checked how much the state of the economy is affects the effect
of an announcement on stock prices, interest rates and expected cash flows. Using S&P500 data
and industrial production index, his conclusions are similar to other works, that the announcement
has to be unexpected to have a real effect. Also, when the economy is strong, the market reacts
negatively to reports of increases in economic activity, because expected increases on cash flows
would increase interest rates. In contrast, in a weak economy, an optimistic announcement would
increase the stock price.
Macroeconomic news and commodities returns were the objects of study of Capo-
rale, Spagnolo e Spagnolo (2017), where they checked the existence of a correlation between
macroeconomic announcements and anomalous price movements in most commodities, such as19
soybeans, oil, wheat, corn. The paper suggests that the 2008 financial crisis strengthened this
correlation, and the main exceptions for this correlation were gold and silver.
Also in recent years, Marques e Santos (2016) analyzed the effect of political news on
Brazilan stock markets, comparing unusual movements on prices with dates of news related
to political events, using parametric and non-parametric methods. The results were in line
with previous studies, and demonstrated that electoral uncertainty increases volatility, but only
surprising or extremely important news had a pertinent effect on asset prices.
3.3 SWAPS
Mario Pina (2009) defines swap as an exchange of prices, indexes, or rates. If a company
borrows money at a certain post-fixed interest rate, it can enter a swap operation to reduce the risk
of interest rate variation. According to Pina, the major advantage of a swap is that the only cash
flow is the difference of ending prices or rates, and usually the total cash values of the operations
are used only as reference values. In addition to this reduced cash flow, the other important aspect
of swap contracts that boosted the volume growth of this kind of operation are the possible gains
resulting from comparative advantages, by allowing the banks and companies different options
of lending and borrowing money, by swapping interest rates between companies.
Ribeiro, Machado e Júnior (2013) studied the effect of swap operations on the value
of Brazilian firms, but the importance of swap contracts market goes beyond hedging and
comparative advantages. Many Brazilian studies and models about the term structure of interest
rates, or yield curve, utilize DI x Pre swaps data. The term structure of interest rates illustrates
the behavior of the market supply and demand of short and long term bonds. It represents the
relation between different maturities interest rates for a certain moment in time (SHOUSHA,
2008). Fraletti (2004) affirms that implied rates of CDI-Over derivatives should be used to model
Brazil’s yield curve, because of the low risk associated do this curve. Laurini e Moura (2010),
Novy (2000) and Rezende (2008) used swap data to test different existent yield curve models,
and swap DI x Pre data was used in Tabata e Tabak (2004) and Nunes, Holland e Silva (2011)
models of the yield curve to test the effects of monetary policies, specifically, basic interest rate
(Selic) adjustments, on the yield curve.20
4 DATA AND METHODOLOGY
In order to analyze the effect of news on swap contracts markets in Brazil, we followed a
similar approach to that of Marques e Santos (2016), by developing a web scraping software
to navigate one of the main Brazilian news website, G1, and gather the main headlines of each
business day. A similar software was developed to collect market data from B3 referential rates
of the four main swap contracts (DI x Pre, DI x Dollar, DI x IPCA, Dollar x Pre) negotiated for
different maturities. The time period is defined by the availability of news headlines from G1
website, that starts on February 1st , 2017, and ends on October 2nd , 2020. All codes available on
https://github.com/mauriciormendes/political-news-and-swap-markets
We then test the collected data for stationarity with an Augmented Dickey-Fuller (ADF)
test (DICKEY; FULLER, 1979) and a KPSS test (KWIATKOWSKI et al., 1992). In the stationary
data we can apply a GARCH model (BOLLERSLEV, 1986) to collect the standardized residuals
and conditional volatility. To confirm that the data is suitable for this model, a Ljung-Box test
(LJUNG; BOX, 1978) is applied to the residuals to check if they behave as white noise. In the
positive cases, we extract the Conditional Standard Deviation of each time series. We then make
both a parametric and a non-parametric analysis to check the moments of abnormal volatility.
Finally, we compare the days of abnormal volatility with the political news related to these days.
4.1 DATA
4.1.1 News Source
The source of news selected was G1, the news portal of Grupo Globo, Brazil’s biggest
media and communications conglomerate. The web scraping was done on G1 Summary of the
day page, which links to synopsis of important news from each business day. The scraper then
access the daily synopsis and stores that day’s main headlines in a csv archive. This resulted on a
sample of headlines from 819 days.
In order to filter the headlines we follow an approach similar to the one taken by Baker,
Bloom e Davis (2016), where they developed an index to measure economic policy uncertainty
by checking the occurrence of a set of keywords on newspapers articles. We search our headlines
for one of the following keywords: ”mercado”, ”economia”, ”incerteza”, related to markets,
economy and uncertainty, ”dólar”, ”Selic”, ”taxa básica de juros”, related to the exchange rate
and basic interest rate, ”presidente”, ”Bolsonaro”, ”Temer”, current and former presidents, and
”Câmara”, ”Senado”, ”STF” and ”Supremo Tribunal Federal”, related to the chamber of deputies,
senate and the supreme court. With this filter we ended with headlines from 581 days.21
Table 2 – News Sample
Date Headline
1 2020-10-02 Após meses minimizando os riscos da Covid, Trump anuncia que está com o novo...
2 2020-10-01 Bolsonaro escolhe o desembargador Kassio Nunes Marques para a vaga no STF...
3 2020-09-30 Guedes diz agora que o governo não vai usar o dinheiro do pagamento de dı́vidas para...
[...]
817 2017-05-04 No mesmo dia em que um governador teve sua cassação mantida, o STF entendeu...
818 2017-05-03 José Dirceu foi solto. Após colocar a tornozeleira eletrônica, o ex-ministro da Casa...
819 2017-04-28 A sexta foi praticamente tomada no paı́s pelas paralisações e protestos contra as reformas...
Source – Author
4.1.2 Swap Reference Rates
Swap rates historical data was collected from B3 (2020d) Reference Rates website. Since
the available data informs only one day of reference rates for one of the swap products at a time,
another software was developed to navigate through the pages, and collect and store data in a
format that allowed it to be handled correctly.
The four products with higher volatility were selected: DI x Pre, Dollar x Pre, DI x
Dollar, and DI x IPCA. The time period covered is the same as the news available, from February
1st , 2017, to October 2nd , 2020. We selected the maturities used by Tabata e Tabak (2004) and
Nunes, Holland e Silva (2011) for each product, 1, 2, 3, 6 and 12 months, since the liquidity is
reduced for longer terms.
4.1.2.1 DI x Pre
Figure 1 shows B3 daily reference rates historical data for DI x Pre swaps for 1, 2, 3, 6
and 12 months, in the aforementioned period, February 2017 to October 2020. The behavior is
similar in all maturities, showing a downtrend that closely resembles Brazil’s basic interest rate,
Selic, historical data for the same period, seen in Figure 2.22
Figure 1 – DI x Pre swaps reference rates for different maturities
Source: Author
Table 3 – Descriptive Statistics for Swap DI x Pre
Maturity Mean Standard Deviation Minimum Value Maximum Value
30 days 6.344 2.457 1.89 12.43
60 days 6.259 2.395 1.88 12.43
90 days 6.202 2.340 1.87 12.23
180 days 6.114 2.201 1.86 11.57
360 days 6.227 2.046 2.23 10.74
Since the series clearly shows a deterministic trend, we will use its daily variation.
Figure 3 shows the behavior of the daily variation.
The movements are very similar and appear to show stationary forms. We applied both an
Augmented Dickey-Fuller (ADF) test (DICKEY; FULLER, 1979) and a Kwiatkowski-Phillips-
Schmidt-Shin (KPSS) test (KWIATKOWSKI et al., 1992) to confirm this hypothesis. ADF-Test
suggests stationarity in all of them. Results on Table 4 and Table 5.23
Figure 2 – Selic Rate
Source: Banco Central do Brasil
Figure 3 – DI x Pre daily variation
Source: Author24
Table 4 – ADF test for DI x Pre Variation data
Maturity ADF statistic p-value Critical Values H0 Result
30 days -4.686540 0.000089 Rejected
60 days -4.083119 0.001033 1%: -3.435 Rejected
90 days -5.667589 0.000001 5%: -2.864 Rejected
180 days -5.325151 0.000005 10%: -2.568 Rejected
360 days -24.90912 0.000000 Rejected
Table 5 – KPSS test for DI x Pre Variation data
Maturity KPSS statistic p-value Critical Values H0 Result
30 days 0.88354 0.01 10%: 0.347 Not Rejected
60 days 0.77666 0.01 5%: 0.463 Not Rejected
90 days 0.30608 0.1 2.5% : 0.574 Rejected
180 days 0.60815 0.02 1%: 0.739 Rejected
360 days 0.14267 0.1 Rejected
4.1.2.2 Dollar x Pre
Figure 4 shows B3 reference rates for Dollar x Pre swaps:
Figure 4 – Dollar x Pre swaps reference rates for different maturities
Source: Author25
Table 6 – Descriptive Statistics for Swap Dollar x Pre
Maturity Mean Standard Deviation Minimum Value Maximum Value
30 days 4.207 43.024 -33.37 100.34
60 days 4.271 7.301 -24.02 67.38
90 days 3.535 5.077 -15.55 43.53
180 days 3.403 3.341 -7.00 24.38
360 days 3.332 2.014 -2.22 9.43
The rates for shorter terms appear to show stationary forms. We applied both an Aug-
mented Dickey-Fuller (ADF) test and a Kwiatkowski-Phillips-Schmidt-Shin (KPSS) to confirm
this hypothesis. Results in Table 7 and Table 8:
Table 7 – ADF test for Dollar x Pre swap data
Maturity ADF statistic p-value Critical Values H0 Result
30 days -10.271773 0.000000 Rejected
60 days -10.120096 0.000000 1%: -3.435 Rejected
90 days -8.134470 0.000000 5%: -2.864 Rejected
180 days -4.658551 0.000101 10%: -2.568 Rejected
360 days -2.721334 0.070419 Not Rejected
Table 8 – KPSS test for Dollar x Pre swap data
Maturity KPSS statistic p-value Critical Values H0 Result
30 days 0.28072 0.1 10%: 0.347 Not Rejected
60 days 1.09527 0.01 5%: 0.463 Rejected
90 days 2.65402 0.01 2.5% : 0.574 Rejected
180 days 3.45682 0.01 1%: 0.739 Rejected
360 days 4.42232 0.01 Rejected
The ADF test rejected the Null Hypothesis of unit root’s existence for most maturities,
which suggests stationarity except for the 1 year swaps. In the KPSS test, the rejection of the
Null Hypothesis suggests that the series is non stationary, and the results show that the only
stationary series would be the 30 days one.
4.1.2.3 DI x Dollar
Figure 5 shows DI x Dollar data. The rates also appear stationary and the same tests were
applied. Table 10 and Table 11 show that the results are similar with the ones from Dollar x Pre
swaps, ADF suggests that the only non stationary is the 1 year series, KPSS suggests the only
stationary is the 30 days series.26
Figure 5 – DI x Dollar swaps reference rates for different maturities
Source: Author
Table 9 – Descriptive Statistics for Swap DI x Dollar
Maturity Mean Standard Deviation Minimum Value Maximum Value
30 days 2.845 12.519 -64.08 44.94
60 days 2.097 6.713 -39.08 34.89
90 days 2.609 4.571 -25.34 24.59
180 days 2.592 2.648 -11.54 14.51
360 days 2.757 1.399 -3.49 9.74
Table 10 – ADF test for DI x Dollar swap data
Maturity ADF statistic p-value Critical Values H0 Result
30 days -10.09908 0.000000 Rejected
60 days -10.53602 0.000000 1%: -3.435 Rejected
90 days -10.52686 0.000000 5%: -2.864 Rejected
180 days -8.59831 0.000000 10%: -2.568 Rejected
360 days -3.036820 0.0031596 Not Rejected27
Table 11 – KPSS test for DI x Dollar swap data
Maturity KPSS statistic p-value Critical Values H0 Result
30 days 0.13049 0.1 10%: 0.347 Not Rejected
60 days 0.78092 0.01 5%: 0.463 Rejected
90 days 0.73601 0.01 2.5% : 0.574 Rejected
180 days 0.88959 0.01 1%: 0.739 Rejected
360 days 1.40775 0.01 Rejected
4.1.2.4 DI x IPCA
Finally, Figure 6 shows DI x IPCA data, which shows a gradually more visible and less
volatile downtrend as the maturities are increased. ADF suggests 30 days is stationary.
Figure 6 – DI x IPCA swaps reference rates for different maturities
Source: Author28
Table 12 – Descriptive Statistics for Swap DI x IPCA
Maturity Mean Standard Deviation Minimum Value Maximum Value
30 days 3.060 3.616 -7.73 12.72
60 days 2.972 3.080 -6.37 10.00
90 days 2.807 2.677 -3.31 10.22
180 days 2.545 2.099 -3.08 7.52
360 days 2.448 1.578 -1.38 6.41
Table 13 – ADF test for DI x IPCA variation data
Maturity ADF statistic p-value Critical Values H0 Result
30 days -4.376761 0.000326 Rejected
60 days -2.397258 0.142512 1%: -3.435 Not Rejected
90 days -1.979176 0.295778 5%: -2.864 Not Rejected
180 days -1.47994 0.543408 10%: -2.568 Not Rejected
360 days -1.256317 0.648913 Not Rejected
Table 14 – KPSS test for DI x IPCA swap data
Maturity KPSS statistic p-value Critical Values H0 Result
30 days 1.54021 0.01 10%: 0.347 Rejected
60 days 1.68419 0.01 5%: 0.463 Rejected
90 days 1.96193 0.01 2.5% : 0.574 Rejected
180 days 2.86367 0.01 1%: 0.739 Rejected
360 days 4.04005 0.01 Rejected
4.2 METHODOLOGY
We use a GARCH (BOLLERSLEV, 1986) model on the selected series to estimate
normal and abnormal volatility by using the Conditional Standard Deviation (CSD) extracted
from the GARCH. For this model to be suitable, the series residuals must behave like white
noise. A Ljung-Box test (LJUNG; BOX, 1978) is applied to check the characteristics of the data
series.
Next, we make both a parametric and a non-parametric analysis. In the parametric, we
utilize a Shapiro-Wilk test (SHAPIRO; WILK, 1965) to test the residuals for normality, then
we can find parametric limits for these residuals, that will show abnormal volatility. In the non-
parametric approach, we will examine the CSD percentiles to find possible abnormal volatility
points.
Finally, we find the dates of those abnormal movements and check the relevant news of
the days before this movement.29
4.2.1 Estimations
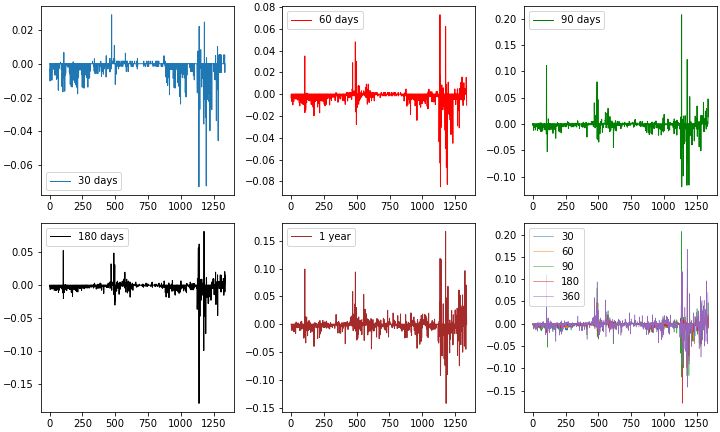
We apply a GARCH model to all stationary series for each maturity. Figure 7 shows
GARCH results for the 30 days series of DI x Pre variations, Dollar x Pre, DI x Dollar and Dollar
x IPCA.
Figure 7 – GARCH for 30 days series
Source: Author
For 60, 90 and 180 days we will not check DI x IPCA since it did not behave as stationary.
Figure 8, Figure 9 and Figure 10 shows GARCH results for 60, 90 and 180 days.
We then apply a Ljung-Box test on the residuals to check if it behaves as white noise.
Results in Table 15.
Table 15 – Ljung-Box p-values
DI x Pre Variation Dollar x Pre DI x Dollar DI x IPCA
30 days 6.39E-05 4.01E-139 6.68E-148 6.07E-274
60 days 4.94E-08 1.99E-116 6.04E-122
90 days 4.80E-06 1.02E-144 3.29E-102
180 days 1.05E-03 1.23E-200 1.81E-166
360 days 0.52530
Figure 8 – GARCH for 60 days series
Source: Author
Figure 9 – GARCH for 90 days series
Source: Author
Figure 10 – GARCH for 180 days series
Source: Author
All series accepted so far except the DI x Pre Variation 360 days series reject the null
hypothesis and can therefore be assumed as white noise behavior. The Shapiro-Wilk test rejected
the hypothesis of normality for all series.
We can then extract the Conditional Standard Deviation (CSD) for the series that behave
like white noise. CSD will be used as an estimate for the standard deviation of each period.31
Table 16 – Shapiro-Wilk Results
DI x Pre Variation Dollar x Pre DI x Dollar DI x IPCA
statistic p-value statistic p-value statistic p-value statistic p-value
30 days 0.912 3.781e-27 0.855 2.431e-33 0.854 1.883e-33 0.958 4.923e-19
60 days 0.758 1.834e-40 0.758 2.021e-40 0.798 7.785e-38
90 days 0.707 2.77e-43 0.840 1.297e-34 0.822 4.344e-36
180 days 0.708 3.23e-43 0.854 2.053e-33 0.803 1.625e-37
Figures 11 to 14 show CSD for each series for 30, 60, 90 and 180 days.
Figure 11 – CSD for 30 days series
Source: Author
Table 17 – Descriptive Statistics for 30 days CSD
Series Mean Standard Deviation Min Value Max Value
DI x Pre Variation 0.5988 0.2429 0.2826 1.4261
Dollar x Pre 3.2728 0.8639 2.3809 8.9683
DI x Dollar 3.2147 0.7972 2.3682 7.2623
DI x IPCA 1.6009 0.6109 0.7023 3.2411
Figure 12 – CSD for 60 days series
Source: Author32
Table 18 – Descriptive Statistics for 60 days CSD
Series Mean Standard Deviation Min Value Max Value
DI x Pre Variation 0.6925 0.2524 0.4735 1.7342
Dollar x Pre 2.5119 0.5104 2.0922 7.0719
DI x Dollar 2.3551 0.5821 1.8446 6.0098
Figure 13 – CSD for 90 days series
Source: Author
Table 19 – Descriptive Statistics for 90 days CSD
Series Mean Standard Deviation Min Value Max Value
DI x Pre Variation 0.8911 0.3407 0.6003 2.7132
Dollar x Pre 2.0955 0.4507 1.6405 5.5002
DI x Dollar 1.9666 0.4679 1.5089 4.8116
Figure 14 – CSD for 180 days series
Source: Author
Table 20 – Descriptive Statistics for 180 days CSD
Series Mean Standard Deviation Min Value Max Value
DI x Pre Variation 0.7078 0.3019 0.4637 2.4122
Dollar x Pre 1.5958 0.4794 1.0939 4.5037
DI x Dollar 1.4326 0.4071 1.0614 3.631633
4.2.2 Parametric
For the parametric analysis, we assumed abnormal volatility as any value over or under
two standard deviations:
U pperLimit = mean + 2 ∗ (StandardDeviation)
LowerLimit = mean − 2 ∗ (StandardDeviation)
Horizontal lines on Figure 15 show the mean and upper and lower limits for DI x Pre
variation CSD. Table 21 describes those limits and the number of occurrences outside the interval:
Figure 15 – Parametric limits for DI x Pre Variation CSD
Source: Author
Table 21 – Limits for DI x Pre Variation CSD
Upper Lower Occurrences out of interval
30 days 1.0846 0.1129 96
60 days 1.1972 0.1879 96
90 days 1.5725 0.2097 79
180 days 1.3118 0.1038 66
Swap DI x Pre Variation for 30 and 60 days maturities have two clear periods of abnormal
volatility, March 17 to April 7 and April 23 to August 14, all in 2020. The longer maturities
show, besides the aforementioned time frames, abnormal volatility in two other moments, May34
17 to May 29 in 2017, June 08 to June 16 in 2018. The four maturities share 56 days of abnormal
volatility.
The same is applied to Dollar x Pre CSD and DI x Dollar CSD, on Figure 16 and
Figure 17, and Table 22 , and Table 23. Dollar x Pre and DI x Dollar share 9 and 10 days of
abnormal volatility in all four maturities, respectively, all in 2020.
Figure 16 – Parametric limits for Dollar x Pre CSD
Source: Author
Table 22 – Limits for Dollar x Pre CSD
Upper Lower Occurrences out of interval
30 days 5.0007 0.2097 83
60 days 3.5326 1.4911 63
90 days 2.9968 1.1941 78
90 days 2.5545 0.6369 57
Table 23 – Limits for DI x Dollar CSD
Upper Lower Occurrences out of interval
30 days 4.8092 1.6203 80
60 days 3.5192 1.1909 56
90 days 2.9024 1.0309 63
180 days 2.2468 0.6185 5935
Figure 17 – Parametric limits for DI x Dollar CSD
Source: Author
Figure 18 – Parametric limits for DI x IPCA CSD
Source: Author
Table 24 – Limits for DI x IPCA CSD
Upper Lower Occurrences out of interval
30 days 2.8228 0.3790 6336
Figure 16 shows Dollar x Pre, where it shows short peaks of volatility that started on
April 7 2017, May 19 2017, March 29 2019, and other periods that are shared with DI x Dollar
moments of abnormal volatility, as seen on Table 25. Also, 60, 90 and 180 maturities had similar
behavior among them.
Table 25 – Abnormal volatility periods in Dollar x Pre and DI x Dollar
30 days 60, 90 and 180 days
2018/06/28 to 2018/07/02 2017/02/20 to 2017/03/03 (dol x pre)
2018/09/28 to 2018/10/09 2017/04/07 to 2017/04/12 (dol x pre)
2018/11/27 2017/05/09 to 2017/05/24
2019/03/29 to 2019/04/2 2018/06/09 to 2018/07/23
2020/03/17 to 2020/24/03 2018/09/01 to 2018/10/11
2020/04/24 to 2020/05/14 2020/03/16 to 2020/09/02
2020/05/27
2020/06/03 to 2020/09/28
DI x IPCA on Figure 18 shows two periods of abnormal volatility, June 14 2017 to July
10 2017 and December 16 2019 to March 01 2020.
4.2.3 Non-Parametric
For the Non-Parametric approach, we will consider abnormal volatility everything above
the95thpercentile of the Conditional Standard Deviation of each series. This gives us 67 days of
abnormal volatility for each maturity of each contract.
Figure 19 shows the upper limits for DI x Pre Variation CSD. DI x Pre variation for 30
and 60 days shows abnormal volatility from March 13 2020 to April 08 2020 and from April
24 2020 to June 26 2020. For 90 and 180 days there is abnormal volatility from May 19 2017
to May 27 2017, June 08 2018, March 13 2020 to April 15 2020 and April 24 2020 to May 23
2020.
Table 26 – Non Parametric Limits for DI x Pre CSD Variation
Upper Limit
30 days 1.1476
60 days 1.2977
90 days 1.6640
180 days 1.3047
Dollar x Pre and DI x Dollar also share most of its abnormal volatility days. Seen on
Figure 20. Also, 60, 90 and 180 maturities have similar behavior among them. Table 30 compiles
the time periods of abnormal behavior.
DI x IPCA on Figure 22 shows the following periods of abnormal volatility: June 14
2017 to July 16 2017, December 17 2019 to January 13 2020, July 15 2020 and August 13 2020
to August 17 2020.37
Figure 19 – Non Parametric limits for DI x Pre Variation CSD
Source: Author
Table 27 – Non Parametric Limits for Dollar x Pre CSD
Upper Limit
30 days 5.1459
60 days 3.4998
90 days 3.0832
180 days 2.4938
Table 28 – Non Parametric Limits for DI x Dollar CSD
Upper Limit
30 days 5.068
60 days 3.4157
90 days 2.8909
180 days 2.1879
Table 29 – Non Parametric Limits for DI x IPCA CSD
Upper
30 days 2.631938
Figure 20 – Non Parametric limits for Dollar x Pre CSD
Source: Author
Table 30 – Non Parametric Abnormal volatility DI x Pre and DI x Dollar
30 days 60, 90 and 180 days
2018/06/28 to 2018/07/02 2017/02/20 to 2017/03/03 (Dol x Pre)
2018/10/04 to 2018/10/09 2017/04/07 to 2017/04/12 (Dol x Pre)
2018/11/27 2017/05/09 to 2017/05/25
2019/03/29 to 2019/04/02 2018/06/09 to 2018/06/13
2020/03/17 to 2020/03/24 2018/09/01 to 2018/09/06
2020/04/30 to 2020/05/18 2018/10/09 to 2018/10/10
2020/06/03 to 2020/09/28 2018/11/29
2020/03/16 to 2020/09/0239
Figure 21 – Non Parametric limits for DI x Dollar CSD
Source: Author
Figure 22 – Non Parametric limits for DI x IPCA CSD
Source: Author40
5 RESULTS AND DISCUSSION
After filtering the abnormal volatility periods, we can match the first day of each period
of abnormal volatility with the news headlines of these days.
5.1 PARAMETRIC RESULTS
Table 31 shows the relevant news from the first days of each period of abnormal volatility
on DI x Pre Variation.
Table 31 – Parametric DIxPre News
o dono do frigorı́fico JBS gravou Temer dando aval para comprar o silêncio de Eduardo Cunha
2017/05/17 na Operação Lava Jato e entregou o áudio em delação à Procuradoria-Geral da República (PGR).
É mais um grande abalo no terremoto polı́tico que o paı́s vive nos últimos anos.
Avança a investigação sobre a reforma da casa de Maristela Temer, filha do presidente. [...]
2018/06/8 A greve dos caminhoneiros continua na pauta do dia[...]
O dólar caiu após intervenção do BC e fechou a R$ 3,70.
2020-03-11 OMS declara pandemia de coronavı́rus
A 1a morte pelo novo coronavı́rus no Brasil. Mais de 8 mil casos suspeitos. [...]
2020-03-17
Todas as fronteiras fechadas na Europa. Um guia para o isolamento domiciliar [...]
O Brasil tem o maior número de mortes pelo novo coronavı́rus em um só dia. [...]
Bolsonaro anuncia intenção de trocar comando da Polı́cia Federal
2020/04/23
e ministro Sergio Moro ameaça pedir demissão.
E o dólar bate recorde mais uma vez.
2020-08-11 Ministro Paulo Guedes fala em debandada da equipe econômica
Table 32 shows the relevant news for Dollar x Pre and DI x Dollar first days of each
abnormal volatility period.
Table 33 shows the relevant news from the first day for each period of abnormal volatility
on DI x IPCA.41
Table 32 – Parametric Dollar x Pre and DI x Dollar News
Relatório da Polı́cia Federal concluiu que os ex-presidentes Dilma e Lula e o ex-ministro
2017/02/20 Aloizio Mercadante atuaram para obstruir as investigações da operação.[...]
A PF sugere que os três sejam denunciados por obstrução de Justiça. Eles negam as acusações.
O Tribunal Superior Eleitoral (TSE) decidiu reabrir a etapa de coleta de provas,
2017/04/04
deu mais prazo para as defesas e adiou o julgamento da chapa Dilma-Temer. [...]
O dono do frigorı́fico JBS gravou Temer dando aval para comprar o silêncio de Eduardo Cunha
2017/05/17 na Operação Lava Jato e entregou o áudio em delação à Procuradoria-Geral da República (PGR).
É mais um grande abalo no terremoto polı́tico que o paı́s vive nos últimos anos.
Avança a investigação sobre a reforma da casa de Maristela Temer, filha do presidente.[...]
2018/06/09 A greve dos caminhoneiros continua na pauta do dia[...]
O dólar caiu após intervenção do BC e fechou a R$ 3,70.
2018/06/28 No Brasil, Joesley Batista e o ex-procurador Marcello Miller viram réus por corrupção [...]
Eleições 2018: O TSE começou a decidir se Lula pode ou não ser candidato.[...]
Devagar, quase parando: a economia brasileira cresceu 0,2% no 2o trimestre do ano.[...]
2018/09/01
Entre os fatores para o PIB em marcha lenta, a greve dos caminhoneiros[...]
Enquanto isso, o dólar acumula alta de 8,5% no mês.
2018/09/28 Os novos números da corrida presidencial
Depois de ser preso e virar réu, Temer é denunciado mais uma vez. [...]
2019/03/29
Paulo Guedes vai ao Senado para defender a reforma da Previdência [...]
Maioria do STF vota a favor de tese que pode anular sentenças da Lava Jato.[...]
2019/09/28 O Congresso dos EUA divulga o conteúdo da denúncia que é estopim para o
processo de impeachment contra Trump.
Mais de 100 mil casos de coronavı́rus no mundo, 13 deles no Brasil. [...]
2020/03/06
Mais um dia de perdas na Bovespa e o dólar em queda pela 1a vez em 12 dias. [...]
2020/03/11 A OMS declara pandemia de coronavı́rus.
Casos de coronavı́rus no Brasil sobem para quase 300.
Europa e América do Sul fecham fronteiras.[...]
Trump admite possı́vel recessão nos EUA por causa da pandemia[...]
2020/03/16
Bolsonaro volta a falar em ’histeria’.
O dólar fecha acima de R$ 5 pela 1a vez, a bolsa desaba mais de 13%.
E o Ministério da Economia anuncia injeção de R$ 147,3 bi na economia.
2020/03/17 A 1a morte pelo novo coronavı́rus no Brasil. Mais de 8 mil casos suspeitos.[...]
Sergio Moro anunciou sua saı́da do Ministério da Justiça e acusou
2020/04/24 interferência polı́tica na Polı́cia Federal.[...]
No final da tarde foi a vez do presidente Jair Bolsonaro se pronunciar.[...]
Operação da PF mira polı́ticos, empresários, blogueiros e militantes bolsonaristas
2020/05/27 suspeitos de disseminação de fake news e ataques a instituições nas redes sociais.
Número de mortes pelo coronavı́rus passa de 25 mil no Brasil.
2020/07/21 Guedes entrega a 1a parte da reforma tributária ao Congresso
Bolsonaro interrompe as discussões sobre o substituto do Bolsa Famı́lia, critica
2020/08/26
publicamente a proposta e amplia o desgaste com o ministro Paulo Guedes.
Table 33 – Parametric DI x IPCA news
Eduardo Cunha (PMDB-RJ) prestou depoimento por cerca de 1h30 na sede da PF, em Curitiba.
2017/06/14
Ele falou no inquérito que investiga o presidente Michel Temer (PMDB).[...]
2019/12/16 Fabrı́cio Queiroz e parentes da ex-mulher do presidente Bolsonaro são alvos de operação do MP do RJ. [...]42
From the dates and headlines we can visualize defined periods and political moments
compiled on Table 34.
Table 34 – Political events from parametric results
February 2017 Former presidents Lula and Dilma Roussef accused of justice obstruction
April 2017 Investigations of current president Michel Temer
Former president Lula testimony
May 2017
New evidences of current president Michel Temer supposed corruption scandal
June 2017 Investigations of current president continue
June 2018 New investigations of president Temer
September 2018 Electoral Court decides if former president Lula can be a candidate
October 2018 Presidential elections
Former president Michel Temer is arrested
March 2019
New social security and retirement plans in discussion
March 2020 First cases and deaths of Covid-19 in Brazil.
April 2020 Minister of Justice Sergio Moro leaves government
July 2020 Tax reform advances
Permanence of Minister of Economy Paulo Guedes is uncertain
August 2020
Covid-19 reaches 100.000 deaths
The start of our sample in February 2017 shows abnormal volatility in Dollar x Pre longer
maturities, during investigations of former presidents Luiz Inacio ”Lula” da Silva and Dilma
Roussef on ”Lava Jato” operation, a set of investigations of brazilian Federal Police focused on
money laundering and political corruption.
On May 17 2017 during investigations of President Michel Temer, was exposed a conver-
sation of the president and Joesley Batista, CEO of JBS, one of the largest food companies of the
world. The content of the conversation suggested attempts to buy favors from other politicians
already in custody for results of operation ”Lava Jato”. The prospect of an impeachment shaked
almost all brazilian markets, including our objects of study for 60, 90 and 180 days maturities.
Also in May 2017, former president Lula started his testimonies to Judge Sergio Moro, and the
result of his trial could affect upcoming presidential election.
In June 2018 new investigations of president Michel Temer arised, but the main fact that
supposed affected the markets was the Truck Drivers Strike, that resulted in a shortage of fuel for
a short period of days. This month showed abnormal volatility on Dollar x Pre and DI x Dollar
swap contracts.
The same contracts saw volatility during September and October 2018, with the expecta-
tions and results of the presidential election, with the definition that former president Lula could
not be a candidate, and the election of Jair Bolsonaro, the right-wing candidate. Michel Temer
was arrested in March 2019, and Dollar x Pre and DI x Dollar showed a peak of volatility then.
March 2020 is when Covid-19 cases started being reported in Brazil, affecting all markets.
Longer terms saw high volatility starting on March 13, and short term (30 days) high volatilityYou can also read


