Distinct mechanisms govern populations of myeloid-derived suppressor cells in chronic viral infection and cancer
←
→
Page content transcription
If your browser does not render page correctly, please read the page content below
The Journal of Clinical Investigation                                                                                                                           RESEARCH ARTICLE

Distinct mechanisms govern populations of
myeloid-derived suppressor cells in chronic viral
infection and cancer
Evgenii N. Tcyganov,1 Shino Hanabuchi,2 Ayumi Hashimoto,1,2 David Campbell,2 Gozde Kar,3 Timothy W.F. Slidel,3
Corinne Cayatte,2 Aimee Landry,2 Fernanda Pilataxi,2 Susana Hayes,2 Brian Dougherty,2 Kristin C. Hicks,2 Kathy Mulgrew,2
Chih-Hang Anthony Tang,1 Chih-Chi Andrew Hu,1 Wei Guo,4 Sergei Grivennikov,4 Mohammed-Alkhatim A. Ali,5
Jean-Christophe Beltra,5,6,7 E. John Wherry,5,6,7 Yulia Nefedova,1 and Dmitry I. Gabrilovich2
Immunology, Microenvironment, and Metastasis Program, The Wistar Institute, Philadelphia, Pennsylvania, USA. 2AstraZeneca, Gaithersburg, Maryland, USA. 3AstraZeneca, Translational Medicine, Research
1

and Early Development, Oncology Research & Development, Cambridge, United Kingdom. 4Cancer Prevention and Control Program, Fox Chase Cancer Center, Philadelphia, Pennsylvania, USA. 5Department
of Systems Pharmacology and Translational Therapeutics and 6Institute for Immunology, Perelman School of Medicine, University of Pennsylvania, Philadelphia, Pennsylvania, USA. 7Parker Institute for
Cancer Immunotherapy at University of Pennsylvania, Philadelphia, Pennsylvania, USA.

             Myeloid-derived suppressor cells (MDSCs) are major negative regulators of immune responses in cancer and chronic
             infections. It remains unclear if regulation of MDSC activity in different conditions is controlled by similar mechanisms. We
             compared MDSCs in mice with cancer and lymphocytic choriomeningitis virus (LCMV) infection. Chronic LCMV infection
             caused the development of monocytic MDSCs (M-MDSCs) but did not induce polymorphonuclear MDSCs (PMN-MDSCs). In
             contrast, both MDSC populations were present in cancer models. An acquisition of immune-suppressive activity by PMN-
             MDSCs in cancer was controlled by IRE1α and ATF6 pathways of the endoplasmic reticulum (ER) stress response. Abrogation
             of PMN-MDSC activity by blockade of the ER stress response resulted in an increase in tumor-specific immune response and
             reduced tumor progression. In contrast, the ER stress response was dispensable for suppressive activity of M-MDSCs in cancer
             and LCMV infection. Acquisition of immune-suppressive activity by M-MDSCs in spleens was mediated by IFN-γ signaling.
             However, it was dispensable for suppressive activity of M-MDSCs in tumor tissues. Suppressive activity of M-MDSCs in
             tumors was retained due to the effect of IL-6 present at high concentrations in the tumor site. These results demonstrate
             disease- and population-specific mechanisms of MDSC accumulation and the need for targeting different pathways to achieve
             inactivation of these cells.

Introduction                                                                                            is established that expansion of immature myeloid cells is gov-
Myeloid-derived suppressor cells (MDSCs) with potent                                                    erned by increased production of different growth factors such as
immune-suppressive activity are widely implicated in negative                                           GM-CSF or M-CSF. However, the factors responsible for acquisi-
regulation of immune responses in many pathological conditions                                          tion of immune-suppressive activity by these cells remain largely
including cancer, chronic inflammation, infections, autoimmune                                          elusive. An understanding of these mechanisms would be import-
diseases, and others (1). Accumulation of MDSCs was directly                                            ant to develop selective targeting of MDSCs. The major character-
linked with a negative clinical outcome in cancer, as well as poor                                      istics of MDSCs in chronic infections and cancer are believed to
clearance of chronic infections and sepsis (2–5). Two large groups                                      be the same (1). However, whether mechanisms regulating MDSC
of MDSCs are currently recognized: pathologically activated                                             accumulation are shared between chronic infections and cancer
polymorphonuclear neutrophils (PMN-MDSCs) and patholog-                                                 remains unclear. By using different experimental models of viral
ically activated monocytes (M-MDSCs). Although MDSCs and                                                infection and cancer we sought to identify possible common
their classical counterparts, neutrophils (PMNs) and monocytes                                          mechanisms responsible for acquisition of immune-suppressive
(MONs), share many phenotypic and morphological character-                                              activity by MDSCs.
istics, they have distinct transcriptomic and proteomic profiles,                                            Previously, we and others have demonstrated that MDSCs, in
metabolism, biochemical features, and functions (1, 6–10). It                                           contrast to MONs or PMNs, displayed signs of endoplasmic retic-
                                                                                                        ulum (ER) stress (7, 11–13). The ER stress response, also known as
                                                                                                        the unfolded protein response (UPR), is a common mechanism
Conflict of interest: SH, AH, DC, GK, TWFS, CC, AL, FP, SH, BD, KCH, KM, and DIG are                    developed to protect cells from various conditions, including star-
employees of AstraZeneca.
                                                                                                        vation, viral infections, oxidative stress, and so on. Synthesis and
Copyright: © 2021, American Society for Clinical Investigation.
Submitted: November 11, 2020; Accepted: July 1, 2021; Published: August 16, 2021.
                                                                                                        folding of integral transmembrane and secretory proteins take
Reference information: J Clin Invest. 2021;131(16):e145971.                                             place in the ER. Only correctly folded proteins are exported via
https://doi.org/10.1172/JCI145971.                                                                      the trans-Golgi network to the plasma membrane or outside of

                                                                                                                                                                                                    1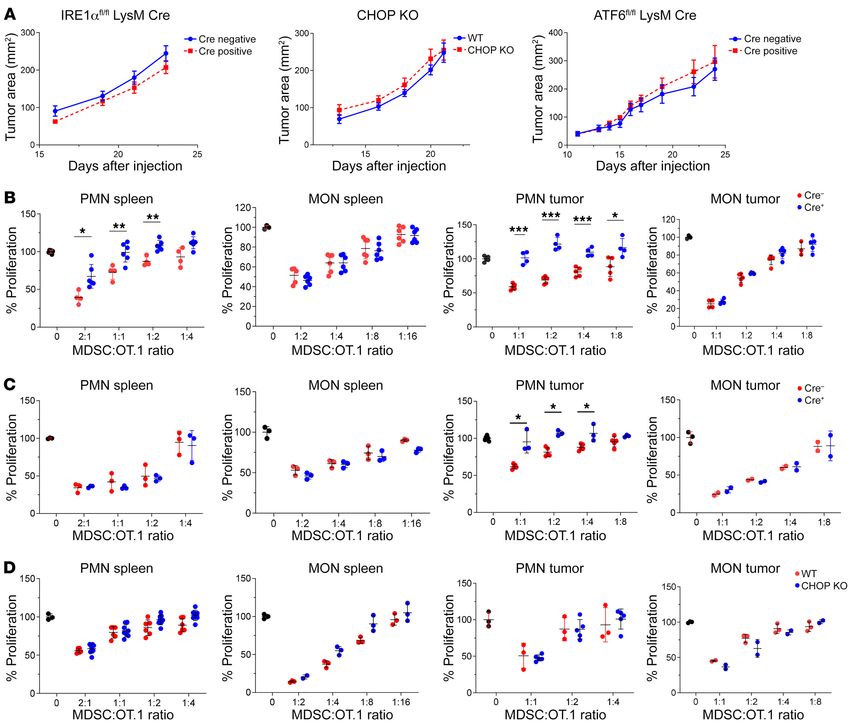
RESEARCH ARTICLE                                                                                      The Journal of Clinical Investigation

the cells (14). In eukaryotes, the UPR consists of 3 major signaling      activity at any time after infection. In contrast, in LCMV-C13–
cascades (15). Upon the detection of accumulating misfolded pro-          infected mice, suppressive activity was detected on day 7 after
teins, protein kinase RNA–like (PKR-like) ER kinase (PERK) phos-          infection. It became more prominent by day 14 and, although
phorylates eukaryotic protein synthesis initiation factor 2 (eIF2a),      decreased, was still detectable on day 30 after infection (Figure
which inhibits initiation of mRNA translation and halts the flux of       1A). In contrast, no suppressive activity was detected in PMNs in
newly synthetized proteins into the ER. eIF2a activates the expres-       either acute or chronic LCMV infection (Figure 1B). Thus, con-
sion of the transcription factor ATF4 and its downstream targets,         sistent with a previous report (19), infection with LCMV-C13 but
including the proapoptotic transcription factor C/EBP homolo-             not with LCMV-Arm caused accumulation of immune-suppres-
gous protein (CHOP) as well as the growth arrest and DNA dam-             sive M-MDSCs. However, we did not find immune-suppressive
age–inducible protein 34 (GADD34), a phosphatase 1 cofactor that          PMN-MDSCs in these mice. Remarkably, suppressive activity
functions as a negative-feedback regulator of eIF2a phosphoryla-          did not match expansion of myeloid cells. PMNs were expanded
tion. Inositol-requiring enzyme 1 (IRE1) cleaves the mRNA encod-          much stronger than MONs but had no suppressive activity. The
ing for the transcription factor X-box–binding protein 1 (Xbp1)           population of M-MDSCs returned to control values by day 30, but
(16). Cleaved XBP1 mRNA is then ligated by a tRNA ligase, RtcB,           suppressive activity in these cells was still detected.
turning into spliced version (sXBP1) and translated to produce                 To assess function of MDSCs in cancer, we used 2 tumor
sXbp1 protein. sXBP1 is a highly active transcription factor and          models: Lewis Lung Cancer (LLC) and EL4 lymphoma. Myeloid
one of the key regulators of ER folding capacity, lipid biosynthesis,     cells were evaluated 3 weeks after tumor inoculation. Both tumor
and ER-associated degradation (17). IRE1 activity also includes           models caused accumulation of MONs and PMNs (Supplemental
degradation of a specific set of mRNAs via the process of regulat-        Figure 2) in spleens and tumors with strong immune-suppressive
ed IRE1-dependent decay (RIDD). Activating transcription factor           activity, indicative of M-MDSCs and PMN-MDSCs, respectively
6 (ATF6) is transported to the Golgi apparatus and processed into         (Figure 1, C and D).
an active transcription factor. After nuclear translocation, ATF6              Since suppressive M-MDSCs were found in the models of viral
induces the transcription of ER chaperone genes, such as BiP and          infection and cancer, we asked if these cells were functionally dif-
several major targets of the mammalian UPR, including Xbp1.               ferent. M-MDSCs are characterized by a well-defined set of genes
     In this study, we focused on the ER stress response possibly         implicated in their immune-suppressive activity (6). We found that
being a common pathway responsible for acquisition of MDSC                M-MDSCs from mice infected with LCMV-C13 and M-MDSC from
activity in chronic viral infection and cancer. We expected to            tumors of LLC tumor-bearing (TB) mice had similar substantial
identify the role of specific sensors of ER stress in the regula-         upregulation of the expression of Nos2, Arg1, and Il-10 (Figure 2). In
tion of MDSCs. Surprisingly, we determined that acquisition of            addition, tumor infiltrating M-MDSCs upregulated Ptges expression.
PMN-MDSC and M-MDSC suppressive activity in viral infec-                  In splenic M-MDSCs we observed the upregulation (about 8-fold
tion and cancer was governed by different basic mechanisms.               increase) of Nos2, but not of the other genes (Figure 2). To better
PMN-MDSC activity in cancer was regulated by the IRE1α and                understand the difference between M-MDSCs from LCMV-C13–
ATF6 pathways of the ER stress response, whereas both pathways            infected and LLC TB mice, we performed whole transcriptome RNA
were dispensable for functional activity of M-MDSCs. Instead, in          sequencing (RNAseq). We compared changes in gene expression
both viral infection and cancer, M-MDSC function was dependent            between spleen MONs from control mice and spleen M-MDSCs
on IFN-γ signaling and independent of ER stress. Specific target-         from LCMV-C13–infected and LLC TB mice isolated at the peak of
ing of these mechanisms had different functional consequences             their suppressive activity (day 14 for LCMV-C13–infected mice and
for generation of antiviral and antitumor immune responses.               day 21 for TB mice). There was a strong correlation in differentially
                                                                          expressed genes between M-MDSCs from LCMV-C13–infected and
Results                                                                   LLC TB mice (Figure 3A). However, the number of genes changed
Accumulation of MDSC populations in viral infection and cancer. To        differently in M-MDSCs from LCMV-C13 and LLC TB mice (Fig-
assess the effect of viral infection on MDSCs, we used 2 strains          ure 3B). Most of the pathways changed similarly in M-MDSCs from
of LCMV: Armstrong (LCMV-Arm), which causes acute infection               LCMV-C13–infected and LLC TB mice. Notably, enrichment anal-
and rapid clearance of virus, and C13 (LCMV-C13), which is not            ysis showed similar upregulation of E2F target genes in M-MDSCs
rapidly cleared by the host immune system and causes chron-               from LCMV-C13–infected and LLC TB mice (Figure 3C). E2F is
ic infection (18). On day 7 after infection we observed similar           an important component of ER stress pathways. M-MDSCs from
increases of CD11b+Ly6ChiLy6G– MONs and CD11b+Ly6CloLy6G+                 LCMV-C13–infected mice demonstrated upregulation of genes
PMNs for both acute and chronic infection models. However, by             associated with interferon gamma and interferon alpha responses.
day 14 after infection, the myeloid compartment (most promi-              However, this effect was absent in M-MDSCs from LLC TB mice
nently MONs) started to come back to baseline levels in the acute         (Figure 3C). Thus, although M-MDSCs in LCMV-C13–infected and
infection model, whereas it maintained significantly elevated             LLC TB mice share major characteristics of immune-suppressive
levels in chronically infected mice and returned to the values of         activity, there were some differences in gene expression profile
naive mice by day 30 after infection (Supplemental Figure 1; sup-         between these cells.
plemental material available online with this article; https://doi.            The ER stress response regulates the functional activity of
org/10.1172/JCI145971DS1). Suppressive activity of these cells            PMN-MDSCs. Previously, we and others have implicated the ER
was assessed in antigen-specific response of OT1 T cells. Spleen          stress response in acquisition of suppressive activity by MDSCs
MONs from mice infected with LCMV-Arm had no suppressive                  (7, 11, 12). However, the direct contribution of each specific ER

   2                                  J Clin Invest. 2021;131(16):e145971 https://doi.org/10.1172/JCI145971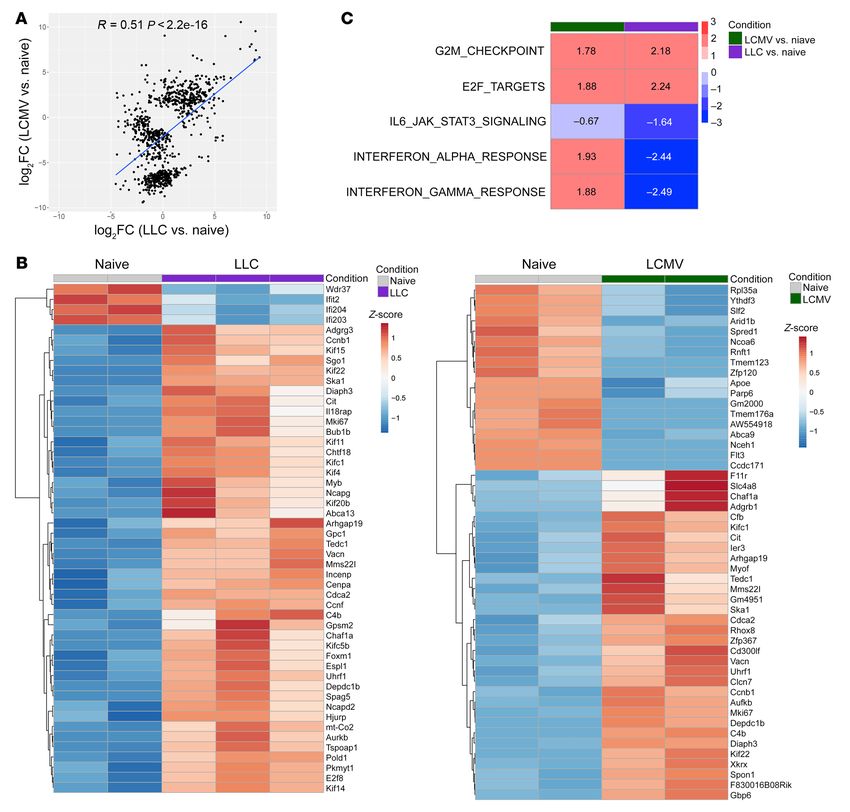
The Journal of Clinical Investigation                                                                                       RESEARCH ARTICLE

Figure 1. Viral infection and tumors induce different subsets of MDSCs. (A and B) Mice were infected with LCMV-Arm or LCMV-C13 viruses. Monocytes
(A) and neutrophils (B) were sorted from pooled 3 to 4 murine spleens at specified time-points and their suppressive activity was measured in co-cultures
with activated OT.1 splenocytes. The representative experiment out of 3 independent experiments with similar results is shown. (C and D) Similar experi-
ments as in A and B were conducted using LLC (C) and EL4 (D) tumor-bearing mice. Monocytes and neutrophils were sorted from spleens and tumors and
their suppressive activity was measured in co-cultures with activated OT.1 splenocytes. The representative experiment of 3 independent experiments with
similar results is shown. Proliferation of T cells in the absence of MDSCs in each experiment was set as 100%. *P < 0.05, **P < 0.01; ***P < 0.001, ****P <
0.0001 from control in ANOVA test with correction for multiple comparisons.

stress response pathway to MDSC function remained unclear. We                   stream from IRE1α and ATF6 pathways; Figure 4A). In PMN-
assessed the expression of genes associated with all 3 major path-              MDSCs from spleens of LLC TB mice, upregulation of Xbp1s
ways of the ER stress response: PERK, IRE1α, and ATF6. Myeloid                  (IRE1α pathway) was observed. That increase was much more
cells isolated from either LCMV-Arm– or LCMV-C13–infected                       prominent in tumors. In addition to the IRE1α pathway, upregu-
mice didn’t show prolonged upregulation of transcripts or proteins              lation of components of the PERK and ATF6 pathways was also
of ER stress response pathways that would correlate with suppres-               observed in tumor-infiltrating PMN-MDSCs (Figure 4B).
sive activity of M-MDSCs (Supplemental Figure 3). In contrast,                       To directly address the contribution of the ER stress response
tumor-associated M-MDSCs had significant upregulation of the                    to MDSC function, we used mice with deletion of each ER stress
expression of Chop (part of PERK pathway) and Erp72 (down-                      response pathway: Ire1αfl/flLysM-Cre mice with targeted deletion

                                          J Clin Invest. 2021;131(16):e145971 https://doi.org/10.1172/JCI145971                                        3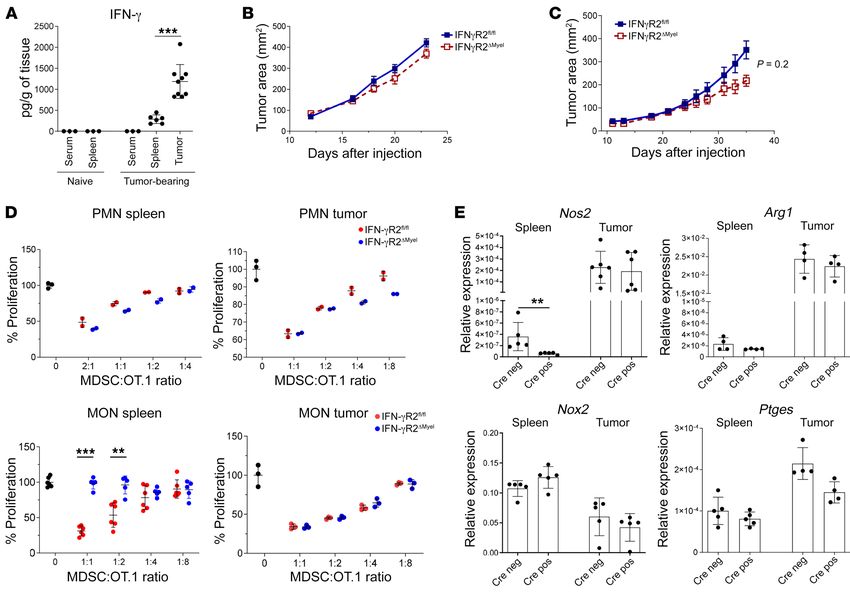
RESEARCH ARTICLE                                                                                             The Journal of Clinical Investigation

Figure 2. Expression of the genes implicated in M-MDSC suppressive activity. Monocytic cells were sorted from spleens of naive, C13-LCMV–infected
(day 14) mice and spleens and tumors of LLC TB mice. The expression of the indicated genes adjusted to β-actin expression was measured by qRT-PCR
(n = 4–13). Individual values are shown on graphs. *P < 0.05, **P < 0.01; ***P < 0.001, ****P < 0.0001 from control using ANOVA test with correction for
multiple variables.

of IRE1α in myeloid cells (IRE1αΔMyel), Atf6fl/flLysM-Cre deletion              response. IRE1α deletion resulted in a substantial decrease in
of ATF6 in myeloid cells (ATF6ΔMyel), and total CHOP-KO. In                     the expression of Nos2 in tumor PMN-MDSCs, whereas no effect
IRE1αΔMyel and ATF6ΔMyel mice, the expression of targeted genes                 on the expression of Nox2 or Arg1 was observed. (Figure 6D). In
in PMNs and MONs was decreased by 50% to 70% (Supple-                           spleen PMN-MDSCs, IRE1α deletion inhibited the expression of
mental Figure 4A). We also confirmed lack of the expression of                  Arg1 (Figure 6E). IRE1αΔMyel tumor-infiltrating PMN-MDSCs pro-
Chop in CHOP-KO mice after stimulation of splenocytes with                      duced less immune-suppressive PGE2 than PMN-MDSCs in con-
thapsigargin (ER stress inducer; Supplemental Figure 4A). Con-                  trol Cre– TB mice. A similar effect was observed in PMN-MDSCs
sistent with the absence of upregulation of the ER stress pathways              from ATF6ΔMyel TB mice (Figure 6F). These results indicate that
in M-MDSCs from LCMV-C13 mice, deletion of CHOP, IRE1α, or                      tumor PMN-MDSC activity is mainly controlled by activation of
ATF6 did not cancel potent suppressive activity of M-MDSCs in                   the IRE1α and ATF6 pathways of the ER stress response involving
mice infected with LCMV-C13. PMNs in WT LCMV-C13–infected                       upregulation of Nos2, Arg1, and PGE2 production. However, the
mice were not suppressive and this was not changed in KO mice                   ER stress response was dispensable for M-MDSC activity in both
(Supplemental Figure 4B).                                                       tumor and viral infection models.
     Similar experiments were performed in LLC TB mice. Delet-                       Mechanism of M-MDSC suppressive activity in LCMV infection
ing any of the 3 targeted genes did not affect tumor growth (Figure             and cancer. In contrast to PMN-MDSCs, IRE1α and ATF6 did not
5A) and did not affect suppressive activity of M-MDSCs (Figure 5,               control suppressive activity of M-MDSCs in TB mice (Figure 5).
B–D). However, deletion of IRE1α completely abrogated suppres-                  Similarly, M-MDSC suppressive activity was not abrogated by tar-
sive activity of PMN-MDSCs in spleens and tumors (Figure 5B), and               geting the ER stress response in LCMV-C13–infected mice (Sup-
deletion of ATF6 abrogated suppressive activity of PMN-MDSCs in                 plemental Figure 4B). We asked: What could be the mechanism
tumors, but not in spleens (Figure 5C), whereas deletion of CHOP                of M-MDSC induction? Analysis of serum cytokines performed
had no effect on suppressive activity of PMN-MDSCs (Figure 5D).                 in LCMV-C13 and LCMV-Arm mice demonstrated a substantial
     In contrast to LLC, MC38 is characterized by overexpression                increase of IFN-γ in the plasma of LCMV-C13 mice at the time
of p53 and considered to be a moderately immunogenic tumor (no                  of M-MDSC suppressive activity (Figure 7A). This was consistent
spontaneous rejection, but highly susceptible to immune therapy                 with upregulation of the interferon gamma pathway observed in
with check-point inhibitors). We observed a significant delay of                M-MDSCs from LCMV-C13–infected mice by RNAseq (Figure
tumor growth in IRE1αΔMyel and ATF6ΔMyel mice, but not in CHOP-                 3C). To test the role of IFN-γ directly, we used Ifngr2fl/flLysM-Cre+
KO mice (Figure 6A). The observed antitumor effect was CD8+ T                   mice with targeted deletion of IFN-γ receptor in myeloid cells
cell–mediated, since the depletion of CD8+ T cells abrogated this               (IFN-γR2ΔMyel; Supplemental Figure 5). Deletion of IFN-γR2 com-
effect (Figure 6B). MC38 tumors express the p53-derived peptide                 pletely abrogated suppressive activity of M-MDSCs in LCMV-C13
KYMCNSSCM. We observed a significantly higher spontaneous                       mice (Figure 7B). We assessed the effect of IFN-γR2 deletion on
peptide-specific CD8+ T cell response in MC38 TB IRE1αΔMyel and                 generation of LCMV-specific immune response in mice 2 weeks
ATF6ΔMyel mice than in control mice. No such effect was seen in                 after infection with LCMV-C13. CD8+ T cell responses specific for
CHOP-KO mice (Figure 6C), indicating that IRE1α or ATF6 dele-                   LCMV-derived gp33-41 peptide were measured by intracellular
tion in MDSCs substantially enhanced tumor-specific immune                      staining in CD8+ T cells (Figure 7C) and IFN-γ ELISPOT (Figure

   4                                      J Clin Invest. 2021;131(16):e145971 https://doi.org/10.1172/JCI145971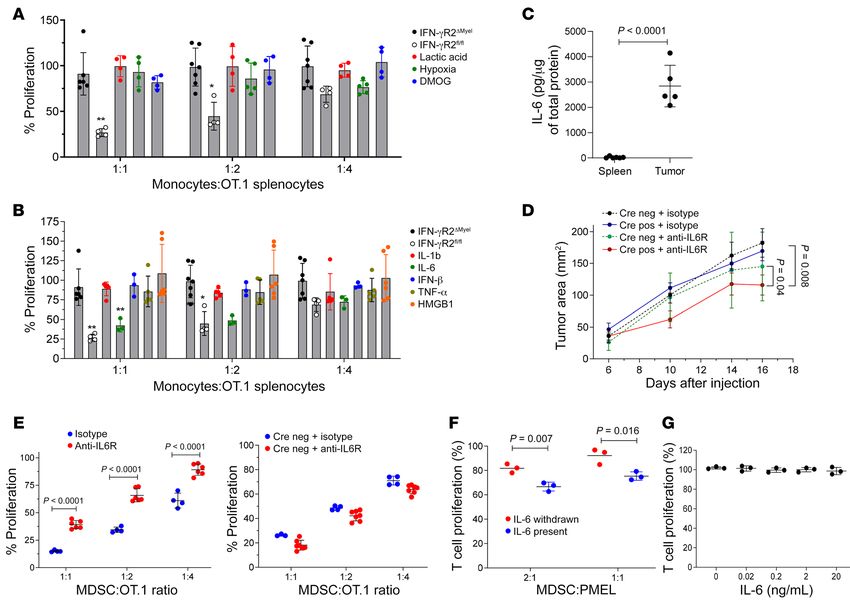
The Journal of Clinical Investigation                                                                                 RESEARCH ARTICLE

Figure 3. Gene expression profile of M-MDSCs. (A) Correlation of log2FC of differentially expressed genes in spleen M-MDSCs from LLC TB mice versus
MONs from naive mice and M-MDSCs from LCMV-C13–infected mice versus MONs from naive mice. (B) Heatmap showing top 50 differentially expressed
genes for M-MDSCs from LLC TB mice versus MONs from naive mice and M-MDSCs from LCMV-13–infected mice versus MONs from naive mice. (C) Gene
set enrichment analysis represents NES (normalized enrichment score) as calculated by fGSEA.

7D). In both assays, we observed substantially higher respons-              er (around 300 pg/g) in spleens of TB mice. In tumors, IFN-γ was
es in IFN-γR2ΔMyel than in Ifngr2fl/fl control mice (Figure 7, C and        much higher (around 1200 pg/g; Figure 8A). Growth of LLC was not
D). Deletion of IFN-γR2 in M-MDSCs dramatically reduced the                 affected in IFN-γR2ΔMyel mice (Figure 8B). Although there was some
expression of Nos2 without affecting Arg1, Nox2, or Ptges (Figure           trend in delay of growth of MC38 tumor in IFN-γR2ΔMyel mice, it also
7E). To confirm a functional role of NO production by M-MDSCs,              did not reach significance (Figure 8C). Deletion of IFN-γR2 did not
we used the selective iNOS (NOS2) inhibitor L-NMMA. Inhibition              affect suppressive activity of PMN-MDSCs in spleens or tumors. IFN-
of NOS2 abrogated suppressive activity of M-MDSCs (Figure 7F).              γR2 deletion abrogated suppressive activity of M-MDSCs in spleens,
Thus, M-MDSC activity in chronic LCMV infection was regulated               but not in tumors (Figure 8D). Deletion of IFN-γR2 caused decrease
by IFN-γ via upregulation of Nos2.                                          of Nos2 expression. However, it was observed only in spleen but not
    Similar experiments were performed in LLC and MC38 TB mice.             in tumor M-MDSCs (Figure 8E). Apparently, the interferon gamma
IFN-γ was undetectable in spleens of tumor-free mice. It was high-          pathway contributed to suppressive activity of splenic M-MDSCs.

                                        J Clin Invest. 2021;131(16):e145971 https://doi.org/10.1172/JCI145971                                   5
RESEARCH ARTICLE The Journal of Clinical Investigation
Figure 4. Tumor progression is associated with the elevated ER stress response in PMN-MDSCs. M-MDSCs (A) and PMN-MDSCs (B) were sorted from
spleens of naive mice and spleens and tumors of LLC TB mice 3 weeks after tumor inoculation. Gene expression of the key molecules of the different ER
stress response pathways was measured; n = 4–10. Individual values are shown on graphs. P values were calculated using 1-way ANOVA test with correc-
tion for multiple comparisons. Values less than 0.05 are shown on graphs.
We asked why deletion of IFN-γR2 in M-MDSCs did not abro- of M-MDSCs (Figure 9B). We measured the presence of IL-6 in
gate their suppressive activity in the tumor microenvironment spleens and tumors of TB mice and found that IL-6 in TME was
(TME). We hypothesized that other factors present in TME could dramatically higher than in spleens (Figure 9C). To investigate
compensate for the loss of IFN-γR signaling. To test this hypoth- the role of IL-6 in the regulation of tumor progression and tumor
esis, M-MDSCs were isolated from spleens of TB IFN-γR2ΔMyel or M-MDSC function, we neutralized IL-6 signaling with anti–IL-6R
control mice and then treated in the presence of tumor explant antibody. Treatment of LLC TB mice with IL-6R antibody did
supernatants for 24 hours in the presence of lactic acid (enriched not significantly reduced tumor growth in WT mice. However, in
in TME), dimethyloxallyl glycine (HIF-1α stabilizing agent), or IFN-γR2 conditional KO mice, it resulted in a substantial decrease
exposed to 0.1 % hypoxia. M-MDSCs from spleens of control LLC in tumor progression (Figure 9D). Suppressive capacity of tumor
TB mice had potent suppressive activity. This suppression was IFN-γR2ΔMyel MONs was significantly attenuated in mice treated
abrogated in M-MDSCs from IFN-γR2ΔMyel LLC TB mice. Exposure with anti–IL-6R antibody. No such effect was observed in WT
of these cells to hypoxia or lactic acid did not restore suppressive mice treated with anti–IL-6R antibody (Figure 9E). We asked if
activity of M-MDSCs (Figure 9A). Next, we explored the effect of the continuous presence of IL-6 is required to maintain suppres-
proinflammatory cytokines present in TME with known activity sive activity by M-MDSCs. To experimentally address this ques-
on MONs. Treatment of splenic IFN-γR2ΔMyel MONs with a range tion, bone marrow progenitors were cultured with GM-CSF and
of concentrations of IL-1β, TNF-α, IFN-β, or HMGB1 did not IL-6 for 3 days and then split into 2 groups. In the first group cells
restore suppressive activity of spleen M-MDSCs from IFN-γR2ΔMyel were cultured for additional 3 days in the presence of IL-6. In the
LLC TB mice (Figure 9B). However, treatment with IL-6 reversed second group, cells were cultured for an additional 3 days in the
the effect of IFN-γR2 deletion and restored suppressive activity absence of IL-6. IL-6 withdrawal from the culture resulted in loss
6 J Clin Invest. 2021;131(16):e145971 https://doi.org/10.1172/JCI145971The Journal of Clinical Investigation RESEARCH ARTICLE
Figure 5. ER stress pathways regulate suppressive activity of PMN-MDSCs, but not M-MDSCs, during tumor progression. Mice with deletions of the
specified key molecules of different ER stress response pathways were injected with LLC tumor cells and the kinetics of tumor growth were measured (A).
The representative results of 1 of 2 independent experiments are shown; n = 6 for control and KO mice for IRE1α, n = 6 for control and CHOP-KO mice, n = 9
for control and n = 4 for ATF6 KO mice. M-MDSCs and PMN-MDSCs were sorted from spleens and tumors of LLC TB IRE1αΔMyel mice (B), ATF6ΔMyel mice (C),
and CHOP-KO mice (D), and their suppressive activity was evaluated and compared with the cell populations from the control (Cre–) littermates (B and C) or
WT (D) mice. The results of 3 independent experiments are shown. *P < 0.05, **P < 0.01; ***P < 0.001 from control in 2-sided unpaired Student’s t tests.
of suppressive activity by MDSCs, whereas in the presence of IL-6 cer shared a number of common features, there were fundamental
they demonstrated suppressive activity (Figure 9F). We also tested differences. First, chronic LCMV infection did not cause generation
an effect of IL-6 on T cell proliferation directly. Two-day culture of PMN-MDSCs, whereas in cancer models, both M-MDSCs and
of splenocytes with IL-6 did not affect T cell proliferation (Figure PMN-MDSCs were prominent features in both spleens and tumors.
9G). Thus, taken together, these results suggested that IL-6 could Consistent with a previous report, chronic but not acute LCMV
be one of the nonredundant mechanisms that support M-MDSC infection caused accumulation of M-MDSCs (19). We hypothe-
function in tumors. sized that one of the reasons for accumulation of MDSCs in chronic
infection and cancer is a persistent stimulation of myelopoiesis that
Discussion in combination with proinflammatory factors might lead to activa-
In this study, we identified specific mechanisms that could govern tion of the UPR and acquisition of immune-suppressive activity by
accumulation of immune-suppressive activity by MDSCs in cancer myeloid cells. A recent study implicating nutrient deprivation sen-
and chronic viral infection. By comparing the functional activity of sor GCN2 in immune-suppressive activity of MDSCs involving ER
M-MDSCs and PMN-MDSCs side by side in different models, we stress pathways supports this hypothesis (20). However, although
have established that although MDSCs in chronic infection and can- both LCMV-C13 infection and tumors caused accumulation of
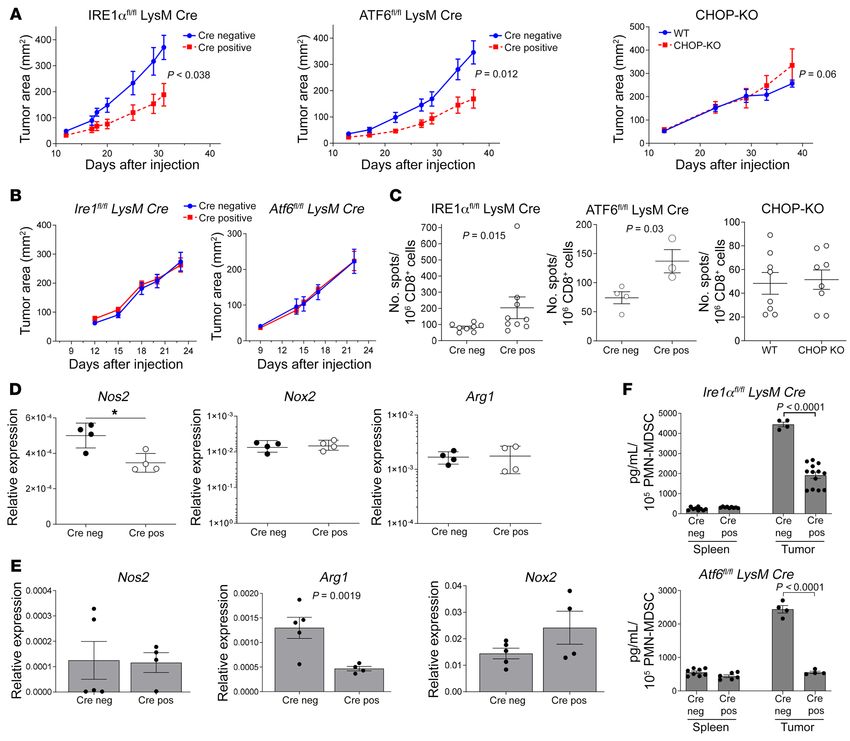
J Clin Invest. 2021;131(16):e145971 https://doi.org/10.1172/JCI145971 7RESEARCH ARTICLE The Journal of Clinical Investigation Figure 6. IRE1α and ATF6 deletion in myeloid cells improves antigen-specific responses and delays the growth of MC38 tumors. (A) MC38 tumor growth in mice with specified deletions. The representative results of 1 of 2 independent experiments are shown; n = 5 for Cre– control and n = 6 mice for IRE1αΔMyel mice, n = 5 for control and n = 6 for CHOP-KO mice, n = 19 for Cre– control, and n = 15 for ATF6ΔMyel mice. P values are from 2-way ANOVA test with adjust- ments for multiple measurements. (B) MC38 tumor growth in IRE1αΔMyel and ATF6ΔMyel mice treated with 100 μg anti-CD8 antibody twice per week starting from day 1; n = 8 for control and n = 4 for treated IRE1αΔMyel mice, n = 4 for control, and n = 4 for treated ATF6ΔMyel mice. (C) Antigen-specific response to KYMCNSSCM p53 peptide by splenic CD8+ T cells from IRE1αΔMyel, CHOP–/–, and ATF6ΔMyel mice bearing MC38 tumors was measured by IFN-γ ELISPOT; n = 3–8. Individual values are shown on graph. P values calculated with Mann-Whitney U tests are shown on graphs. (D) Expression of genes associated with suppressive activity was evaluated by qRT-PCR in tumor PMN-MDSCs isolated from IRE1αΔMyel LLC TB mice. The results of 3 independent experiments are shown; n = 4 and individual values are shown on graphs. *P < 0.05. (E) Expression of genes associated with suppressive activity was evaluated by qRT-PCR in spleen PMN-MDSCs isolated from IRE1αΔMyel LLC TB mice. P value was calculated using 2-sided unpaired Student’s t tests; n = 4–5 and individual values are shown on graphs. (F) Spleen and tumor PMN-MDSCs from ATF6ΔMyel MC38 TB CD8 antibody-treated mice with similar tumor sizes and IRE1αΔMyel LLC TB mice with similar tumor sizes were sorted and cultured for 20 hours. Supernatants were collected and the amount of PGE2 was measured by ELISA; n = 4–13. Individual values are shown on graphs. P values calculated from 2-sided Student’s t tests are shown. cells with the phenotypes of PMNs and MONs, immune-suppres- This may decrease the pressure on the myeloid compartment and sive PMN-MDSCs were found only in tumor models. Activation explain the lack of the ER stress response. Alternatively, in cancer of the ER stress response was not detectable in PMNs or MONs in there could be other mechanisms able to stimulate the ER stress LCMV-C13 infection. In contrast, it was prominently featured in response. In tumor tissues, hypoxia can be such factor. However, cancer. One of the possible explanations is that myeloid cell expan- in spleens the mechanism is not clear and is probably regulated by sion is constantly increased in tumor models over time, whereas tumor-derived soluble factors. The surprising finding in this study in LCMV-13 infection, it peaks around day 14 and then decreases. was the fact that although the ER stress response was detected in 8 J Clin Invest. 2021;131(16):e145971 https://doi.org/10.1172/JCI145971
The Journal of Clinical Investigation                                                                                       RESEARCH ARTICLE

Figure 7. IFN-γ regulates suppressive activity of splenic M-MDSCs during chronic LCMV infection. (A) C57BL/6 mice were infected with LCMV-Arm or
LCMV-C13 and the concentrations of plasma IFN-γ were measured at different time points by ELISA. The results of 2 independent (n = 9) experiments are
shown. (B–E) IFN-γR2fl/fl LysM-Cre positive and negative littermate mice (IFN-γR2ΔMyel and IFN-γR2fl/fl, respectively) were infected with LCMV-C13. Mono-
cytic cells were sorted from spleens on day 14 and their suppressive activity was measured in cocultures with activated OT.1 splenocytes (B). Splenic CD8+
T cell responses to specific LCMV-derived peptide (gp33-41) were measured by IFN-γ intracellular staining (C) or IFN-γ ELISPOT (D). The gene expression of
the key immunosuppressive molecules was measured in monocytic cells by qRT-PCR (E). The results of 3 independent experiments are shown (n = 5–6).
*P < 0.05, **P < 0.01, ***P < 0.001 from control in 2-sided unpaired Student’s t tests. (F) Effect of iNOS inhibitor on the suppressive activity of M-MDSCs.
Mice were infected with 1 × 10⁶ pfu LCMV C13 strain i.v. and splenic monocytes were sorted on day 14. Suppression assay with sorted monocytes and OT.1
splenocytes was set up in the presence of vehicle or 700 μM L-NMMA. Mean and SD are shown (n = 3–4). P values were calculated using Student’s t tests.

both MDSC populations in cancer, only PMN-MDSC function was                     MDSC function. Our data for CHOP-targeted deletion were not
dependent on the ER stress response, whereas it was dispensable                 consistent with a report demonstrating cancellation of MDSC sup-
for M-MDSC activity. Apparently, other mechanisms more promi-                   pressive activity in tumor MDSCs and a resulting antitumor effect
nently control suppressive activity of M-MDSCs than ER stress.                  (12). A recent study linked activation of CHOP with microbiota
     IRE1α and ATF6 pathways were directly involved in control                  (26). It is possible that the effect of CHOP on MDSCs may depend
of PMN-MDSC suppressive activity in TB mice, since the dele-                    on microbiota present in different facilities.
tion of these pathways abrogated function of PMN-MDSCs in                           Our data indicate that in cancer abrogation of PMN-MDSCs,
spleens and tumors. ATF6 signaling was implicated in the adap-                  suppressive activity was sufficient to cause a delay of growth of the
tion to long-term chronic stress (21, 22). The N-terminal cytosolic             immunogenic tumor. This effect was mediated by CD8+ T cells.
fragment of ATF6 functions as a transcription factor and forms                  These results support the notion that in types of cancer associat-
heterodimers with XBP1. Furthermore, ATF6 was shown to reg-                     ed with spontaneous immune responses, PMN-MDSCs play an
ulate transcription of Xbp1 (23) and deletion of ATF6 decreased                 important role in regulation of tumor progression and targeting of
ER stress–induced BiP expression (24). IRE1α and ATF6 pathways                  PMN-MDSCs may be clinically beneficial.
converge on regulation of Xbp1-dependent signaling (25). Thus,                      Our data also indicate that in cancer and chronic LCMV infec-
it is possible that this common mechanism may regulate PMN-                     tion, suppressive activity of M-MDSCs was not controlled by the

                                          J Clin Invest. 2021;131(16):e145971 https://doi.org/10.1172/JCI145971                                        9
RESEARCH ARTICLE The Journal of Clinical Investigation Figure 8. IFN-γ regulates suppressive activity of splenic M-MDSCs during tumor progression. (A) IFN-γ concentration in sera, spleens, and tumor lysates from naive and LLC TB mice were measured by ELISA. The results of 3 independent experiments are shown (n = 3–8). (B and C) IFN-γR2ΔMyel and IFN-γR2fl/fl mice were injected with LLC (B) or MC38 (C) tumor cells and the tumor growth kinetics were measured. The representative results of 1 of 3 similar exper- iments are shown (n = 9 for IFN-γR2fl/fl and n = 4 for IFN-γR2ΔMyel mice in LLC model, n = 6 for IFN-γR2fl/fl, and n = 4 for IFN-γR2ΔMyel mice in MC38 model). M-MDSCs and PMN-MDSCs were sorted from spleens and tumors. Their suppressive activity was measured in cocultures with activated OT.1 splenocytes (D) and the expression of the key immunosuppressive molecules in M-MDSCs was measured by qRT-PCR (E) (n = 4–5 from 2 independent experiments). **P < 0.01; ***P < 0.001 from control using 2-sided Student’s t tests. ER stress response, but instead was dependent on IFN-γ signaling. suppression via upregulation of reactive oxygen species and argi- IFN-γ is an important component of the innate antiviral response nase I, whereas treatment of M-MDSCs reduced their suppressing and is predominantly produced by NK cells or innate lymphoid activity by decreasing the arginase I activity (38). Our data using type 1 cells (27, 28). Signaling via IFN-γR leads to activation of blockade of IFN-γ signaling in myeloid cells in vivo demonstrat- JAK1 and JAK2, resulting in homodimerization and phosphoryla- ed that IFN-γ is dispensable for suppressive activity of PMN-MD- tion of STAT1 (29). IFN-γ has been shown to induce NO produc- SCs and promotes suppressive activity of M-MDSCs. Our data are tion (30). It also enhances stimulation of the adaptive immune consistent with the report showing that the deletion of IFN-γR in responses by activating antigen-presenting cells (31–33). IFN-γ myeloid cells abrogated suppressive activity of MDSCs via NO has been shown to “prime” macrophages to release reactive oxy- (39). Deletion of IFN-γR in myeloid cells abrogated M-MDSC sup- gen species (34), increase macrophage receptor-mediated phago- pressive activity in spleens but not in the tumor site, and it did not cytosis (35), and promote polarization of macrophages to an M1 result in significant antitumor effect. It appears that in the tumor phenotype (36). However, our findings demonstrate that IFN-γ site other factors compensated for the loss of IFN-γR signaling. We can indirectly induce an immunoregulatory effect of M-MDSCs. found that one of the factors could be IL-6. The level of IL-6 inside Increased expression of Nos2 and NO production induced by tumors is much higher than that in spleens. IL-6 triggers differ- IFN-γ can promote immune-suppressive activity of these cells. ent signaling pathways than IFN-γR primarily via STAT3 and was Consistent with our observation, the ability of IFN-γ to support previously directly implicated in MDSC activity (40). STAT3 itself differentiation of MDSCs in vitro has been reported (37). In vitro was one of the major transcription factors involved in MDSC accu- treatment of PMN-MDSCs and M-MDSCs generated during mulation (41). Thus, IL-6 and IFN-γR may represent nonredun- M. bovis chronic inflammation with IFN-γ promoted PMN-MDSC dant mechanisms of M-MDSC regulation. For PMN-MDSCs the 10 J Clin Invest. 2021;131(16):e145971 https://doi.org/10.1172/JCI145971
The Journal of Clinical Investigation                                                                                        RESEARCH ARTICLE

Figure 9. Effect of TME on immune-suppressive activity of M-MDSCs with deleted IFN-γR2. (A and B) Splenic M-MDSCs from LLC TB mice were sorted
and cultured in the specified conditions for 24 hours. Their suppressive activity was measured with activated OT.1 splenocytes. The results of 3 indepen-
dent experiments are shown; n = 3–5. (C) IL-6 protein concentrations in spleens and tumor lysates from LLC TB mice were measured by ELISA (n = 5). P val-
ue was calculated using 2-sided unpaired Student’s t tests. (D and E) LLC TB mice were treated with 400 μg/mL anti-IL6R or isotype control starting from
day 3 every 3 days until day 16. (D) Kinetics of tumor growth were measured. Mean and SD (n = 6–10 per group) are shown. P values were calculated using
2-way ANOVA test. (E) Tumor monocytes from IFN-γR2ΔMyel mice (left panel) or WT mice (right panel) (n = 4 isotype-treated group, n = 6 IL-6R antibody–
treated group) were sorted and suppressive activity was measured in triplicates with OT.1 splenocytes using 3H-thymidine incorporation. Proportion of
proliferation from control values (splenocytes stimulated in the absence of MDSCs) is shown. P values were calculated using Student’s t test. (F) Inhibition
of T cell proliferation by MDSCs generated from HPCs. Bone marrow HPCs were cultured for 3 days with GM-CSF and IL-6, then medium was replaced with
a new medium with or without IL-6. Cells were collected 3 days later and incubated with splenocytes from PMEL mice in the presence of 10 ng/mL cognate
gp100-derived peptide at 2:1 and 1:1 ratios. Cell proliferation was measured after 48 hours; n = 3. P values were calculated using unpaired 2-sided Student’s
t tests. (G) Splenocytes isolated from PMEL mice were cultured with 10 ng/mL cognate gp100-derived peptide in the presence of different concentrations
of IL-6 (0.02–20 ng/mL). Proliferation of T cells was measured after 48 hours.

situation is different, since their functional activity is controlled           on IFN-γR signaling. Since IFN-γ production is associated with
by the ER stress response. In tumors, the ER stress response can                potent immune response in cancer or infections, this mechanism
be further enhanced as compared with spleens, probably because                  may serve to limit the extent of T cell activation. Thus, an effective
of hypoxia. Therefore, the blockade of the ER stress response in                approach to immune therapy may require specific targeting of dif-
PMN-MDSCs abrogated their suppressive activity.                                 ferent immune suppression regulation mechanisms.
    Thus, our data indicate that the mechanisms of MDSC acti-
vation are different in PMN-MDSCs and M-MDSCs. The ER                           Methods
stress response appears to be a dominant factor in regulating                   Mice. C57BL/6 mice (male and female, 6–10 weeks old) were obtained
PMN-MDSCs and at least in one immunogenic tumor model is                        from Charles River or from Envigo. All genetically engineered mice
enough to reduce tumor progression. In combination with a num-                  were on C57BL/6 background. CHOP-KO mice were obtained from
ber of reports in recent years demonstrating the critical role of               The Jackson Laboratory. Mice with floxed exons 16 to 17 in the Ire1α
PMN-MDSCs in tumor progression (42–44), these results open an                   gene were originally generated by the Randal Kaufman group (Sanford
opportunity to selectively target these cells. In contrast, M-MDSCs             Brigham Prebys, La Jolla, California, USA) and Ire1α/LysM-cre mice
did not depend on activation of the ER stress response but rather               were obtained from Deyu Fang (Northwestern University, Chicago,

                                          J Clin Invest. 2021;131(16):e145971 https://doi.org/10.1172/JCI145971                                        11
RESEARCH ARTICLE The Journal of Clinical Investigation
Illinois, USA). Mice with the floxed exons 8 to 9 in Atf6 gene were origi- (Bio-Rad). After blocking with 5% nonfat milk in PBST (PBS, pH 7.5,
nally generated by the Gokhan Hotamisligil group (Harvard University, 0.5% Tween 20) for 60 minutes, the membrane was washed once with
Boston, Massachusetts, USA) and obtained from The Jackson Labora- PBST and incubated for 2 hours with primary antibodies followed by
tory. They were crossed to LysM-cre mice obtained from The Jackson a 1 hour incubation with the corresponding secondary antibody and
Laboratory. Ifngr2fl/LysM-cre mice were generated as described (45) ECL development (Amersham Biosciences).
using C57Bl6 Agouti ES cell line Ifngr2tm1a(KOMP)Wtsi generated in The ELISPOT assays. To evaluate the in vivo presence of T cells spe-
Knockout Mouse Project (KOMP, catalog 057086-UCD, https://www. cific to LCMV-derived gp33-41 KAVYNFATM peptide or p53-derived
mmrrc.org/catalog/cellLineSDS.php?mmrrc_id=57086; International KYMCNSSCM overexpressed by MC38 tumor cells, IFN-γ ELISPOT
Mouse Phenotype Project, https://www.mousephenotype.org/data/ assay was performed. Briefly, CD8+ T cells were isolated from the
alleles/MGI:107654/tm1a%2528KOMP%2529Wtsi). After the dele- spleens using magnetic beads (Miltenyi). The same number of isolat-
tion of neo cassette using in vivo β-actin FLP deleter, an IFN-γR2 floxed ed CD8+ T cells was mixed with 4 × 10⁵ irradiated total WT naive sple-
strain was established and further crossed to LysM-Cre strain. Mice nocytes and restimulated with 2 μg/mL (KAVYNFATM) or 5 μg/mL
were routinely genotyped for floxed, WT, or residual deleted allele by (KYMCNSSCM) peptide. Cells were cultured for 48 hours in the PVDF
PCR using the following primers: ACTGCTTGGCTGTGACTGATT, membrane plates (MilliporeSigma) precoated with anti–IFN-γ capture
CCATGTGGGATGGTTCCGTT, CCTGGTGCAGCAAACCCTAT. antibody (Mabtech), and then the plates were washed and developed
The presence of WT allele resulted in a 172 bp band, floxed allele (388 according to the manufacturer’s procedure (Mabtech).
bp), and deletion of the floxed allele was detected by 465 bp band. Cytokine quantification in tissues. Tumors and spleens were col-
Antibodies and cell lines. A list of antibodies used in the study is lected from LLC TB mice on days 17 to 20 and were mechanically
provided in Supplemental Table 1. Murine lung cancer cell line LLC homogenized by FastPrep-24 5G (MP Biomedicals) in 0.5 mL RIPA
and lymphoma cell line EL-4 were purchased from ATCC. MC38 was buffer (Sigma-Aldrich) containing 1/100 dilution of protease inhibi-
obtained from Kerafast. All cells were routinely tested for mycoplasma tors (Sigma-Aldrich). IL-6 in lysates were quantified using the ELISA
and found to be free of contamination. (R&D Systems). The total protein in lysate was measured by BCA pro-
Viral infection, tumor growth experiments, and cell isolation. In viral tein assay (Pierce) and the amount of cytokine in tissue was normal-
experiments, mice were injected i.v. with 1 × 10⁶ pfu Armstrong or C13 ized to total protein.
strains of LCMV. For tumor growth experiments, mice were injected Generation of MDSCs from hematopoietic progenitor cells (HPCs).
s.c. with 3 × 10⁵ EL4 thymoma, 3 × 10⁵ LLC, or 8 × 10⁵ MC38 colon Bone marrow HPCs were enriched with the Miltenyi enrichment kit and
carcinoma tumor cells. Mice were sacrificed at specified time points, cultured with 40 ng/mL GM-CSF and 20 ng/mL IL-6 for 3 days. Medi-
and spleens and/or tumors were isolated. Spleens were homogenized um was replaced with a new one with or without IL-6. Three days later
through a 70 μm filter and red blood cells were lysed by ACK buffer. Gr-1+ cells were isolated and evaluated in immune suppression assay.
Total tumor cells were isolated with the use of tumor dissociation kit RNA-sequencing. Splenocytes were stained with fluorophore-
(Miltenyi). Splenic PMNs (Ly6G+) and CD8+ T cells were pulled down conjugated antibodies in Brilliant Stain Buffer (BD Bioscience) on ice
by magnetic beads (Miltenyi). Splenic and tumor monocytes (CD45+ for 30 minutes in the dark. The surface-stained cells were washed
CD11b+Ly6G–Ly6Chi cells) and tumor PMNs (CD45+CD11b+Ly6G+ twice with RNase-free staining buffer (1× D-PBS, 0.5% BSA [MP
Ly6Cint cells) were sorted by FACS Aria II (Becton Dickinson). Biochemical], 0.4 U/μL RNasin Plus RNase Inhibitor [Promega]) at
Suppressive assays. PMNs or MONs were cocultured in 96-well 400g for 5 minutes and then fixed with 1× Foxp3 Fixation/Permeabi-
round-bottom plates with the mixture of OT.1 and WT splenocytes at lization working solution for 30 minutes at 2°C to 8°C in the dark. The
a 1:4 ratio in the presence of 0.5 ng/mL SIINFEKL peptide (specific fixed cells were washed (not resuspended) twice with ice-cold RNase-
to OT.1 receptor). T cell proliferation was assessed by 3H-thymidine free staining buffer without breaking the pellet for complete removal
incorporation using TopCount machine (PerkinElmer). of fixation buffer. The cell pellet was resuspended to the concentra-
Quantitative real-time PCR. Total RNA was extracted with total tion 2 × 10⁷/mL to 3 × 10⁷/mL in ice-cold RNase-free staining buf-
RNA microkit (Zymo) according to the manufacturer’s protocol. fer, filtered with 70 μm nylon mesh, and immediately CD45+CD11b+
Complementary DNA (cDNA) was synthesized with the use of a Ly6C+Ly6G– cells (M-MDSCs) were sorted by BD FACSAria Fusion
High-Capacity cDNA Reverse Transcription Kit (AppliedBiosystems). Cell Sorter (BD Bioscience) using 100 μm nozzle. The sorted cell
qRT-PCR was performed using Power SYBR Green PCR Master Mix pellet was snap-frozen and kept at –80°C until RNA extraction. Total
(Applied Biosystems) and QuantStudio 6 Flex Real-Time PCR System RNA was extracted from 1 to 2 million M-MDSCs using the miRN
(Applied Biosystems). Primers are described in Supplemental Table 2. easy FFPE RNA Isolation kit (Qiagen). RNA quantity was determined
ELISA. IFN-γ and IL-6 were measured in blood plasma, spleen, using the Qubit 3.0 Fluorometer (Thermo Fisher Scientific) and the
and tumor lysates using Ready-Set-Go ELISA kits (Thermo Fisher Sci- quality was validated using the TapeStation High Sensitivity RNA
entific). Prostaglandin E2 was measured in cell supernatants with the ScreenTape (Agilent). A quantity of 500 ng DNAse I–treated total
commercial kit from Thermo Fisher Scientific. RNA was used to prepare the library for Illumina Sequencing using
Flow cytometry and Western blotting. Flow cytometry for specified the Quant-Seq 3′mRNA-Seq Library Preparation Kit (Lexogen).
markers was conducted with the use of a BD LSR II flow cytometer (Bec- Library quantity was determined using qPCR (KAPA Biosystem).
ton Dickinson). Intracellular staining was performed with a BD Cytofix/ Overall library size was determined using the Agilent TapeStation
Cytoperm kit used according to the manufacturer’s recommendations. and the DNA High Sensitivity D5000 ScreenTape (Agilent). Equi-
For Western blotting, whole cell extracts were fractionated by molar amounts of each sample library were pooled and denatured in
SDS-PAGE and transferred to a polyvinylidene difluoride membrane a high-output, single-read 75 bp cycle. Next Generation Sequencing
using a transfer apparatus according to the manufacturer’s protocols was done on a NextSeq 500 (Illumina).
12 J Clin Invest. 2021;131(16):e145971 https://doi.org/10.1172/JCI145971The Journal of Clinical Investigation RESEARCH ARTICLE
Reads were mapped to Mus musculus genome (mm10) genome the manuscript. WG provided materials. SG provided materials and
using Star (46) for each sample. Uniquely mapped reads were count- edited the manuscript. MAAA and JCB performed experiments
ed using htseq-count (https://htseq.readthedocs.io/en/master/count. and provided materials. EJW participated in study design, provided
html) and normalized with size factors using DESeq2 (47). Differential- materials, and edited the manuscript. YN participated in data anal-
ly expressed genes across conditions were identified using DESeq2 (47) ysis, provided materials, and edited the manuscript. DIG designed
with the cutoffs abs(log2FC) greater than 1 and adjusted P value less the experiments, analyzed data, and wrote the manuscript.
than 0.05. Gene set enrichment analysis were performed using fGSEA
R package (https://doi.org/10.1101/060012) with hallmark gene sets Acknowledgments
from mouse MSigDB (48). Pathway enrichment analysis of differen- We thank Randal Kaufman (Sanford Brigham Prebys) and Deyu
tially expressed genes were conducted using g:Profiler (49). Sequences Fang (Northwestern University) for providing IRE1α × LysM-Cre
were deposited to the GEO database, accession number GSE179278. mice, and the AstraZeneca Production Informatics team for per-
Statistics. Statistical analyses were performed using 2-tailed forming RNAseq read alignment and qualification. This work
Student’s t test or Mann-Whitney U test and GraphPad Prism 8.4.2 was supported by NIH grants R01CA100062, RO1CA216936,
software (GraphPad Software Inc.). In experiments with more than 2 R01CA163910, R01CA227629, and CA218133, and the Wistar
variables, statistical analysis was performed using ANOVA test with Institute Animal and Flow cytometry core facilities under Cancer
correction for multiple variables. Tumor growth with repeated tumor Center support grant P30 CA010815.
measurements was evaluated using 2-way ANOVA test. All the data
are mean ± SEM and a P value less than 0.05 is considered significant. Address correspondence to: Dmitry I. Gabrilovich, AstraZene-
Study approval. Mouse experiments were approved by the IACUC ca, One Medimmune Way, Gaithersburg, Maryland 20878 USA.
of The Wistar Institute and AstraZeneca. Email: dmitry.gabrilovich@astrazeneca.com.
Author contributions SG’s present address is: Cedars-Sinai Medical Center, Departments
ENT performed experiments and wrote the manuscript. SH per- of Medicine and Biomedical Sciences, Los Angeles, California, USA.
formed experiments and analyzed data. AH, DC, CC, AL, FP, SH,
BD, KCH, and KM performed experiments. GK and TWFS ana- CHAT’s and CCAH’s present address is: Houston Methodist
lyzed data. CHAT performed experiments and edited the manu- Cancer Center, Houston Methodist Academic Institute, Hous-
script. CCAH participated in the design of experiments and edited ton, Texas, USA.
1. Veglia F, et al. Myeloid-derived suppressor cells 11. Condamine T, et al. ER stress regulates 2019;4(42):eaax8189.
coming of age. Nat Immunol. 2018;19(2):108–119. myeloid-derived suppressor cell fate through 21. Wu J, et al. ATF6alpha optimizes long-term endo-
2. Schrijver IT, et al. Myeloid-derived suppressor TRAIL-R-mediated apoptosis. J Clin Invest. plasmic reticulum function to protect cells from
cells in sepsis. Front Immunol. 2019;10:327. 2014;124(6):2626–2639. chronic stress. Dev Cell. 2007;13(3):351–364.
3. Penaloza HF, et al. The role of myeloid-derived 12. Thevenot PT, et al. The stress-response sensor 22. Shoulders MD, et al. Stress-independent activa-
suppressor cells in chronic infectious diseases chop regulates the function and accumulation tion of XBP1s and/or ATF6 reveals three func-
and the current methodology available for their of myeloid-derived suppressor cells in tumors. tionally diverse ER proteostasis environments.
study. J Leukoc Biol. 2019;105(5):857–872. Immunity. 2014;41(3):389–401. Cell Rep. 2013;3(4):1279–1292.
4. Safarzadeh E, et al. Myeloid-derived suppres- 13. Nan J, et al. Endoplasmic reticulum stress 23. Lee K, et al. IRE1-mediated unconvention-
sor cells: Important contributors to tumor induced LOX-1+ CD15+ polymorphonuclear al mRNA splicing and S2P-mediated ATF6
progression and metastasis. J Cell Physiol. myeloid-derived suppressor cells in hepatocellu- cleavage merge to regulate XBP1 in signaling
2018;233(4):3024–3036. lar carcinoma. Immunology. 2018;154(1):144–155. the unfolded protein response. Genes Dev.
5. Gabrilovich DI. Myeloid-derived suppressor cells. 14. Yoshida H. ER stress and diseases. FEBS J. 2002;16(4):452–466.
Cancer Immunol Res. 2017;5(1):3–8. 2007;274(3):630–658. 24. Yamamoto K, et al. Transcriptional induction of
6. Bronte V, et al. Recommendations for 15. Holcik M, Sonenberg N. Translational control mammalian ER quality control proteins is medi-
myeloid-derived suppressor cell nomenclature in stress and apoptosis. Nat Rev Mol Cell Biol. ated by single or combined action of ATF6alpha
and characterization standards. Nat Commun. 2005;6(4):318–327. and XBP1. Dev Cell. 2007;13(3):365–376.
2016;7:12150. 16. Ron D, Walter P. Signal integration in the endo- 25. Jonikas MC, et al. Comprehensive charac-
7. Condamine T, et al. Lectin-type oxidized LDL plasmic reticulum unfolded protein response. terization of genes required for protein fold-
receptor-1 distinguishes population of human Nat Rev Mol Cell Biol. 2007;8(7):519–529. ing in the endoplasmic reticulum. Science.
polymorphonuclear myeloid-derived sup- 17. Claudio N, et al. Mapping the crossroads of 2009;323(5922):1693–1697.
pressor cells in cancer patients. Sci Immunol. immune activation and cellular stress response 26. Nakamura K, et al. Antibiotic pretreatment
2016;1(2):aaf8943. pathways. EMBO J. 2013;32(9):1214–1224. alleviates liver transplant damage in mice and
8. Mastio J, et al. Identification of monocyte-like 18. Wherry EJ, et al. Antigen-independent mem- humans. J Clin Invest. 2019;129(8):3420–3434.
precursors of granulocytes in cancer as a mech- ory CD8 T cells do not develop during chron- 27. Karupiah G, et al. Inhibition of viral replication
anism for accumulation of PMN-MDSCs. J Exp ic viral infection. Proc Natl Acad Sci U S A. by interferon-gamma-induced nitric oxide syn-
Med. 2019;216(9):2150–2169. 2004;101(45):16004–16009. thase. Science. 1993;261(5127):1445–1448.
9. Gato M, et al. Drafting the proteome landscape 19. Norris BA, et al. Chronic but not acute virus infec- 28. Weizman OE, et al. ILC1 confer early host pro-
of myeloid-derived suppressor cells. Proteomics. tion induces sustained expansion of myeloid tection at initial sites of viral infection. Cell.
2016;16(2):367–378. suppressor cell numbers that inhibit viral-specific 2017;171(4):795–808.
10. Veglia F, et al. Myeloid-derived suppressor cells in T cell immunity. Immunity. 2013;38(2):309–321. 29. Gotthardt D, Sexl V. STATs in NK-cells: the
the era of increasing myeloid cell diversity [pub- 20. Halaby MJ, et al. GCN2 drives macrophage good, the bad, and the ugly. Front Immunol.
lished online February 1, 2021]. Nat Rev Immunol. and MDSC function and immunosuppression 2016;7:694.
https://doi.org/10.1038/s41577-020-00490-y. in the tumor microenvironment. Sci Immunol. 30. Croen KD. Evidence for antiviral effect of nitric
J Clin Invest. 2021;131(16):e145971 https://doi.org/10.1172/JCI145971 13RESEARCH ARTICLE The Journal of Clinical Investigation
oxide. Inhibition of herpes simplex virus type 1 MAF. Immunity. 2017;47(2):235–250. 43. Chang CJ, et al. Targeting tumor-infiltrating
replication. J Clin Invest. 1993;91(6):2446–2452. 37. Ribechini E, et al. Novel GM-CSF signals Ly6G+ myeloid cells improves sorafenib efficacy
31. Goldszmid RS, et al. NK cell-derived interferon-γ via IFN-γR/IRF-1 and AKT/mTOR license in mouse orthotopic hepatocellular carcinoma.
orchestrates cellular dynamics and the differenti- monocytes for suppressor function. Blood Adv. Int J Cancer. 2018;142(9):1878–1889.
ation of monocytes into dendritic cells at the site 2017;1(14):947–960. 44. Granot Z. Neutrophils as a therapeutic target in
of infection. Immunity. 2012;36(6):1047–1059. 38. Zhan X, et al. IFN-γ differentially regulates sub- cancer. Front Immunol. 2019;10:1710.
32. Martin-Fontecha A, et al. Induced recruit- sets of Gr-1(+)CD11b(+) myeloid cells in chronic 45. Ingram JP, et al. A nonpyroptotic IFN-γ-triggered
ment of NK cells to lymph nodes provides inflammation. Mol Immunol. 2015;66(2):451–462. cell death mechanism in nonphagocytic cells
IFN-gamma for T(H)1 priming. Nat Immunol. 39. Forghani P, et al. Properties of immature promotes salmonella clearance in vivo. J Immunol.
2004;5(12):1260–1265. myeloid progenitors with nitric-oxide-depen- 2018;200(10):3626–3634.
33. Schroder K, et al. Interferon-gamma: an overview dent immunosuppressive activity isolated from 46. Dobin A, et al. STAR: ultrafast universal RNA-seq
of signals, mechanisms and functions. J Leukoc bone marrow of tumor-free mice. PLoS One. aligner. Bioinformatics. 2013;29(1):15–21.
Biol. 2004;75(2):163–189. 2013;8(7):e64837. 47. Love MI, et al. Moderated estimation of fold
34. MacMicking J, et al. Nitric oxide and macrophage 40. Marigo I, et al. Tumor-induced tolerance change and dispersion for RNA-seq data with
function. Annu Rev Immunol. 1997;15:323–350. and immune suppression depend on the DESeq2. Genome Biol. 2014;15(12):550.
35. Drevets DA, et al. Complement receptor type C/EBPbeta transcription factor. Immunity. 48. Subramanian A, et al. Gene set enrichment analy-
3 mediates phagocytosis and killing of Listeria 2010;32(6):790–802. sis: a knowledge-based approach for interpreting
monocytogenes by a TNF-alpha- and IFN- 41. Condamine T, et al. Transcriptional regulation of genome-wide expression profiles. Proc Natl Acad
gamma-stimulated macrophage precursor myeloid-derived suppressor cells. J Leukoc Biol. Sci U S A. 2005;102(43):15545–15550.
hybrid. Cell Immunol. 1996;169(1):1–6. 2015;98(6):913–922. 49. Raudvere U, et al. g:Profiler: a web server for
36. Kang K, et al. Interferon-γ represses M2 gene 42. Veglia F, et al. Fatty acid transport protein 2 functional enrichment analysis and conversions
expression in human macrophages by disassem- reprograms neutrophils in cancer. Nature. of gene lists (2019 update). Nucleic Acids Res.
bling enhancers bound by the transcription factor 2019;569(7754):73–78. 2019;47(W1):W191–W198.
14 J Clin Invest. 2021;131(16):e145971 https://doi.org/10.1172/JCI145971You can also read