A new ultradian rhythm in mammalian cell dry mass observed by holography
←
→
Page content transcription
If your browser does not render page correctly, please read the page content below
www.nature.com/scientificreports
OPEN A new ultradian rhythm
in mammalian cell dry mass
observed by holography
Lamya Ghenim1,2*, Cédric Allier3, Patricia Obeid2, Lionel Hervé3, Jean‑Yves Fortin4,
Maxim Balakirev2 & Xavier Gidrol2*
We have discovered a new 4 h ultradian rhythm that occurs during the interphase of the cell cycle
in a wide range of individual mammalian cells, including both primary and transformed cells. The
rhythm was detected by holographic lens-free microscopy that follows the histories of the dry mass of
thousands of single live cells simultaneously, each at a resolution of five minutes. It was vital that the
rhythm was observed in inherently heterogeneous cell populations, thus eliminating synchronization
and labeling bias. The rhythm is independent of circadian rhythm, and is temperature-compensated.
We show that the amplitude of the fundamental frequency provides a way to quantify the effects
of, chemical reagents on cells, thus shedding light on its mechanism. The rhythm is suppressed by
proteostasis disruptors and is detected only in proliferating cells, suggesting that it represents a
massive degradation and re-synthesis of protein every 4 h in growing cells.
Spatiotemporal order in a living system is believed to be a result of nonlinear chemical reactions and high
variability. This leads to the generation of periodic oscillations that are characterized by a central timekeeping
mechanism, which is defined as a clock for biological p rocesses1. These rhythms allow organisms to adaptively
cope with changing environments, such as the circadian clock imposed by Earth, thus conferring robustness and
a competitive advantage. Many periodic biological processes have been described such as circadian rhythms,
ultradian rhythms (periods shorter than a day) and the cell cycle. Some of the processes are endogenous, whereas
others may be driven by external cues at the level of the organism. Nevertheless, the basic pacemaker of biologi-
cal clocks appears to reside on a cellular level and is integrated into molecular networks of the cell. Studies in
cultured cells have significantly advanced our understanding of the molecular mechanisms of the cell cycle and,
more recently, of other cell-autonomous biological clocks. To detect periodicity in cell behavior, the expression
of specific genes is usually measured by biochemical sampling or by using specific luminescent markers. Because
the individual rhythms in a cell population are out of phase, they need to be synchronized by using an external
stimulus. As a result, the most common approaches to studying biological clocks have a poor time resolution
and may suffer from artifacts introduced by labeling or synchronization. On the other hand, our ability to study
single-cell dynamics in asynchronous culture has been limited by the availability of quantitative phase imaging
techniques for simultaneous, time-resolved, single-cell data acquisition from thousands of cells in parallel. Large
population sampling is required to overcome the complex "noisy" behavior of a single cell and determine the
standard characteristics of cell dynamics.
Recently, we have described a lens-free microscopy technique that allows real-time measurements of dry
mass with a precision of approximately 35 pg. It is based on holographic interferences between the optical path
that are propagated through a pinhole and waves scattered by the cell. The dry mass of the cell is calculated by
integrating the phase of the diffracted light over the whole area of the cell2. Compared to conventional optical
methods, lens-free microscopy provides a unique way to track thousands of live cells in real time and with a
large field of view (30 mm2) without any labeling or synchronization. In the present work, we use this technique
to demonstrate periodic oscillations in the cell dry mass (Fig. 1a). In the raw signal these are superimposed on
a linear background that reflects cell growth.
1
Univ. Grenoble Alpes, CNRS, CEA, INSERM, IRIG, Biomics, 38000 Grenoble, France. 2Univ. Grenoble Alpes,
CEA, INSERM, IRIG, Biomics, 38000 Grenoble, France. 3Univ. Grenoble Alpes, CEA, LETI, 38054 Grenoble,
France. 4Laboratoire de Physique et Chimie Théoriques CNRS UMR7019, Université de Lorraine, 1 Boulevard
des Aiguillettes, BP 70239, 54506 Vandoeuvre‑lès‑Nancy Cedex, France. *email: lamya.ghenim@cea.fr;
xavier.gidrol@cea.fr
Scientific Reports | (2021) 11:1290 | https://doi.org/10.1038/s41598-020-79661-9 1
Vol.:(0123456789)
www.nature.com/scientificreports/

                                            Figure 1.  A new ultradian rhythm in mammalian cells. (a) Schematic view of the experimental approach
                                            (see “Materials and methods” for details). (b) Individual histories of the dry mass of two individual mouse
                                            embryonic fibroblast (MEF) cells are shown during the cell cycle interphase. (c) Fourier amplitudes of the dry
                                            mass traces as a function of frequency averaged over 702 MEF cells. First sharp peak (asterisk) of the dominant
                                            frequency of 0.004 min−1 along with its higher harmonics is clearly distinguished from the background 1/f
                                            noise. (d) Reconstruction of the signal of dry mass (pg) by means of an inverse Fourier transform (two possible
                                            solutions). (e) The 4 h rhythm observed in various mammalian cell lines. The inserts show the distributions of
                                            the cell cycle lengths, the median cell cycle length is indicated in the insert.

                                            Results
                                            We tracked thousands of live cells, taking images every 5 min over several days without labeling or synchroniza-
                                            tion. The reconstructed phase signals for individual cells were used for cell segmentation and calculation of the
                                            cell dry mass (Supplementary Figs. S1–S4)2. Mitotic events and the cell cycle duration were determined from
                                            abrupt changes in the cell dry mass concomitant with the appearance of a new cell trajectory (Supplementary

          Scientific Reports |   (2021) 11:1290 |               https://doi.org/10.1038/s41598-020-79661-9                                                    2

Vol:.(1234567890)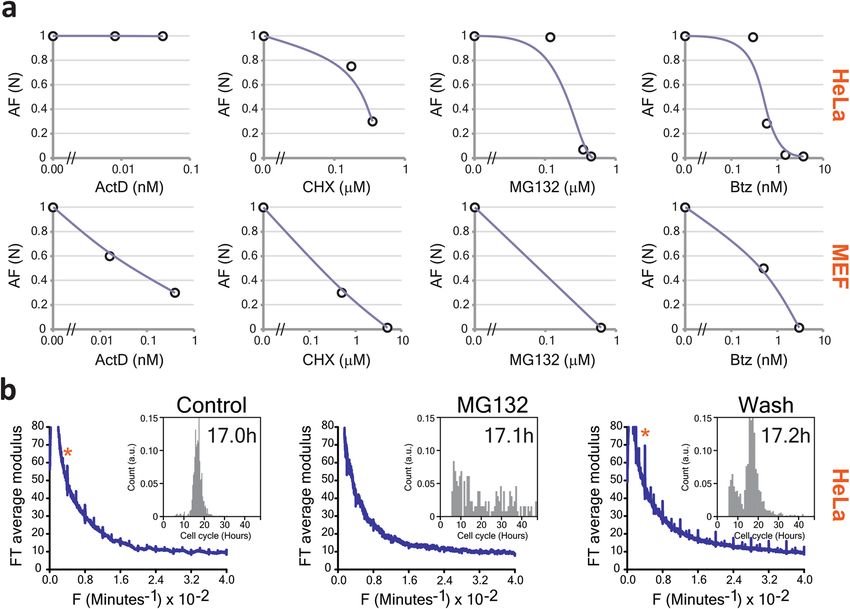
www.nature.com/scientificreports/
Figure 2. Effect of the cell cycle manipulation on the rhythm. (a) Synchronization of HeLa cells using a
double thymidine block does not affect the rhythm. The inserts show cell growth curves for the control and
synchronized cells plotted using the data from direct cell counts by lens-free microscopy. (b) Comparison
of HeLa cells at 34 °C (top) and 39 °C (bottom). The characteristic frequency of the rhythm does not change
despite the significant change in the cell cycle length (inserts). (c) Serum starvation eliminates the 4 h rhythm.
The inserts show cell counts in control (top) and serum starvation (bottom) conditions.
Fig. S3). Cell dry mass dynamics were analyzed during the interphase, from the first detected mitotic event
until the following, or until the track was lost. For each cell, we computed the Fourier transform (FT) of the dry
mass change during the interphase trajectory. The averaged absolute amplitude was normalized by trace length.
The dry mass history in mouse embryonic fibroblasts (MEFs) revealed a dominant frequency of 0.004 min−1,
and higher harmonics, superimposed on 1/f noise (Figs. 1b,c). Reconstruction of the signal by applying an
inverse Fourier transform to exclude the noise, reveals periodic symmetric spikes, 30 min wide, every 4.17 h
(SD = 0.0039 h) (Fig. 1d and Supplementary Fig. S5). In Hela, U2OS, MEF, CHO-K1, NHEK and NHDF cells we
also observed the same principal frequency of 0.004 min−1 (Fig. 1e). The amplitude of the dry mass change was
approximately 100 pg in MEF cells; three times the method precision (Fig. 1d). Examination of experimental
conditions and analysis of a random dataset ruled out artifacts (Supplementary Figs. S6a,c). Similarly, no oscil-
lations were found when the cells were fixed (Supplementary Fig. S6b). The frequency emerged from 1/f noise
only when more than 100 living cells were analyzed (Supplementary Fig. S6b).
Role of cell cycle and circadian oscillators. So far, we have seen that the 4 h rhythm in cell dry mass
seems to be general in mammalian cells. A priori, this could be a distinct ultradian rhythm or simply a harmonic
of a longer-period biological clock such as the circadian rhythm or the cell cycle. We therefore investigated
potential links between the 4 h rhythm and these oscillators. Synchronization did not significantly change the
period or the amplitude of the rhythm (Fig. 2a). Despite the variability in cell cycle duration, each cell line
showed the same oscillation period suggesting the rhythm was not a cell-cycle harmonic (Fig. 1e). Furthermore,
varying the temperature from 34 to 39 °C significantly influenced the cell cycle length in HeLa and CHO-K1
cells, while leaving the period of dry mass oscillation unchanged (Figs. 2b, 3c,d). Thus, unlike the cell cycle, the
rhythm showed perfect temperature compensation, a hallmark of a biological c lock3–6. We used serum starvation
to induce G0/G1 cell cycle arrest in HeLa cells. Over 48 h the cells, while still alive, gradually ceased proliferating
and the rhythm disappeared (Fig. 2c). For HeLa cells arrested in the G2/M phase by knocking down the KIF11/
EG5 gene, the rhythm was also suppressed (Fig. 3a, Supplementary Fig. S7 and Supplementary Movie S1). By
contrast, in MEF cells, the mitotic arrest induced by KIF11 knockdown was not as efficient and the rhythm
remained (Fig. 3b and Supplementary Movie S2). Next, we examined the temperature-sensitive CHO-K1 cell
lines tsTM3 and tsTM18, which carry mutations in ubiquitin-activating enzyme UBA1 and replication regula-
tor SMU1, respectively, and are known to undergo S-G2 or S and G2 cell cycle arrests at the non-permissive
temperature of 39 °C7,8. We found that, contrary to wild-type CHO-K1 cells, both mutants displayed the 4 h
rhythm only at the permissive temperature of 34 °C (Fig. 3c,d). Therefore, while not a direct consequence of the
cell cycle, the oscillations are a feature of proliferating cells. Finally, to address the role of circadian rhythms we
knocked down CLOCK, a key circadian regulator, in MEF and U2OS cells, and found no effect on the oscilla-
tions (Fig. 3e,f and Supplementary Fig. S7). Thus, despite being temperature-compensated and an integer sub-
multiple of 24 h, the 4 h rhythm does not seem to be a circadian harmonic. Taken together, these results strongly
suggest that the periodic changes in cell dry mass represent a new ultradian rhythm in growing cells.
Scientific Reports | (2021) 11:1290 | https://doi.org/10.1038/s41598-020-79661-9 3
Vol.:(0123456789)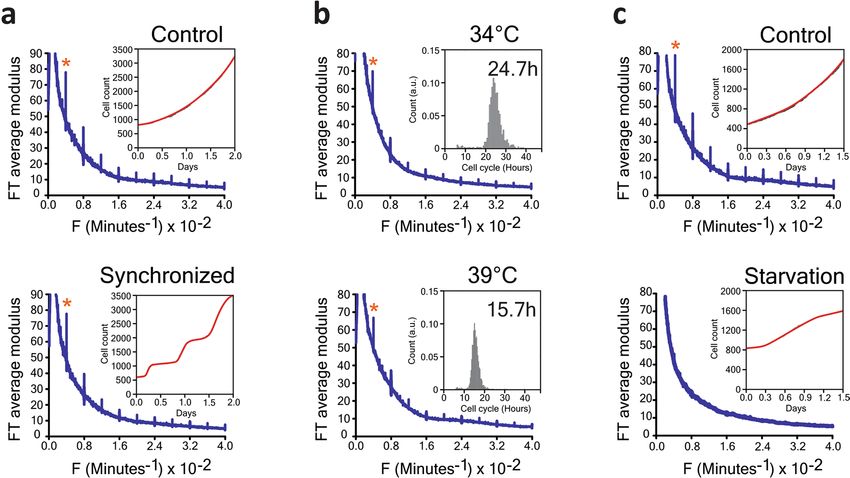
www.nature.com/scientificreports/
Figure 3. Relationship between the rhythm, cell cycle and circadian clock. (a) Cell cycle arrest by siKIF11
treatment in HeLa cells suppresses the 4 h rhythm. Western blots (in insert) confirm the inhibition of KIF11
expression (the effect of two specific siRNAs is compared to non-specific siCTR). (b) Incomplete cell cycle
arrest by siKIF11 in MEF cells does not suppress the 4 h rhythm. Quantitative PCR analysis (in insert) shows
the inhibition of KIF11 expression by two specific siRNAs in MEF. To the right of (a) and (b) we show the
distributions of the cell cycle lengths corresponding to the two data sets. (d) Effects of cell cycle inhibition in
temperature-sensitive CHO-K1 mutants at 39 °C, compared to the permissive 34 °C temperature (c). Cell cycle
arrest in temperature-sensitive CHO-K1 mutants at 39 °C suppresses the 4 h rhythm. To the right of (c) and
(d) we show the distributions of the cell cycle lengths for the three cell types. (c) Effect of circadian rhythm
inhibition by siCLOCK in (e) MEF and (f) U2OS. Knocking down CLOCK does not eliminate the rhythm in
MEF and U2OS. The Western blots (see inserts) show the inhibition of CLOCK expression by siCLOCK 1 and
2 in MEF and U2OS cells. To the right of (e) and (f) we show the corresponding distributions of the cell cycle
lengths.
Role of cell machineries. Proteins represent more than half of the cell dry mass, followed by nucleic acids
(~ 15%), lipids (~ 10%) and sugars9,10. The periodic change in the dry mass might result from the synthesis/
degradation of these molecules or from their transport in or out of the cell. To obtain more information on
molecular mechanisms, we used: (i) actinomycin D (ActD) to inhibit transcription, (ii) cycloheximide (CHX)
to inhibit protein synthesis, and (iii) proteasome inhibitors MG132 and bortezomib (Btz) to block ubiquitin-
dependent protein degradation. To analyze the drug response, we used the average Fourier amplitude of the
fundamental peak (AF) to define the oscillator strength. This parameter showed very little variability within
Scientific Reports | (2021) 11:1290 | https://doi.org/10.1038/s41598-020-79661-9 4
Vol:.(1234567890)www.nature.com/scientificreports/
Figure 4. Effect of different inhibitors on the rhythm. (a) Effect of different inhibitors on the rhythm measured
by the amplitude of the fundamental peak at 0.004 min−1 in Hela (first row) and MEF (second row). (b)
Inhibition of the 4 h rhythm by MG132 is reversible. Compared to control conditions (left panel), treatment
of HeLa cells with 0.45 μM of MG132 for 24 h completely suppressed the rhythm (middle panel). Subsequent
removal of the MG132 by rinsing restored the oscillations with increased amplitude (right panel). The inserts
show the distributions of the cell cycle lengths.
a cell batch, providing a reliable and quantitative measure of the inhibition effect (Supplementary Fig. S8).
Since the rhythm appears in proliferating cells (Figs. 2c, 3a,c,d), its inhibition by drugs could be either direct,
or through the cell cycle arrest. To exclude the latter, we analyzed only cell trajectories between two mitotic
events. The drugs decreased the oscillator strength in MEF and HeLa cells, while the periodicity was unchanged
(Fig. 4a). Transcription inhibition with ActD failed to arrest the 4 h rhythm in MEF cells, even at the highest
dose that induced ~ 50% cell mortality (Fig. 4a and Supplementary Fig. S9). In contrast, inhibition of either
protein synthesis (CHX) or degradation (MG132 and Btz) completely suppressed the rhythm with relatively
low cytotoxicity (Fig. 4a and Supplementary Fig. S9). Similarly, in HeLa cells, virtually nontoxic doses of CHX
or Btz eliminated the 4 h rhythm, while ActD showed no significant effect (Fig. 4a). MG132 also arrested the
rhythm in HeLa cells albeit with significant cytotoxicity (~ 50% cell death, Supplementary Fig. S9). Therefore, the
oscillations of the cell dry mass are particularly sensitive to proteostasis inhibition and may represent changes in
protein level during cell growth. The effect of Btz was the most remarkable; the rhythm is already suppressed at
0.6 nM, the Ki value for the 20S proteasome (Fig. 4a)11. The removal of proteasome inhibitor restored the rhythm
with, strikingly, an increased amplitude: the transient proteasome inhibition must either increase the amplitude
of protein pulses or induce more cells to oscillate (Fig. 4b). We argue therefore that the proteasome is one of the
main molecular machineries regulating the 4 h ultradian rhythm.
Discussion
Periodic changes in protein levels have been shown previously; the best known example is the oscillations of the
key regulators of the cell cycle9,12,13. Recent proteomics studies suggested that the abundance of more than 10%
of cellular proteins are subject to the 24 h circadian rhythm14. Higher frequency ultradian oscillations have also
been reported. In the early 1960s, Brodsky and collaborators, by analyzing the incorporation of radioactively
labeled amino acids into cellular proteins, suggested a periodicity of one to two hours in the protein synthesis
rate15. The same authors have reported the observation of ultradian dry mass oscillation in retinal ganglion
cells, as observed by interferometry15. In the last decade, ultradian oscillators originating in transcriptional-
translational-posttranslational feedback loops have been discovered for transcription factors p53, Hes1, and
NFkB16–18. Notably, there was a change in the level of the proteins implicated in these signaling circuits, which
have periods between 2 and 6 h. More recently, the oscillations of another transcriptional regulator, XBP1, has
Scientific Reports | (2021) 11:1290 | https://doi.org/10.1038/s41598-020-79661-9 5
Vol.:(0123456789)www.nature.com/scientificreports/
been shown to coordinate a new 12 h ultradian rhythm19. Very recently, Liu et al.20 reported repetitive dips in the
coefficient of variation (CV) of the cell growth rate in HeLa cells. The authors used quantitative phase micros-
copy interferometry to measure the dry mass of the cells during the cell cycle at a 30 min time resolution. They
tentatively suggested that the dips in the cell growth rate CV might reflect a novel oscillatory circuit in protein
synthesis/degradation that is intrinsic to cell growth rate regulation. Although the reported periodicity was close
to 4 h, it was significantly temperature dependent: 4.7 h at 33 °C and 5.8 h at 36 °C.
The 4 h r hythm21 we describe here differs, however, in several important ways from the previous observations.
First, it appears to be cell-autonomous, robust and universal, as it was found in all cultured mammalian cells we
examined. The rhythm is present in asynchronous cell cultures growing in standard conditions, and no additional
stimuli are required to trigger it. Second, the 4 h rhythm is not limited to a few specific proteins; rather, it involves
global changes in the total mass of cell constituents. Third, the 4 h rhythm is temperature-compensated; this was
not the case for the ultradian rhythms mentioned above. Finally, our analysis with the inverse Fourier transform
indicates that the 4 h rhythm has a particular nonsinusoidal waveform, where the long delay periods are followed
by rapid (~ 30 min) symmetric changes in the cell dry mass (Fig. 1d). This pulsatile dynamics may explain why
the rhythm was not observed in previous works that used lower time resolution (> 30 min) in sampling. We also
needed to follow hundreds of cells in parallel to begin to see this periodic signal, which required quantitative
phase imaging techniques with a large field of vision.
Our results give a first glimpse into the underlying mechanism of the 4 h oscillator. The rhythm disruption by
proteasome inhibition and its stimulation upon inhibitor removal suggests that the proteasome is implicated in
oscillator regulation. This is not surprising, as the proteasome degrades key pacemaker proteins, meaning that
it has an essential role in almost all reported biological rhythms. The universality and the amplitude of the mass
oscillations we see (Fig. 1) suggest that the proteasome, by itself, is a 4 h rhythm pacemaker, and its activity is
responsible for pulsatile dynamics of the total mass of proteins. The existence of posttranslational proteasome-
based oscillators has been predicted previously by mathematical models that comprise both protein synthesis and
degradation22–25. It should be noted that our analysis cannot determine whether the dry mass is rising during the
pulses as a result of increased synthesis or is dropping because of accelerated degradation (Fig. 1d). Even though
both possibilities remain, the second hypothesis seems more thermodynamically likely.
Another aspect of the 4 h rhythm is that it is linked to the cell cycle. Curiously, pioneering work by Klevecz
suggested that endogenous oscillations in protein synthesis set the generation time of the cell cycle as a multiple
of a fundamental 4 h period26,27. This ultradian oscillator was found to be temperature compensated26. Lloyd and
Volkov later proposed a mathematical model for the cell cycle to explain these results. This model included a
fast ultradian component with pulsatile dynamics that were similar to what we see in our reconstructed signal28.
Therefore, the 4 h rhythm we describe here may reflect the same timekeeping mechanism that regulates cell
growth during interphase and dictates cell cycle duration. Although we found that the inhibition of the 4 h
rhythm with low doses of proteasome inhibitors did not block ongoing cell division, it certainly prevented
subsequent mitosis because the cultures finally stopped growing (Supplementary Fig. S10). Furthermore, the
suppression of the 4 h rhythm following cell cycle arrest suggests a coupling of the two oscillators. Finally, as the
proteasome is the ultimate regulator of cyclin/CDK machinery, our conclusions should be compatible with the
current models of cell cycle regulation.
Materials and methods
Cells. Neither animal subjects nor human research participants were included or used in this study.
Cell culture. HeLa cells were cultured in high glucose DMEM supplemented with GlutaMAX, pyruvate, and
10% calf serum (Gibco). NHEK cells (Lonza) were cultured in KBM-gold Bulletkit (Lonza) and were passaged
with the ReagentPackSubculture reagents (Lonza). NHDF-Ad-Der Fibroblasts FGM-2 cells (Lonza) were cul-
tured in FGM-2 BulletKit (Lonza) and were passaged with the ReagentPack Subculture Reagents (Lonza). U2OS
cells (ATCC) were cultured in McCoy’s 5A medium (ATCC) and 10% calf serum. Mouse Embryonic Fibroblasts
(C3H/10T1/2 clone 8, ATCC) were cultured in Eagle’s Minimum Essential Medium (EMEM; ATCC) and sup-
plemented with 10% calf serum. CHOK1-WT, TSTM3 and TSTM18 (Research Center for Radiation Protection,
Chiba, Japan) were cultured in Nutrient Mixture F-12 Ham (SIGMA) supplemented with 1 mM l-glutamine
(SIGMA) and 10% calf serum. All media was supplemented with 1% Penicillin/Streptomycin (Invitrogen).
Cytotoxicity assays: determination of LD50 by dose response. LD50 was determined by testing
in duplicate the drugs at different concentrations on cells seeded 24 h, in 96-well plates, prior to drug treatment.
CellEvent Caspase-3/7 Green Detection Reagent (Invitrogen, Ref. C10423, C10723) was added, to each well,
directly with the drug mixture in a final concentration of 2 µM per well. 24 and 48 h after drug and treatment
with the CellEvent Caspase-3/7 reagent, cells were counterstained with Hoechst. Images were acquired using a
High Content CellInsight NXT HCA automated microscope (Thermo Scientific). Analysis was performed using
R software29 and the percentage of dead cell was evaluated based on negative control levels. The real time imag-
ing experiments with cells treated with different drugs were then performed during 48 h at concentrations much
below the concentration that induces 50% mortality.
Drug washout experiments. All drugs were prepared first in DMSO (Sigma-Aldrich). The cells were
treated with drugs 24 h after being seeded and grown at 37 °C. To inhibit transcription, Mouse Embryonic Fibro-
blasts and HeLa cells were treated respectively with 0.016 nM, 0.4 nM and 0.008 nM, 0.04 nM of Actinomycin
respectively. To inhibit translation HeLa cells and Mouse Embryonic Fibroblasts were treated respectively with
0.175 µM, 0.35 µM and 0.5 µM, 5 µM of Cycloheximide respectively. To inhibit protein degradation HeLa and
Scientific Reports | (2021) 11:1290 | https://doi.org/10.1038/s41598-020-79661-9 6
Vol:.(1234567890)www.nature.com/scientificreports/
MEF were treated respectively with 0.3 nM, 0.6 nM, 3.75 nM, 5 nM and 0.5 nM, 3 nM of Bortezomib. Otherwise,
to inhibit protein degradation HeLa and MEF cells were treated respectively with 0.12 µM, 0.35 µM 0.45 µM,
and 0.62 µM of MG132. To reverse the inhibition of protein degradation, HeLa cells were washed out three times
with a medium without drugs.
Small interfering RNA transfection. RNAi screens were performed in 6-well plates and three Fibronec-
tin (F1141-5MG from Sigma Aldrich) coated 35 mm glass bottom dishes (ref 150682 Thermo Scientific). RNA
interference against EG5 (ref Qiagen Hs_KIF11_6 Cat N°./ID: SI02653693, Mm_Kif11_3 FlexiTube siRNA
(5 nmol) Cat N°./ID: SI01082389, Mm_Kif11_2 FlexiTube siRNA Cat No./ID: SI01082382), and against
Clock (Mm_Clock_6 FlexiTube siRNA Cat N°./ID: SI02707908; Mm_Clock_2 FlexiTube siRNA Cat N°./ID:
SI00168595) were performed with two independent siRNAs from Qiagen each, and each siRNA transfection
was repeated two times. As control we used siRNA AllStar negative control (AS) (Qiagen, Ref. 1027281). HeLa
and C3H10T1/2 cells (20,000 cells per petri dish and 80,000 cells per well) were seeded or plated in complete
medium 24 h before transfection. Transfection of these cells was performed using Lipofectamine RNAiMAX
reagent. The RNA-lipid complexes were prepared and then added to the cells. First, Lipofectamine RNAiMAX
Reagent was diluted in Opti-MEM Medium, second siRNA was diluted in the same solution. The two mix-
tures were incubated at room temperature for 10 min. Diluted siRNA was added to the diluted Lipofectamine
RNAiMAX Reagent and this mixture was then well homogenized and incubated for 15 min at room tempera-
ture. Finally, the siRNA-lipid complex was distributed on the cells. The final concentration of siRNA per well was
1–10 nM. The plates as well as the glass bottom dishes were placed in the incubator at 37 °C for 48 h. The glass
bottom dishes were placed on the lens-less microscopes for data acquisition within the incubator. The transfec-
tion was stopped after 48 h. The 6-well plates were used for the PCR and western blot experiments as controls of
the optical experiments.
Western Blot analysis. After 48 h in the incubator, cells in the 6-well plates were lysed using RIPA buffer
(Sigma, Ref. R0278) supplemented with Complete Mini Protease Inhibitor Cocktail (Sigma, Ref.P8340). The
buffer (50 µL) was added to each well and the plate was incubated at 4 °C for 30 min. The lysates are homog-
enized, collected and put in a 1.5 mL Eppendorf tube at 4 °C for another 15 min. Centrifugation was then done at
13,000 rpm for 15 min at 4 °C and the supernatant was taken and stored at − 20 °C while waiting for the protein
dosage. The protein dosage was done according to Pierce BCA Protein Assay Kit protocol (Thermo Scientific,
Ref.23227). The range of BCA was made from a commercial solution at 2 mg/mL. Dilutions are made in RIPA.
Quantification was done in duplicates with 5 µL samples and 100 µL BCA mix prepared according to the manu-
facturer’s protocol. The plate was then incubated for 45 min at 37 °C and the reading of the plate was performed
using the TECAN Infinite M1000 reader at 562 nm wavelengths. To examine the expression of the target genes,
the same amount of total protein was analyzed by western blot using target-specific antibodies. For siEG5 and
siClOCK experiments, 7 µg (protein samples) were subjected to polyacrylamide gel electrophoresis on NuPAGE
Novex 12% Bis–Tris Protein Gel (Life Technologies, Ref.NP0342BOX) in MES buffer. The separated proteins
were transferred onto a nitrocellulose membrane (D. Dutscher, Brumath, France) using iBlot 2 Transfer Stack
according to the manufacturer’s protocol. The membranes were blocked in 5% non-fat milk in Tris-buffered
saline, 0.1% Tween 20 (TBST, Sigma) for 1 h at room temperature (RT) and incubated with primary antibodies
diluted at 1:500 in 5% non-fat milk in TBS-T overnight at 4 °C. We used rabbit polyclonal antibodies directed
against human EG5 (1/1000, ab171963), rabbit polyclonal antibodies directed against human and mouse CLOCK
(1/2000, ab93804), mouse polyclonal antibodies against tubuline (1/2500, SIGMA T-6074) and actin (1/5000,
(H-196)) Santa Cruz Biotechnology Sc-7210 and rabbit polyclonal Anti-GAPDH [(FL-335) Santa Cruz Bio-
technology Sc-25778]. Membranes were washed three times for 10 min in TBS-T and incubated with second-
ary horseradish peroxidase-conjugated antibodies (anti-mouse or anti-rabbit, eBiosciences, Paris, France) at a
dilution of 1:10,000 in TBST for 1 h at room temperature. Membranes were washed three times for 10 min in
TBST. Detection was performed with an ECL Prime kit [SuperSignal West Pico PLUS Chemiluminescent Sub-
strate (Thermo Scientific, Ref.34577) and the SuperSignal West Femto Maximum Sensitivity Substrate (Thermo
Scientific, Ref.34095) according to the manufacturer’s guidelines]. Chemiluminescence was analyzed using a
ChemiDoc Touch Imaging System (BioRad, Marne-la-Coquette, France), and quantification of the intensity of
the bands was performed using the ImageLab Touch Software (BioRad).
Gene expression analysis by RT‑qPCR. The commercial RNeasy Plus Mini Kit (Qiagen, Ref.74136) was
used for total RNA extraction according to the manufacturer’s instructions. 48 h after the Embryonic Mouse
Fibroblasts (C3H/10T1/2 clone 8) (as above for invasion experiment) transfection with the siRNA EG5 (KIF11-2
and KIF11-3), the media was removed and the cells were lysed directly in the wells with 350 µL Buffer RLT sup-
plied by the kit. The total RNA was eluted in 40 µL of RNase-free water and the sample were stored at − 80 °C.
RNA concentration was measured using a Thermo Scientific NanoDrop 1000 Spectrophotometer (Thermo
Scientific). Then, 2 µg RNA were reverse-transcribed in a total volume of 20 μL using SuperScript IV VILO
Master Mix (Invitrogen, Ref.11756050) according to the manufacturer’s instructions. The cDNA was stored
at − 80 °C until further use. Reverse transcription reactions were diluted to 1/10 in RNAse free water and 3 µL
of the diluted cDNA was used for each quantitative PCR. qPCR was carried out using sequence-specific prim-
ers on a StepOnePlus RealTime PCR System (Applied Biosystems/Thermo Fisher Scientific) in 96-well plates
with SYBR Green dye (Platinum SYBR Green qPCR SuperMix-UDG, Thermo Scientific, Ref. 11733-046). All
experiments were run in triplicate, and the results were normalized to GAPDH gene (mKIF11-F1 and R1, Ref
804490-689.15 and mGAPD-HF1 and R1, Ref 804490-955.34, Eurogentec).
Scientific Reports | (2021) 11:1290 | https://doi.org/10.1038/s41598-020-79661-9 7
Vol.:(0123456789)www.nature.com/scientificreports/
Lens‑free microscopy and holographic reconstruction. Lens-free acquisitions were performed with
a Cytonote microscope (Iprasense, Montpellier, France). This setup is inspired by the lens-free imaging system
described in Ref.30, which was modified to perform continuous monitoring of cellular cultures inside an incuba-
tor at a controlled temperature and humidity2. Illumination is provided by a red LED (647 nm, FWHM 13 nm).
The light passes through a 150 µm pinhole at a distance of approximately 5 cm from the sample. The CMOS sen-
sor is in contact with the cell culture recipient at a distance of ∼ 1.5 mm (Supplementary Fig. S1).
In the absence of optics, the sample image is obtained by a reconstruction algorithm. For lens-free micros-
copy, the reconstruction problem is usually formulated under the first Born approximation31, which restricts the
solutions to low scattering objects. Under this approximation light transport is described by the Fresnel propa-
gator which can be analytically inverted. This propagator applied to the field of light in the sensor plane allows
estimating the field of light just after the object plane. However the reconstruction problem remains ill-posed
since the lens-free setup, in the absence of a reference arm, does not record completely the field of light in the
sensor plane but only its intensity. Yet the lack of phase information does not prevent from retrieving the sample
image. The problem can be tackled with the following inverse problem approach. Light is described as a complex
scalar field and its propagation from one plane to another is obtained using a convolution kernel hZ. Therefore,
if A0 is the complex field after the sample, the field AZ in the detector plane at the distance Z from the object is:
A0 = AZ ∗ hZ , (1)
where ‘*’ is the convolution operator. Here, we used a kernel hZ derived from Fresnel theory:
2
1 i�r
hZ = e Z (2)
iZ
i being the imaginary unit and r the spatial position in the horizontal plane. In the following, Z is assumed to
be known. In practice, it is estimated with a precision of approximately 10 μm by inspecting Z-stack of back-
propagated measurements. The convolution of Eq. (1) can be explicitly written as:
′
′
AZ �r = ∫ d�r A0 (�r ) · hZ �r − �r . (3)
The quantity measured by a standard detector is the intensity of √ the light field: IZ = |AZ |2, where the modulus
of Az is known but not
√its phase ϕ Z . Whatever the phase ϕZ , AZ = IZ .eiϕZ and the corresponding field A0 at the
sample plane, A0 = iϕ ∗ h−Z would perfectly match the data. The inverse problem approach consists
IZ .e Z
here in finding the phase ϕZ so that A0 (ϕZ ) minimize the total variation (TV) criterion ε(ϕZ ):
δA0 (�r ) δA0 (�r )
ε(ϕZ ) = ∫ d�r ε + | |+| |, (4)
δx δy
where ε is a small valued coefficient ( 10–4) used to make Eq. (4) differentiable and prevent division by 0 in the
gradient derivation presented afterwards. The second term is a L1-norm applied to the fields ( δAδx r ) δA0 ( r )
0 (
, δy ) which
promotes sparsity. The optimization is performed using the non-linear conjugate gradients iterative method as
described by the following pseudocode:
(k)
1. initialization k ← 0, D(k) ← 0, ϕZ ← 0
2. k ← k + 1
3. computation of gradient ∇ε (k), of advancement direction D(k) and advancement step σ (k)
(k) (k−1)
4. phase update: ϕZ ← ϕZ + σ (k) · D(k)
5. test of convergence, if not reached go back to 2/
The advancement direction D(k) is obtained by conjugating the gradient ∇ε (k) with the previous direction of
advancement D(k−1), using Hestenes-Stiefel formula32. The advancement step σ (k) is obtained by developing the
TV criterion at order 2 in the advancement direction (Hessian computation) and by minimizing a second-order
polynomial of variable σ (k). For the test of step 5/, we simply stop the algorithm when the number of iterations
reaches 15.
Supplementary Fig. S2 illustrates the holographic reconstruction process described here above. Supplemen-
tary Fig. S2a shows the full field of view of a raw acquisition of culture of HeLa cells. Based on this image the
holographic reconstruction produces a phase image of the cells as shown in Supplementary Fig. S2c. The recon-
structed phase image exhibits locally wrapped phase artefacts corresponding to cells that induce a phase shift
exceeding + π. In order to perform a simple phase unwrapping, we detect the contiguous pixels with phase value
below 0, and set these pixels to + π (Supplementary Fig. S2e).
Cell‑tracking. We used the Trackmate algorithm, an open source Fiji plugin for the automated tracking of
single particles33. The Trackmate Fiji plugin guides the user through several stages of the cell-tracking algorithm,
namely a cell detection stage, a cell tracker stage and several filters applied to the cell detections and the com-
puted tracks. We used the following parameters: the estimated blob diameter was set to ~ 15 pixels, the detector
threshold was set to 0.7, the linking maximum distance was set to 15 pixels (~ 25 µm), the gap-closing max
distance was set to 15 pixels, gap closing max frame gap to 5 and the filter number of spots on tracks was set to
Scientific Reports | (2021) 11:1290 | https://doi.org/10.1038/s41598-020-79661-9 8
Vol:.(1234567890)www.nature.com/scientificreports/
10. At the end of the cell-tracking process, results are generated in the form of text files. The output file ‘Spots in
tracks statistics’ contains a table listing all detected cells with their respective positions in the acquisition, their
frame number and their track number.
Cell dry mass calculation. The phase recovered from lens-free microscopy is proportional to the density
and thickness of the specimen layer34. A relation is defined between the phase shift and the optical path differ-
ence (OPD), which quantifies the integral of the sample object refractive index difference with respect to the
surrounding medium along the optical path:
(5)
ϕshift x, y = ϕ x, y − ϕmedium ,
ϕshift x, y h
OPD x, y = · ∫ n x, y, z − nmedium δz,
2π 0
where n is the local sample refractive index, nmedium is the surrounding medium refractive index, z is the position
along the optical axis, h is the thickness of the sample object and λ is the illumination wavelength. The OPD values
can be integrated over the total projected area S of the cell. Here we used the optical volume difference (OVD )
denomination introduced in Ref.35 to define this integral. It is expressed as a unit of volume in μm3:
OVD = ∫ OPD x, y ∂x∂y. (6)
S
To determine the cell area S, we used a seeded growing segmentation algorithm controlled by a single param-
eter, a phase threshold value which delineates the separation between the background and the cell area (see Sup-
plementary Fig. S3). A relationship between the phase shift measurement and the cell mass has been defined in
Refs.36,37 and can be used to convert OVD to cell dry mass (CDM ) measurements, the mass of the cellular content
except water. Under our notation, this relationship is simply given by:
OVD
CDM = , (7)
α
where α is the specific refractive increment which relates the refractive index change to increase in mass density.
There is a variety of substances within a cell. However the specific refractive index of these substances falls with
a narrow range and Barer36 defined an α constant of 0.18 µm3 pg−1 for most eukaryotic cells, taking into account
not only proteins, but also lipids, sugars, and nucleic acids.
To estimate the precision of the CDM measurement obtained by means the lens-free microscope we com-
pared the cell measurements with two other techniques: digital holographic microscopy (DHM) and quadriwave
lateral sheering interferometry (LSI). The measurements obtained with lens-free microcopy correlate linearly
with the measurements obtained with DHM and LSI (see Supplementary Fig. S4). It suggests that the lens-free
microcopy setup can be considered as a quantitative phase imaging technique for the measurements of adherent
cells. The values measured with lens-free microcopy are however under-estimated, they must be corrected by a
factor of ~ 1/0.65. This is due to the sparsity constraints used in the holographic reconstruction algorithm (see
Eq. 4) which reduces overall the phase signal. According to a methodology and the dataset described in Ref.34,
we can estimate the precisions of the CDM measurements obtained with the lens-free microscopy setup used
in this study to be about 35 pg.
Fourier transform and other spectral analysis algorithmes. The Fourier transform algorithm allows
real-time spectral analysis of the dry mass and help us to find the spectrum of possible periodic signals. We
compute the Fourier transform over the duration T(j) of our measurement of the dry mass of each cell j dur-
ing interphase. T(j) is defined to be the time between the two local spikes of dry m ass2 that correspond to the
successive divisions that delimit the interphase or, for incomplete cycles, the time from the first local spike of
dry mass until tracking of the cell is lost. After removing the background, the signal was convoluted with a sine
window function that vanishes at the limiting times. The FT was then performed for each frequency with an
increment equal to df(j) = 1/(T(j)*M) depending on cell j, where M is an integer corresponding to the chosen
resolution in frequency sampling. We fix M to be equal to 25 for all the samples. The set of all transforms was
analyzed statistically by computing the averaged absolute amplitude, as well as the standard deviation, in each
frequency bin df = nf/(Tmax*M). The averaged FT was performed using bins defined by the longest time duration
Tmax = max{T(j)}, and nf is an arbitrary positive integer, defining the size of the bin. In general, we take n
f = 1 or
2. The averaged absolute amplitude was properly normalized in order to take into account the different bin sizes
and lengths of the traces.
Repeatability of measurements of the period of the rhythm. We have repeated the control experi-
ments with more than 30 runs (all cells lines combined; see Supplementary Fig. S5 for an example). The experi-
ments comparing the effect of drugs were repeated two or three times independently for each drug concentra-
tion, type of cell (MEF and HeLa) and siRNA. The experiments testing temperature effects were repeated three
times independently for each temperature and cell-type (HeLa, CHOK1 and their mutants tsTM18, tsTM3). The
experiments on cell-cycle inhibitors were each repeated at least three times independently. In each experiment,
we followed a number of individual cells varying from 300 to 2400.
Scientific Reports | (2021) 11:1290 | https://doi.org/10.1038/s41598-020-79661-9 9
Vol.:(0123456789)www.nature.com/scientificreports/
Data availability
Data are available in the main text and in the supplementary materials. Image and trajectory data can be sup-
plied by request to the authors.
Received: 12 August 2020; Accepted: 10 December 2020
References
1. Novak, B. & Tyson, J. J. Design principles of biochemical oscillators. Nat. Rev. Mol. Cell Biol. 9, 981–991. https://doi.org/10.1038/
nrm2530 (2008).
2. Allier, C. et al. Imaging of dense cell cultures by multiwavelength lens-free video microscopy. Cytometry A. 91, 433–442. https://
doi.org/10.1002/cyto.a.23079(2017).
3. Brown, F. A., Jr., Hastings, J. W. & Palmer, J. D. The Biological Clock: Two Views (Academic Press, New York, 1970). https://doi.
org/10.1016/C2013-0-10434-5.
4. Tsuchiya, Y., Akashi, M. & Nishida, E. Temperature compensation and temperature resetting of circadian rhythms in mammalian
cultured fibroblasts. Genes Cells. 8, 713–720. https://doi.org/10.1046/j.1365-2443.2003.00669.x (2003).
5. Winfree, A. T. The geometry of biological time (ed. Marsden, J. E., Wiggins, S. & Sirovich L.) 1–779 (Springer, New York, 2001)
https://doi.org/10.1007/978-1-4757-3484-3.
6. Buzsaki, G. Rhytms of the Brain. 1–448 (Oxford University Press, Oxford, 2006). https://doi.org/10.1080/10874200902885993.
7. Sugaya, K., Ishihara, Y., Inoue, S. & Tsuji, H. Characterization of ubiquitin-activating enzyme Uba1 in the nucleus by its mam-
malian temperature-sensitive mutant. PLoS ONE 9(5), e96666. https://doi.org/10.1371/journal.pone.0096666 (2014).
8. Sugaya, K., Hongo, E. & Tsuji, H. A temperature-sensitive mutation in the WD repeat-containing protein Smu1 is related to
maintenance of chromosome integrity. Exp. Cell. Res. 306, 242–251. https://doi.org/10.1016/j.yexcr.2005.02.017 (2005).
9. Mitchinson, J. M. The Biology of the Cell Cycle (Cambridge University Press, Cambridge, 1971) https://doi.org/10.1113/expphysiol
.1972.sp002169.
10. Neidhardt, F. C., Ingraham, J. L. & Schaechter, M. Physiology of the Bacterial Cell. A Molecular Approach. 124–125 (Sinauer Associ-
ates, Sunderland, 1990). https://doi.org/10.1016/0307-4412(92)90139-D.
11. Adams, J. et al. Proteasome inhibitors: A novel class of potent and effective antitumor agents. Cancer Res. 59, 2615–2622 (1999).
12. Evans, T. et al. Cyclin: A protein specified by maternal mRNA in sea urchin eggs that is destroyed at each cleavage division. Cell
33, 389–396. https://doi.org/10.1016/0092-8674(83)90420-8 (1983).
13. Jackson, P. K. The hunt for cyclin. Cell 134, 199–202. https://doi.org/10.1016/j.cell.2008.07.011 (2008).
14. Wong, D. C. S. & O’Neill, J. S. Non-transcriptional processes in circadian rhythm generation. Curr. Opin. Physiol. 5, 117–132. https
://doi.org/10.1016/j.cophys.2018.10.003 (2018).
15. Brodsky, W. Y. Protein synthesis rhythm. J. Theor. Biol. 55, 167–200. https://doi.org/10.1016/s0022-5193(75)80115-9 (1975).
16. Hirata, H. et al. Oscillatory expression of the bHLH factor hes1 regulated by a negative feedback loop. Science 298, 840–843. https
://doi.org/10.1126/science.1074560 (2002).
17. Monk, N. A. M. Oscillatory expression of hes1, p53, and NF-κB driven by transcriptional time delays. Curr. Biol. 13, 1409–1413.
https://doi.org/10.1016/s0960-9822(03)00494-9 (2003).
18. Isomura, A. & Kageyama, R. Ultradian oscillations and pulses: Coordinating cellular responses and cell fate decisions. Develop-
ment. 141, 3627–3636. https://doi.org/10.1242/dev.104497 (2014).
19. Zhu, B. et al. A cell-autonomous mammalian 12 h clock coordinates metabolic and stress rhythms. Cell Metab. 25, 1305–1319.
https://doi.org/10.1016/j.cmet.2017.05.004 (2017).
20. Liu, X., Oh, S. & Kirschner, M. W. Optimization of quantitative phase microscopy reveals new features of the growth rate of adher-
ent mammalian cells. https://www.biorxiv.org/content/10.1101/631119v1 (2019).
21. Ghenim, L. et al. A new ultradian rhythm linked to protein degradation and synthesis in mammalian cells. https://www.biorx
iv.org/content/10.1101/2019.12.20.882811v1 (2019).
22. McClung, C. R. Circadian rhythms: Lost in post-translation. Curr. Biol. 1, R400–R402. https://doi.org/10.1016/j.cub.2011.04.024
(2011).
23. O’Neill, J. S. & Reddy, A. B. Circadian clocks in human red blood cells. Nature 469, 498–503. https://doi.org/10.1038/nature0970
2 (2011).
24. Lakin-Thomas, P. L. Transcriptional feedback oscillators: maybe, maybe not. J. Biol. Rhythms. 21, 83–92. https://doi.
org/10.1177/0748730405286102 (2006).
25. Xu, L. & Qu, Z. Roles of protein ubiquitination and degradation kinetics in biological oscillations. PLoS ONE 7, e34616. https://
doi.org/10.1371/journal.pone.0034616 (2012).
26. Klevecz, R. R. The clock in animal cells is a limit cycle oscillator. In Cell Reproduction (ed. Dirksen, E. R.) 139–146 (Academic
Press, New York) https://doi.org/10.1016/B978-0-12-217850-4.50018-6 (1978).
27. Klevecz, R. R. Quantized generation time in mammalian cells as an expression of the cellular clock. Proc. Natl. Acad. Sci. U. S. A.
73, 4012–4016. https://doi.org/10.1073/pnas.73.11.4012 (1976).
28. Lloyd, D. & Volkov, E. I. Quantized cell cycle times: interaction between a relaxation oscillator and ultradian clock pulses. Biosys-
tems. 23, 305–310. https://doi.org/10.1016/0303-2647(90)90012-p (1990).
29. Diagrams drawn with R (R Core Team (2019)). R: A Language and Environment for Statistical Computing. R Foundation for Sta-
tistical Computing, Vienna, Austria. https://www.R-project.org.
30. Su, T. W., Seo, S., Erlinger, A. & Ozcan, A. High-throughput lensfree imaging and characterization of a heterogeneous cell solution
on a chip. Biotechnol. Bioeng. 102, 856–868. https://doi.org/10.1002/bit.22116 (2009).
31. Wolf, E. Three-dimensional structure determination of semi-transparent objects from holographic data. Opt. Commun. 1, 153–156.
https://doi.org/10.1016/0030-4018(69)90052-2 (1969).
32. Hestenes, M. R. & Stiefel, E. Method of conjugate gradient for solving linear equations. J. Res. Natl. Bureau Stand. 49, 409–436.
https://doi.org/10.6028/jres.049.044 (1952).
33. Tinevez, J. Y. et al. TrackMate: An open and extensible platform for single-particle tracking. Methods 115, 80–90. https://doi.
org/10.1016/j.ymeth.2016.09.016 (2017).
34. Allier, C. et al. Quantitative phase imaging of adherent mammalian cells: A comparative study. Biomed. Opt. Express 10, 2768–2783.
https://doi.org/10.1364/BOE.10.002768 (2019).
35. Aknoun, S. et al. Living cell dry mass measurement using quantitative phase imaging with quadriwave lateral shearing interfer-
ometry: An accuracy and sensitivity discussion. J. Biomed. Opt. 20, 126009. https://doi.org/10.1117/1.JBO.20.12.126009 (2015).
36. Barer, R. Interference microscopy and mass determination. Nature 169, 366–367. https://doi.org/10.1038/169366b0 (1952).
37. Davies, H. G. & Wilkins, M. H. F. Interference microscopy and mass determination. Nature 169, 541. https: //doi.org/10.1038/16954
1a0 (1952).
Scientific Reports | (2021) 11:1290 | https://doi.org/10.1038/s41598-020-79661-9 10
Vol:.(1234567890)www.nature.com/scientificreports/
Acknowledgements
L.G. is very grateful to Dr. Kimihiko Sugaya of the Research Center for Radiation Protection, National Institute
of Radiological Sciences, Chiba, Japan for making the tsTM3, tsTM18 and CHO-K1 cells available to us. We
also thank Dimitrios Skoufias from IBS (Institut de Biologie Structurale, (VIC)-Cell Division Team), Grenoble
for providing HeLa cells and Dominique Bicout from Institut Laue-Langevin theory group for discussions. The
company IPRASENSE (Clapiers, France) and Fabrice Navarro (Department of micro and nano Technologies for
Healthcare and Biology, LETI CEA Grenoble) generously lent us the lens-free microscopes. C.A is very grateful
to Yves Usson (TIMC-IMAG, Uni. Grenoble Alpes, CNRS UMR 5525), Julien Savatier and Serge Monneret (Aix
Marseille Univ, CNRS, Centrale Marseille, Institut Fresnel, Marseille, France) who contributed to the quantita-
tive phase imaging comparisons. C.A is very thankful to Romaric Vincent and Thomas Bordy, for their help in
data acquisition and data analysis.
Author contributions
Original Concept: X.G.; Experimental Design: L.G.; M.B. and X.G.; Experiments carried out by L.G. with help
of P.O. (PCR, Western blot, dose responses); Image Reconstruction, total phase calculation and cell cycle iden-
tification by L.H. and C.A.; Cell tracking by L.G.; Data analysis: Fourier and statistical analysis: L.G. and J.Y.F.;
The manuscript was prepared by L.G.; M.B. and X.G.
Funding
The Funding was from the Commissariat à l’Energie Atomique (CEA); Agence Nationale de la Recherche (ANR);
Investissements d’avenir (ANR-11-NANB-0002) and Grenoble Alps Metropole (Proof of Concept program of
Canceropole CLARA (PROscan3D project).
Competing interests
Lens-free microscopy technique for live cell imaging has been developed by C. Allier and L. Herve thanks to a
close scientific collaboration with Iprasense company. C. Allier and L. Herve are inventors of patents devoted to
the holographic reconstruction.
Additional information
Supplementary Information The online version contains supplementary material available at https://doi.
org/10.1038/s41598-020-79661-9.
Correspondence and requests for materials should be addressed to L.G. or X.G.
Reprints and permissions information is available at www.nature.com/reprints.
Publisher’s note Springer Nature remains neutral with regard to jurisdictional claims in published maps and
institutional affiliations.
Open Access This article is licensed under a Creative Commons Attribution 4.0 International
License, which permits use, sharing, adaptation, distribution and reproduction in any medium or
format, as long as you give appropriate credit to the original author(s) and the source, provide a link to the
Creative Commons licence, and indicate if changes were made. The images or other third party material in this
article are included in the article’s Creative Commons licence, unless indicated otherwise in a credit line to the
material. If material is not included in the article’s Creative Commons licence and your intended use is not
permitted by statutory regulation or exceeds the permitted use, you will need to obtain permission directly from
the copyright holder. To view a copy of this licence, visit http://creativecommons.org/licenses/by/4.0/.
© The Author(s) 2021
Scientific Reports | (2021) 11:1290 | https://doi.org/10.1038/s41598-020-79661-9 11
Vol.:(0123456789)You can also read